ABSTRACT
Tensile test which was conducted in Part 1 establishes the engineering stress-strain relationship, which is used in basic engineering problems. However, finite element (FE) techniques used for analysis of large displacement and deformation problems use the true stress-true strain of materials in its structural characterisation. The aim of the current research work is to develop a mathematical model for predicting full non-linear true stress-strain curves for locally obtained high yield steel rebars used in the construction industry in Nigeria. Ramsberg-Osgood and Rasmussen expressions are used in developing the true stress-true strain model. Parameters developed in Part 1 were used in the in obtaining the full range curves.
Key words: Yield stress, true stress, true strain, finite element modelling, ultimate tensile strength.
The ?nite element method (FEM) based numerical analysis and other numerical analysis techniques are widely used in research involving structural steel and in the analysis and design of steel structures and elements and even in reinforced concrete. One major advantage of finite element analysis (FEA) is to effectively expand the limited experimental results using the mechanical characterisation of the structure (Arasaratnam et al., 2011). Thus, such simulation models for rebars require the use of realistic material stress-strain relationships, extending up to fracture that is, full stress-strain range (Arasaratnam et al., 2011).
Rebars play key role in reinforc ement concrete (RC) design in the construction industry. Steel helps to improve the strength of concrete because concrete is week in tension (Mosley, 1999).
The stress-strain curve of steel bars exhibit an initial elastic portion, a yield plateau, a strain hardening range and a range in which stress drops before fracture occurs (Kamkam and Adom-Asamoah, 2002). Recently, in order to model analytical the stress-strain behaviour of materials, Wu and Wei (2014) developed a single, continuous and explicit expression that can exhibit either hardening or softening response. This model provides a unified platform for modelling stress-strain of concrete confined by different materials, such as steel. Faridmehr et al. (2014) went on to conduct tensile tests based in conformance with ASTM E8 -04 in order to determine the mechanical properties of steel. They observed that the maximum true stress values were almost 15% higher than that of the maximum engineering values while the maximum true strain values at failure were 1.5% smaller than the engineering strain at failure. In the light of these resent research, this research work develops a model for the true stress-strain behaviour of reinforcement steel used in Nigeria.
BACKGROUND
The uniaxial tensile test, performed in the first part of this work, provides the basic mechanical properties, yield strength, ultimate tensile strength, and strain at fracture. The stress parameters were obtained using the original cross-section area of the specimen and the average strain within the gauge length is established using the original gauge length (Arasaratnam et al., 2011). As a result of the use of original dimensions in obtaining engineering stress-strain calculations in Part 1, such relations will always show elastic, strain hardening, and a strain softening range. As the applied load increases on the specimen, resulting in large amount of localised strain in a localised area of the stressed specimen (in the tensile test apparatus), necking occurs in this area. This results to a reduction in cross-sectional area of the region experiencing localised stain – this region is referred to as a ‘neck’ (Cabezas and Celentano, 2004; Jaquess and Frank, 1999).
Owing to the non-uniform stress- strain distributions existing at the neck due to high level of applied stress resulting to large deformations and strains, it has long been recognized that the changes in the geometric dimensions of the specimen need to be considered in order to properly describe the material response during the whole deformation process up to the fracture (Cabezas and Celentano, 2004; Jaquess and Frank, 1999). The true stress-true strain relationship is based on the instantaneous dimensions of the test material, rebars in this case.
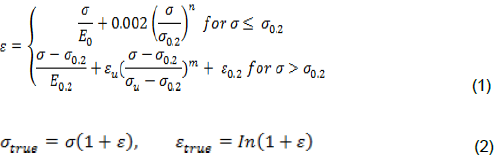
Engineering stress can be related to engineering strain. In the elastic domain, Felastic = Eεelastic in the range Fe < Fpl (flow stress in this case) and εe <εpl (plastic strain), where E is the elastic modulus of steel, which is a material property. True stress and the true strain, which recognize the deformed geometrics of the section during tests, can be established directly from the engineering stress and the engineering strain based on the concept of uniform stress, small dimensional change, and incompressible material, which is valid for steel (Arasaratnam et al., 2011). The resulting equations which can be obtained from literature are Ft = Fe (1 + εe) and εt = ln (1 + εe), where Ft and Fe are the true stress and engineering stress and εt and εe are the true strain and the engineering strain, respectively. Based on these two works of Ramberg-Osgood and Rasmussen discussed in Part 1, this paper develops the true stress – true strain curves from developed engineering stress-strain curves.
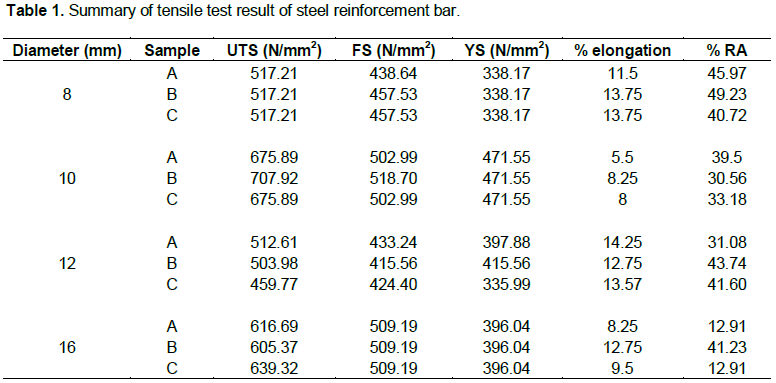
The methodology in performing the tensile test on steel based on AASHTO specification. Tension test is widely used to provide basic design information on the strength of materials and is an acceptance test for the specification of materials. The major parameters that describe the stress-strain curve obtained during the tension test are the tensile strength (UTS), yield strength or yield point (σy), elastic modulus (E), percent elongation (ΔL%) and the reduction in area (RA%). Toughness, Resilience, Poisson’s ratio (ν) can also be found by the use of this testing technique. A total of 12 samples of steel was sourced randomly from the market and tested using universal tensile machine for the tensile test. These 12 samples were of four different diameter sizes, 8, 10, 12, and 16 mm, each of 3 samples; A, B, and C. Results achieved from the test were used to compare a prepared Rasmussen’s model programme.
The tensile test method is a destructive test that is carried out by subjecting the specimen to a measured load that is sufficient to cause yield and then fracture of the material. The tensile tests carried out in this investigation were conducted at room temperature and the mechanical properties of the specimen obtained. The experiment carried out carried out at the Mechanical Laboratory, Faculty of Engineering, University of Benin, Edo state. The following were required to perform the tensile test: Universal Testing Machine (UTM), steel bars; 40 mm length of varying sizes meter rule, bench vice, veneer calliper, punching tool, sand paper and the hack saw.
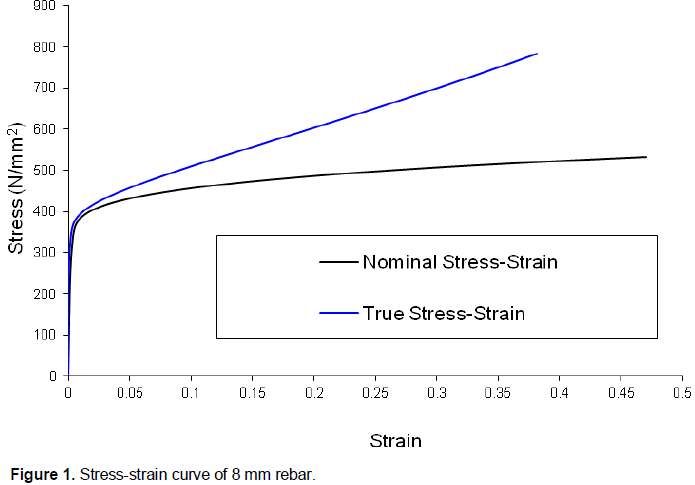
Table 1 shows the summary of the mechanical properties of the tested rebar used in determining the engineering stress-strain in Part 1 and the true stress-strain curves for this paper. Table 2 shows the Rasmussen parameters obtained for the various specimen after mathematical modelling. Applying Equation (1) the engineering stress-strain curves for locally produced steel specimen in Nigeria was obtained. Equation (1) is in line with the Rasmussen procedure. In order to convert engineering stress to engineering strain, Equation (2) was applied to values obtained from Equation (1). Figures 1 to 4 show the engineering stress-strain curves and the subsequent true stress curve for steel bars tested. It can be observed that the true stress- true strain curves for the tested rebar gave a totally different curve when compared to its engineering stress-strain curve. This implies that for large displacement analysis, using the engineering stress-stress curves could lead to incorrect results, that is, unrealistic displacements can be obtained from FE models.


This second paper concludes the first part which uses the expression of Ramberg-Osgood and Rasmussen for determining the engineering stress-strain curve for high yield rebars in Nigeria. Rasmussen’s analytical model has been proven accurate for predicting the stress-stain curve up to ultimate stress, up to the yield stress and beyond. After the establishment of the engineering stress-strain (as discussed in Part 1 of this two-part paper), established mathematical relationships were used in obtaining the true stress-strain curves for high yield steel made in Nigeria (that is, engineering stress-strain were converted to true stress-true strain).
Using engineering stress-strain curves as inputs in FEM models results in unrealistic results when large stresses resulting to large displacements are involved (that is, in the case of large loads form blasts and explosions). It is important to be able to establish the true stress- true strain curves for engineering materials as developed in this paper in order to be able to model their behaviour in scenarios involving large displacement. The true stress-true strain curve presented in this paper can be used for rebars in concrete subjected to extreme loads (that is, from explosions).
The authors have not declared any conflict of interest.
REFERENCES
|
Arasaratnam P, Sivakumaran KS, Tait MJ (2011). True stress- true strain models for structural steel elements', International Scholarly Research Network (ISRN) Civil Eng. ID 6564011. |
|
|
Cabezas EE, Celentano DJ (2004). Experimental and numerical analysis of the tensile test using sheet specimens', Finite Elem. Anal. Des. 40(5-6):555-575.
Crossref |
|
|
Faridmehr I, Osman MH, Adnan AB, Nejad AF (2014). Correlation between engineering stress-strain and true stress-strain curve, Am. J. Civil Eng. Archit. 2(1):53-59.
Crossref |
|
|
|
Jaquess KT, Frank K (1999). Characterization of the Material Properties of Rolled Sections', Tech. Rep. SAC/BD-99/07, SAC Joint Venture, USA. |
|
|
Kamkam CK, Adom-Asamoah M (2002). Strength and ductility characterisation of reinforcing steel bars milled from scrap metals. Mater. Des. 23:537-545.
Crossref |
|
|
|
Mosley (1999). Reinforced Concrete Design', 5th Edition Palgrave, London. |
|
|
|
Ramberg W, Osgood WR (1941). 'Determination of stress-strain curves by three parameters', Technical Notes National Committee on Aeronautics (NACA), P. 503, Wu Y, Wei Y (2014). General stress-strain model for steel and FRP – confined concrete', J. Comp. Constr. 10:1061-1090. |