Full Length Research Paper

ABSTRACT
This paper addresses the impact of using automated flagging devices in road construction instead of using construction workers. To examine the efficacy of automating this construction activity, a group of drivers with diverse characteristics/demographics was involved in the study. The diverse characteristics included gender, age, years of driving experience, and level of formal education (e.g., high school, college, and graduate degrees). Each participant was requested to view road construction scenarios involving the use of traffic control means/devices. The participants were requested to complete a questionnaire after viewing the scenarios to determine the drivers’ perceptions (that is, comfort/discomfort) in each scenario. The scenarios were displayed on a computer, and an eye-tracking software was used to determine where drivers focused their attention as they approached the road construction zones. During the viewing of the scenarios, the eye-tracking software recorded the driver’s eye movements, determined the screen coordinates where the driver was looking, and noted the time spent at each coordinate. The results did not show significant differences in the drivers’ perceptions for the use of traditional flagging methods and the automated ones. However, the traditional methods (that is, involving labor) scored higher on the visibility questions, and the automated systems were judged more effective by younger drivers. Moreover, the use of automated systems did not present any noteworthy obstacles for construction companies in implementing traffic control plans during roadway improvements or repair.
Key words: Site traffic management, automated flagging, construction industry, traditional flagging.
INTRODUCTION
Automation and robotization of the construction activities have been studied by many researchers in order to enhance work productivity and improve workers’ safety (Bock, 2015; Cai et al., 2019; Chui and Mischke, 2019; Lundeena et al., 2019). Although different in many ways, one may expect the construction industry to follow a path to automation similar to the one that took place in the manufacturing industry (Kahane and Rosenfield, 2004; Warszawski and Navon, 1998). A literature review shows that the repetitive and the more risky construction activities are good candidates for automation (Wetmore and Alemany, 2019; Paull, 2020).
One of such activities is flagging during road construction. If the use of automated devices prove as effective as the traditional methods, then the workers’ interest will also be served by eliminating an activity known for being among the highest risky activities in work zone. This can be proven by confirming that drivers respond appropriately to automated systems as they do to the construction flaggers common in today’s road construction zones.
METHODOLOGY
To study the efficacy of automating the flagging activity, drivers’ responses to the use of automated traffic control devices were recorded and analyzed. An experiment was conducted to measure when, how often, and for how long a driver would observe the various objects (that is, items, areas, devices, and aspects) when approaching roadway construction zones. The study utilized an open-source eye tracking software to collect the data. The software was developed by XLabs (xlabsgaze.com) as a Google Chrome Extension, and it works on any computer with Google Chrome browser and a webcam.
In this study, the software was used to determine the first moment each driver noticed the different objects (that is, items, areas, devices, and aspects) of a construction zone scene, as well as, to track how long he/she focused on each object in the different work zone scenarios. The drivers were also surveyed afterwards to determine their level of comfort in each scenario. The data collection was based on tracking the eye movements of the viewer and measuring the duration the viewer focused on a given object. The viewer was provided construction zones equipped by automated sensors or construction flaggers. The construction zones represented work conditions during daytime and during night hours. The objective was to determine which system/device/ approach was better in attracting the driver’s attention as he/she approached a roadway construction zone. The sequence of displaying the construction work zones was randomized to eliminate the possible influence of conditioning the drivers by following a certain sequence. Upon the completion of the viewing session, each viewer was requested to complete a questionnaire to capture the post-viewing feelings concerning the use of automated signals and the use of human flaggers in roadway construction. The total time required for completing a viewing session and the questionnaire was about 10-15 min.
Data collection
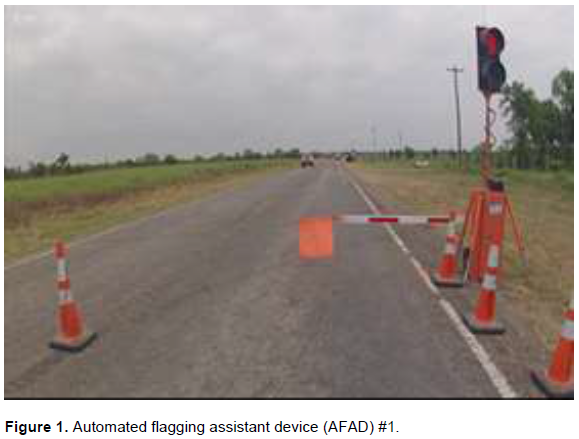
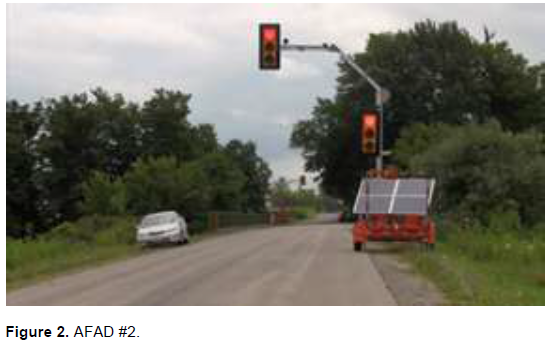
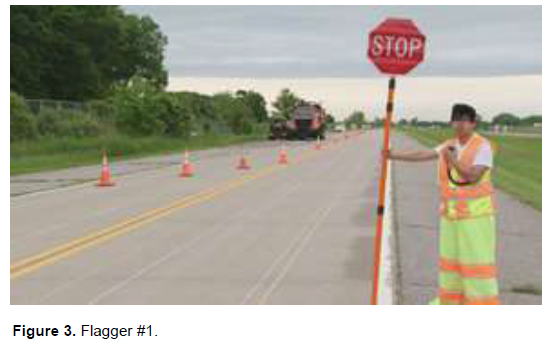
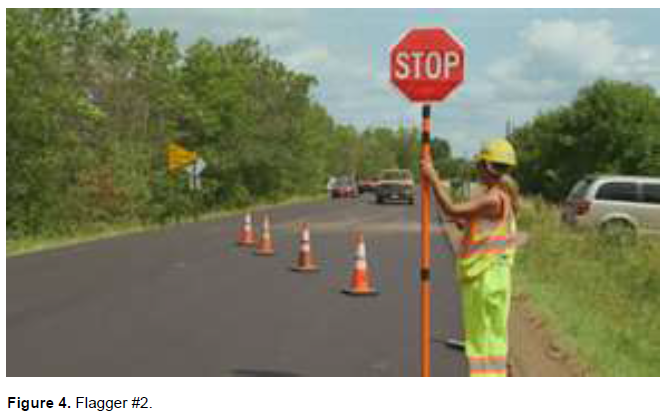
The data was collected as the software video recorded the viewer’s gaze information and stored the Cartesian coordinates of the viewer’s focus and time stamped each eye movement during the viewing session. From this data, the following information was composed: (a) which object was observed initially, (b) how long an object was viewed, and (c) how much the viewer’s gaze moved while viewing the construction work zone scenarios. Figures 1 to 4 show the types of construction zone scenarios viewed by the participants. The data collected from the eye-tracking software was also augmented by a post-viewing questionnaire to document the individuals’ feelings towards the automated signals in contrast to the use of human flaggers in roadway construction work zones. Specifically, the questionnaire requested each participant to indicate his/her agreement with the following statements:
1) The construction flagger was visible
2) The automated signaler was visible
3) I would follow the flagger’s directions
4) I would follow the signaler’s directions
5) The flagger will produce fewer traffic delays
6) The signaler will produce fewer traffic delays
7) I would follow the signaler's directions when no workers are present
8) The automated signal needs a barrier mechanism to enforce compliance
The participants were given the following choices as answers to each of the above statements: Strongly Agree, Slightly Agree, Neither Agree nor Disagree, Slightly Disagree, and Strongly Disagree. In addition, the participants were given the following instructions prior to starting a viewing session:
1) This study is designed to measure driver's responses to road construction zones.
2) The task is to analyze each picture as if you were driving a vehicle towards the construction zone. Focus on the areas that provide you with the information you need in order to safely navigate through the construction zone.
3) Each image will be displayed for five seconds.
4) The participant needs to calibrate the eye-tracking software before starting the recording.
5) No incentives are offered to the participants
Statistical analysis
Descriptive statistics using Microsoft Excel and IBM’s Statistical Package for the Social Sciences (SPSS) were used to explore the relationships between the viewers’ demographic variables (i.e., age, education, driving experience, gender) and the viewers’ perception/reaction to the construction work zone scenarios. Tables 4 to 7 provide the descriptive statistics for each variable. When comparing the visibility of the two systems that is, automated vs. flaggers), the flaggers generated a higher weighted average across all viewers (4.72 vs 4.61) and had a lower standard deviation. This suggests that the presence of humans (flaggers) may naturally attract more drivers’ attention than a control device.
The aggregated results show almost no difference in the responses regarding the willingness to follow directions for the entire population. However, examining the results by the demographic groups highlights some differences. As shown in Figures 13 to 15, it appears that age, education level, and years of experience can create gaps between the preference of flaggers and AFADs. Figure 13 may suggest that the younger generations have more acceptance of automated systems in daily life. It is speculated that the trends shown in Figures 14 and 15 are also influenced by the age of the drivers. Individuals with longer years of driving and/or degrees of higher education are obviously older in age. To further explore the above observations, One-Way Analysis of Variance (ANOVA) was performed to determine if the different age groups have statistically different answers. Tables 8 to 11 provide such analyses.
Table 8 shows no significant statistical difference (Sig. <0.05) in responses among the age groups, except in the drivers’ opinion about the need for a barrier to aid the automated device. For this issue, the significance was less than 0.05. However, one should not overlook that this opinion is speculative and could not be confirmed or negated. No other answers/results indicated significant statistical difference (Sig. < 0.05) across the demographic groups.
RESULTS
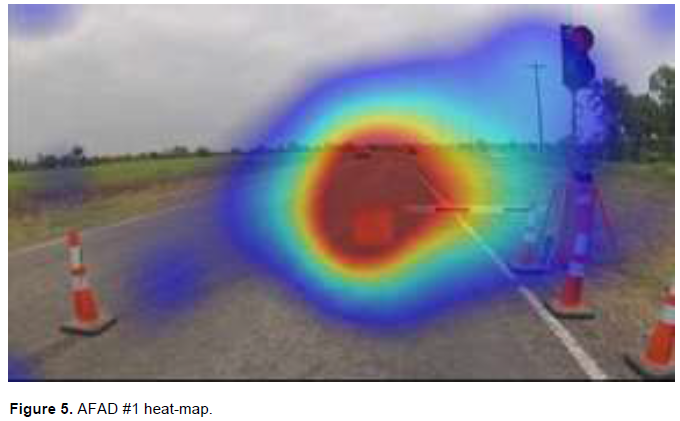
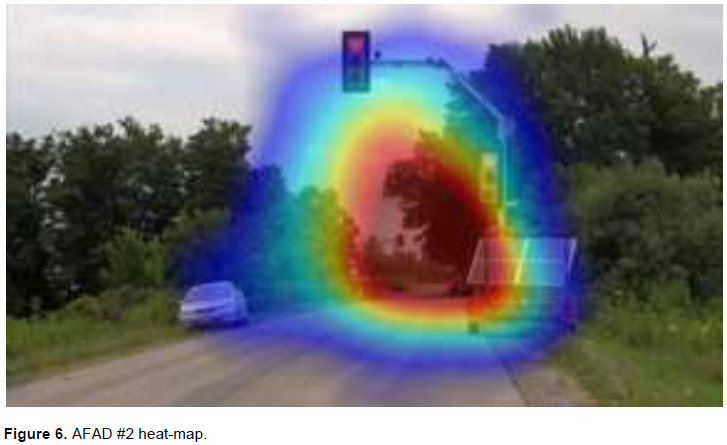
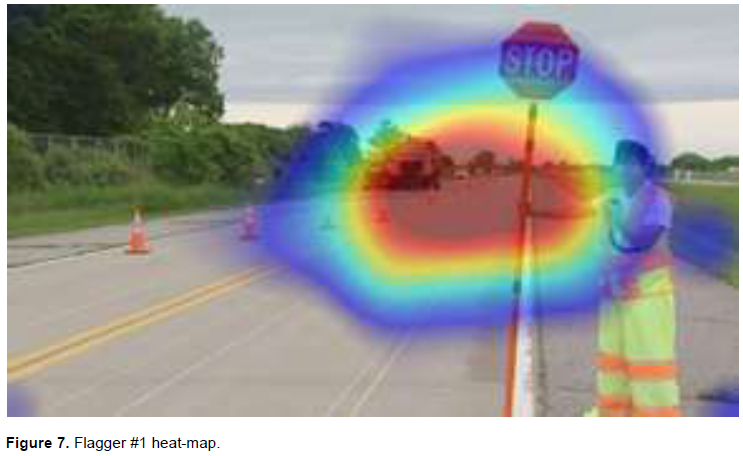
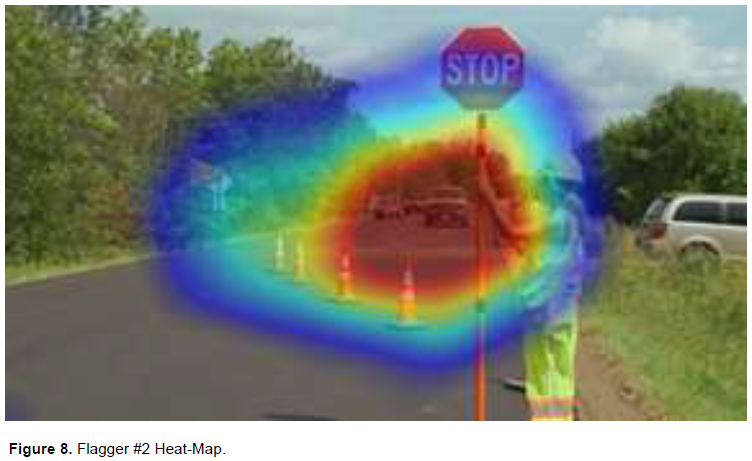
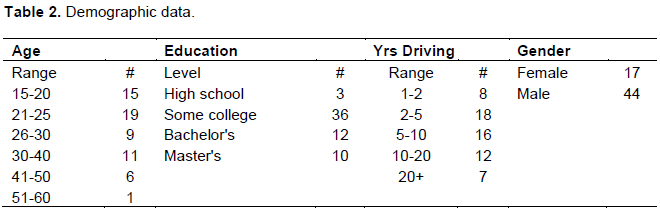
The study comprised 61 views. Examining the eye movements of any single view was not found useful. However, the software offers a heat-map image that shows the cumulative views for each scenario. Figures 5 to 8 show the heat-maps for the images provided in Figures 1 to 4. In a heat-map, the software maps the intensity of the cumulative focus in different colors. It shows in red the areas with the reviewers’ highest focus and shows in blue the areas with the reviewers’ lowest focus. In other words, the heat-maps show briefly the objects that captured most of the drivers’ attention, and the objects that attracted the least attention. Table 1 summarizes of the questionnaire results, and Table 2 summarizes the viewers’ demographics.

DISCUSSION
Figures 5 to 8 show no shift in the drivers’ primary focus (red area) when approaching a construction flagger or approaching an automated flagging device. Regardless of the flagging method (worker or device), the drivers focused generally on the road ahead to plan for the incoming maneuvers. There is no evidence for measurable differences in the attention or distraction due to the use of construction flaggers or the use of automated flagging devices.
The questionnaire data (Table 1) shows that about 90% of the drivers did not show preference/difference between the use of automated device or the use of a construction flagger. The drivers who agreed with the statements ranged between 53 and 56 out of 61 participants. However, this was the case regarding two issues: (1) which method should produce fewer delays, and (2) whether the automated device needs a barrier mechanism to enforce compliance. The number of drivers agreeing with the statements ranged between 29 and 35 out of 61 participants. Nonetheless, it should be noted that the responses to these two issues are speculative and could not be supported objectively.
The software also allowed the analysis of areas of interest (AOIs) in each scenario/image. In each scenario, four AOIs were identified: (1) the stopping mechanism (that is, stop sign for flaggers or traffic light for AFAD), (2) the roadway, (3) the operator of the stopping mechanism (that is, flagger or AFAD), and (4) a peripheral distractor object (e.g., surrounding scenery, heavy clouds, road signs, stalled car). Figures 9 and 10 illustrate the areas of interest (AOIs) in the construction work zones, and Table 3 provides an example of the AOI analysis provided by the software. Table 3 provides the average duration of the 1st view of each AOI (in seconds), the cumulative duration of viewing each AOI (in seconds) for all drivers, the average time per view (in seconds), and the percentage of the viewers that focused on each AOI. This information is summarized in Table 4 to compile the information available from the four scenarios shown in Figures 1 to 4. Table 4 provides the 1st view, total views, and percentage of drivers viewed each AOI. In this table, AOI-1 refers to the stopping mechanism (that is, stop sign for flaggers or traffic light for AFAD), AOI-2 refers to the roadway, AOI-3 the operator of the stopping mechanism (that is, flagger or AFAD), and AOI-4 prefers to peripheral distractor objects (e.g., surrounding scenery, heavy clouds, road signs, stalled car). It also provides the cumulative durations for the two automated scenarios (1+2), and the cumulative durations for the two manual (labor) scenarios (3+4).
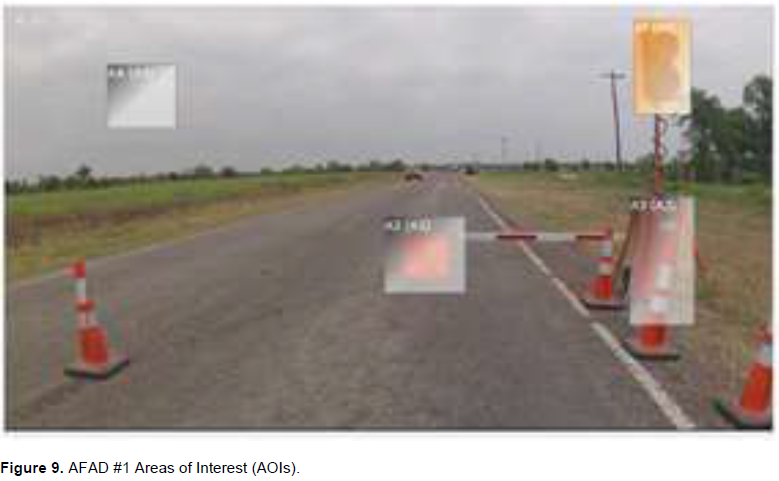
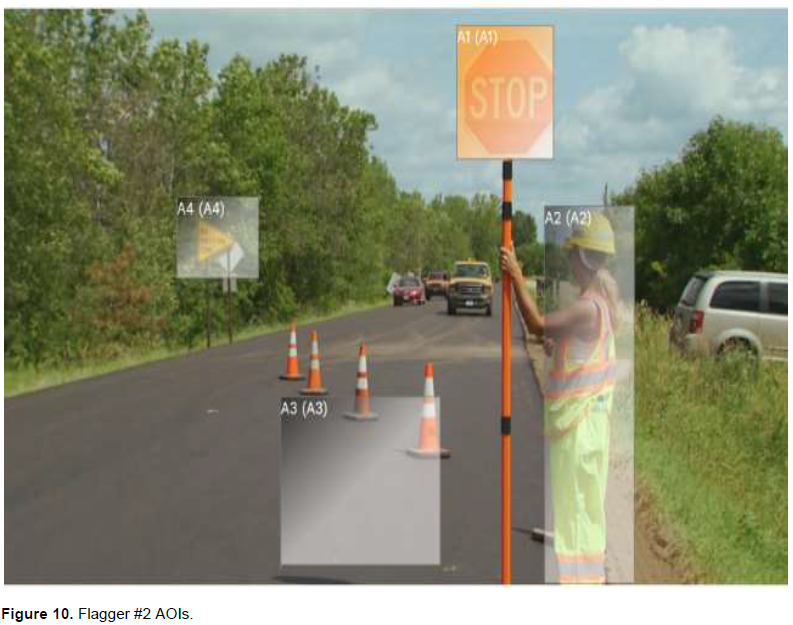


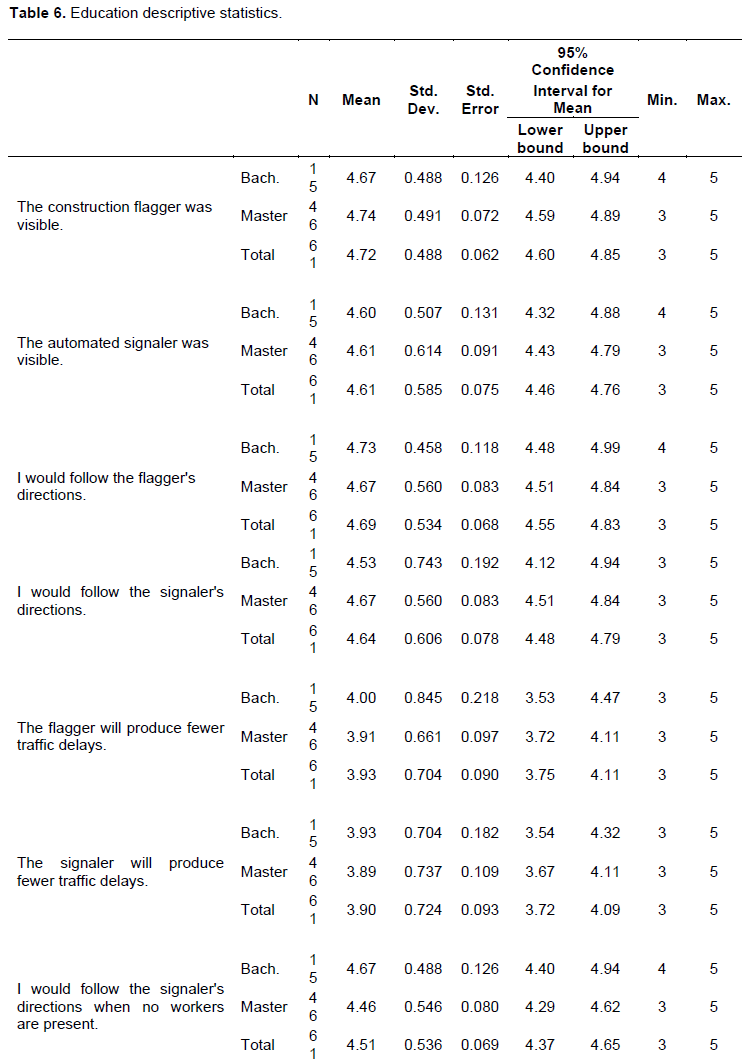


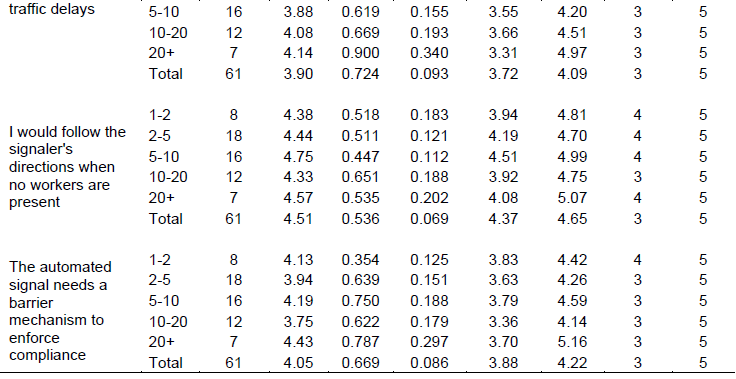
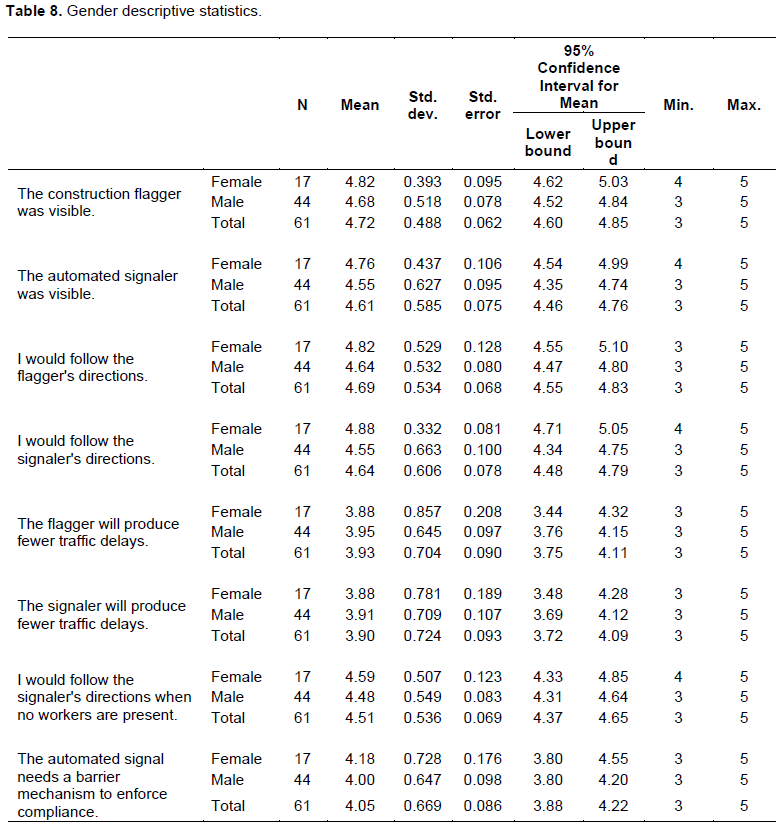

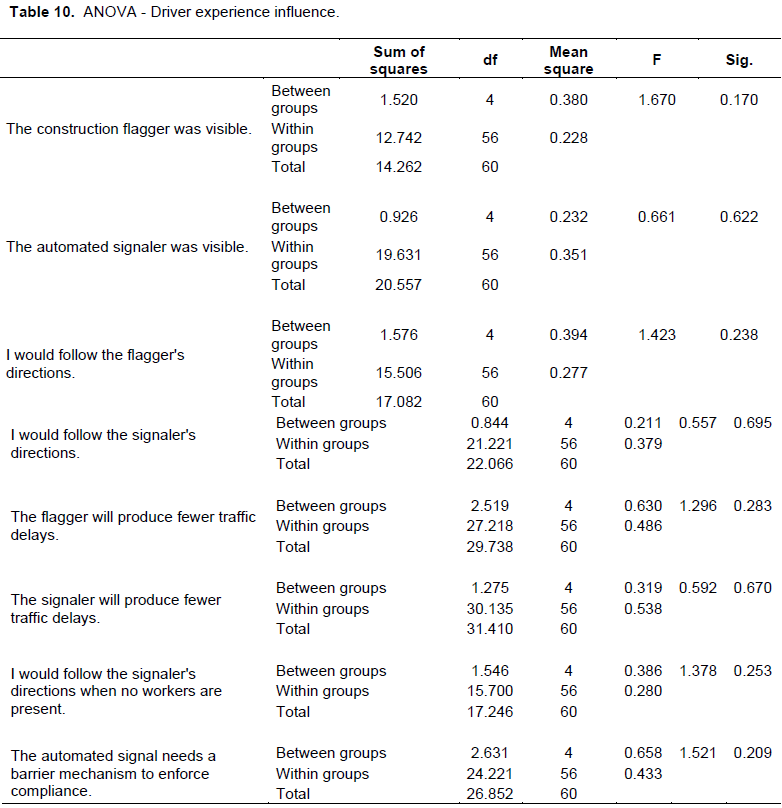
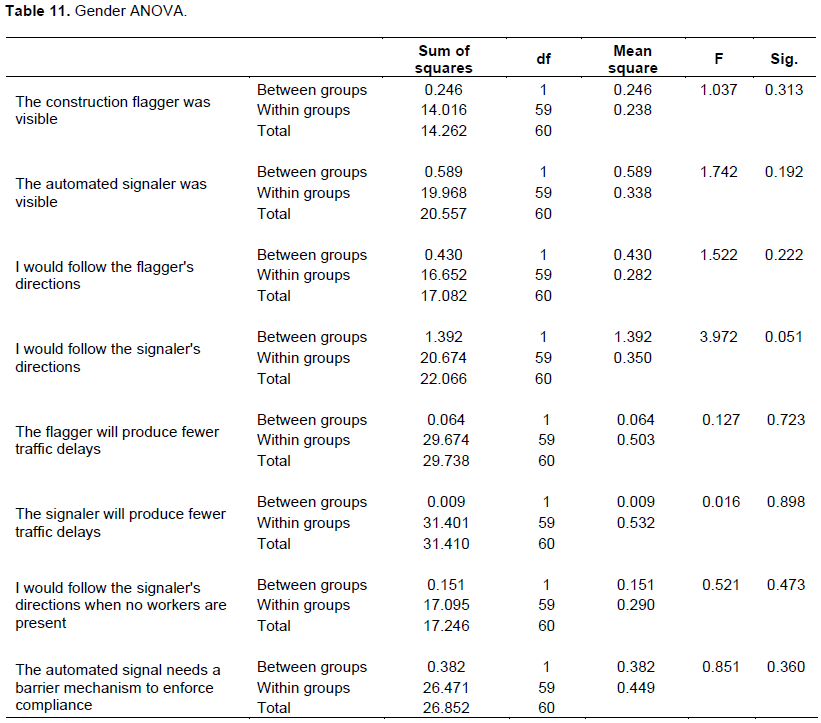
Figure 11 provides a graphic depiction of the 1st view data of each of the AOIs for each of the four scenarios. Series 1, 2, 3, and 4 refer to scenarios 1, 2, 3, and 4, respectively. In general, the Figure suggests that the automated systems are capturing more attention in the first view in all AOIs. This could be due to the unfamiliarity of the drivers with the automated devices and hence the natural curiosity of the viewers. This speculation could be supported by examining the cumulative time (Figure 12) instead of the 1st view time (Figure 11).
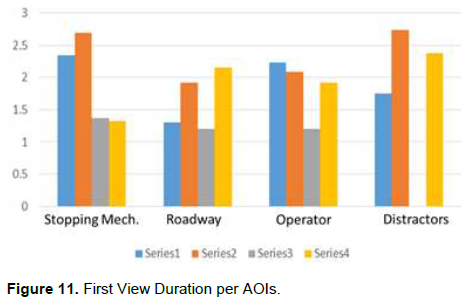
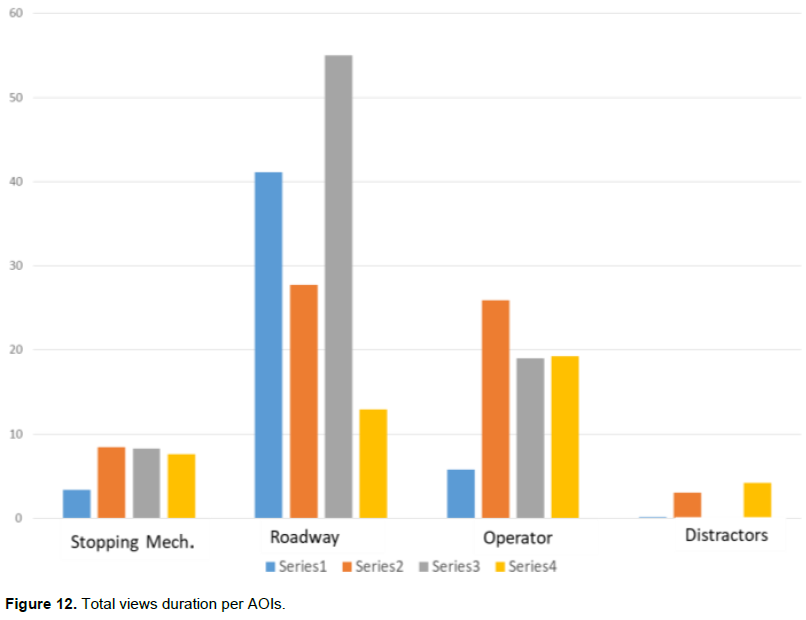

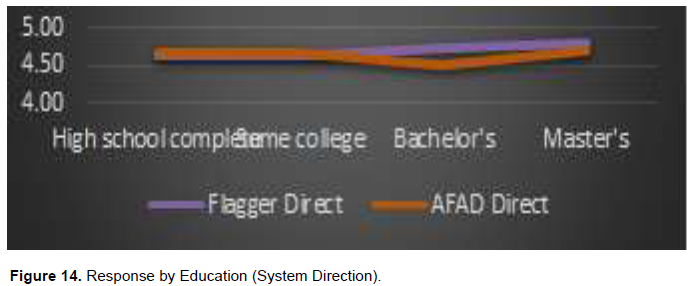
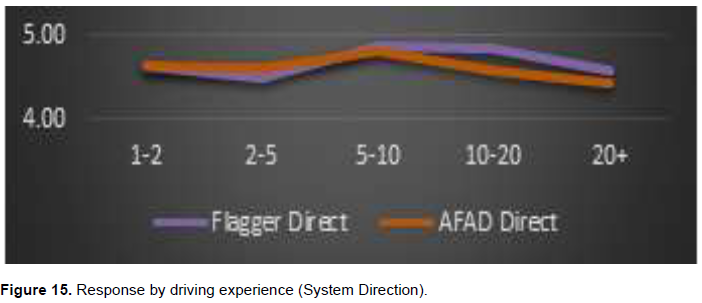
Figure 12 shows that there is no apparent/consistent trend differentiating the preference for one of the two systems (that is, automated vs. manual). The difference in the cumulative time spent on each AOI for each scenario could be explained by direct comparisons among the views. For example, the simplicity of the stopping mechanism (one traffic light) in scenario-1 (Figure 1) may explain the less time spent focusing on this object compared to the other scenarios. In scenario-3 (Figure 3), the presence of construction activities, heavy equipment, and traffic control cones may explain the reason for the roadway to capture the highest attention among the four scenarios. In scenario-2 (Figure 2), the large solar panel stand may be responsible for the stopping mechanism to capture the highest attention among all scenarios. The stalled car in scenario-2 (Figure 2) and the yellow sign at the end of the traffic control cones in scenario-4 (Figure 4) could explain why the distractors attracted more attention in these two scenarios than the other two scenarios.
CONCLUSIONS
Although limited in scope, this study indicates that the adoption of automated systems could be an adventurous alternative to the risky utilization of flaggers in road construction work zones. There are many potential benefits to using automated systems for roadway construction. These include increased worker safety, reduction of construction cost, and standardization of construction zone setups. In addition, automating this risky construction activity will assist in satisfying the construction labor shortage. However, the results also show that the need for barriers that complement the automated systems is a topic that needs further investigation. The technology is currently available and has been implemented in some areas around the nation. It appears that younger drivers tend to be more accepting of automation into their daily activities.
CONFLICT OF INTERESTS
The authors have not declared any conflict of interests.
REFERENCES
|
Bock T (2015). The future of construction automation: Technological disruption and the upcoming ubiquity of robotics. Automation in Construction 59:113-121. |
|
|
Cai S, Ma Z, Skibniewski M, Bao S (2019). "Construction Automation and Robotics for High-Rize Buildings over the Past Decades: A Comprehensive Review". Advanced Engineering Informatics 42:100989. |
|
|
Chui M, Mischke J (2019). The impact and Opportunities of Automation in Construction", |
|
|
Kahane B, Rosenfield Y (2004). "Real-time "Sense-and-Act" operation for construction robots", Automation in Construction 13(6):751-764. |
|
|
Lundeena KM, Kamata VR, Menassaa CC, McGeeb W (2019). "Autonomous motion planning and task execution in geometrically adaptive robotized construction work". Automation in Construction 100:24-45. |
|
|
Paull L (2020). "How Robotic Process Automation is Affecting the Construction Industry", |
|
|
Warszawski A, Navon R (1998). "Implementation of Robotics in Building: Current Status and Future Prospects". Journal of Construction Engineering and Management 124(1):31-41. |
|
|
Wetmore C, Alemany O (2019). "Transform your construction operations through RPA". |
|
Copyright © 2024 Author(s) retain the copyright of this article.
This article is published under the terms of the Creative Commons Attribution License 4.0


