ABSTRACT
Arsenic (As) in food and water has been linked to cancers and other diseases. Rice is of interest because many types may contain higher contents of As than other foods of terrestrial origin. As concentrations in rice produced from three Local Government Areas of Kano State were determined using Atomic Absorption Spectrophotometer. The mean As concentrations were 0.369 ± 0.092, 0.293 ± 0.126, and 0.255 ± 0.125 mg/kg in Kura, Tudun Wada, and Bagwai Local Government Areas of Kano State, respectively. The mean concentrations were all above the maximum limit of 0.2 mg/kg set by Alimentratious Commission (2014) and Commission Regulation (EU, 2015). Analysis of variance (ANOVA) revealed that there is no significant difference in mean concentration of As (mg/kg) among the three local government areas.
Key words: Rice, arsenic, Kura, Tudun Wada, Bagwai.
Arsenic (As) is a chemical element widely distributed in the earth crust. It is released from volcanoes and from the erosion of mineral deposits and is found throughout the environment. Human activities also add arsenic to the environment, through the burning of coal, oil, gasoline and wood, mining and the use of As compounds such as pesticides, herbicides, and wood preservatives (Singsby et al., 2007). As is a contaminant which exists in both toxic and non-toxic forms. Inorganic As species (asernite (AsIII) and asernate (AsV)) are more toxic than organic As (monomethyl As acid (MMA) and dimethyl As acid (DMA) (Ji-Young et al., 2013). Rice is the main food for over half of the world’s population owing to its nutritive properties and relatively low cost (Williams et al., 2008). Rice is the predominant food in at least thirty three developing countries (including Nigeria). It is a good source of carbohydrate providing 27% of dietary energy supply (Kennedy et al., 2015). The protein component in rice is relatively low (7 to 9% by weight), but it forms a major source of protein (50%) in these countries (Chammannejadian et al., 2013). Rice can contribute significant amount of thiamine, riboflavin, niacin, and zinc to the diet and smaller amounts of other micronutrients (Kennedy et al., 2015). As is taken up by plants from the water and soil when they are growing (Tritscher, 2014). While most crops do not readily take up As from the ground, rice easily absorbs the toxins from soil or water. This is primarily because it is grown in water flooded conditions, which allows arsenic to be more easily taken up by roots and stored in grains.
Therefore, a key problem is paddy fields irrigated with water pumped from shallow wells containing As-rich sediments (Codex Alimentarius Commission, 2014). Thus, rice could be considered an important contributor to total As intake in many parts of the world, where the diet is rice based (Liorente et al., 2012). Furthermore, it is estimated that the As content of rice is over 10 times greater than that found in cereal (Liorente et al., 2012). As in food and water has been linked to cancers and other diseases like heart disease, stroke, chronic lower respiratory diseases, diabetics and damage to the nervous system and brain. The final result of arsenic poisoning is coma and death (Agrawal, 2012; Green Facts, 2016). The determination of inorganic As species in food has become very important during the last few years, when As(III) and As(V) were reported to be class one human carcinogenic and found at high concentration in rice and rice-products. Therefore, from the health point of view, rice is of interest because many types may contain higher contents of As than other foods of terrestrial origin (Liorente et al., 2012). Since rice is a very important staple food for many countries and many regions of the world, a significant part of the global population is affected (Tritscher, 2014). United Nations have agreed to set the first international tolerable standard in order to limit cancer causing As pollution in rice, a key move to protect billions consumers (UN, 2014).
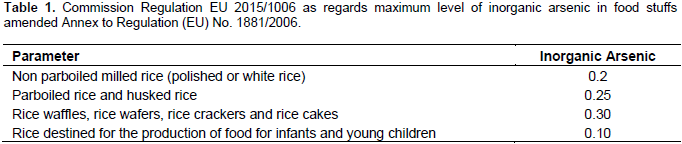
There have been a number of reports concerning the level of As found in rice and rice products. Yonkers (2012) has recommended that people should limit their rice consumption, after finding As in more than 60 rice products tested in U.S.A. Consumer report group is urging the US government to set limit on As in rice. Since the analysis of inorganic As is reliable for rice and rice based products, maximum levels for inorganic As should be set (EU, 2015). Codex Alimentarius Commission (CAC), at their annual meeting held in July, 2014 set a maximum of 0.2 mg of As per kg of polished rice. Commission Regulation EU 2015/1006 as regards maximum level of inorganic arsenic in food stuffs amended Annex to Regulation (EU) No. 1881/2006 as shown in Table 1. The commission suggested that the amendment should be effective from January, 2016. This paper aims to report the concentration of As in rice produced from Tudun Wada, Kura and Bagwai Local Government Areas of Kano State, during the wet season. The objectives of the study includes, comparison of the contents of As in rice between the three local government areas; findings would also be compared with the maximum permissible limit and other published results to ascertain if the study reveals normal and/or threat to health relative to the content of As in the rice samples. Statistical computation (ANOVA) would also be carried out to fix significant difference.
Sampling
Thirty rice samples were collected from ten different farms at various villages of Tudun Wada, Bagwai and Kura Local Government Areas during the raining season.
Sample preparation
Each sample was dried at 105°C in an oven and ground to fine powder using porcelain motor and pestle.
Sample digestion
Each sample powder (1 g) was weighed and transferred into 500 cm3 beaker. Aqua regia (30 cm3; HCl, HNO3 and H2O in the ratio of 1:1:5) was added to each of the samples. The mixture was heated at 120°C for about 5 h using hot plate. It was then filtered and transferred into 50 cm3 volumetric flask and made up to the mark with deionized water.
Preparation of calibration standard
As stock solution (100 mg/L) was prepared by drying 0.132 g of AS203 powder at 105°C for 5 h. The dried powder was then dissolved in 5 cm3 of NaOH solution. The solution was neutralized with 10 cm3 diluted H2SO4 (1:20). The solution was transferred into 1000 cm3 volumetric flask and made up to the mark with freshly boiled and cooled deionized water 0.00, 0.10, 0.20, 0.30, 0.40, 0.50, and 0.60 mg/L As solutions were prepared from 50 mg/L (50 cm3 of 1000 mg/L stock solution diluted to 1000 cm3) by serial dilution (Nall, 1971; Jill, 2016).
Arsenic determination
As level of all digested samples and working standards were measured using Buck Scientific Model 210/211 VGP Graphite Furnace Atomic Absorption Spectrophotometer. The concentration of As in each sample was obtained from the calibration plot by interpolation.
Statistical computation
Statistical computations were carried out using integrated statistical package for windows. Analysis of variance (ANOVA) was carried out on the results.
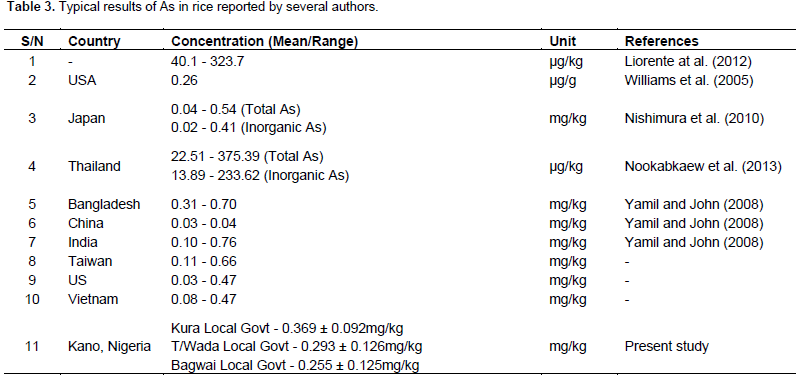
As content in different samples of rice produced from Tudun Wada, Kura and Bagwai Local Government Areas were determined using Atomic Absorption Spectrophotometry. The bar chart (Figure 1) represents the concentration of As in rice from ten different sampling areas in Kura Local Government Area. It is evident from the chart that the concentrations were of the order K5 > K3 > K10 > K8> K9 > K6 > K4 > K1 > K2 > K7. Rice obtained from sampling area K7, has a much lower As content that falls below the maximum limit. The concentration in the sampling area in Tudun Wada Local Government (Figure 2) were of the order T3 > T2 > T8 > T4 > T5 > T1 > T6 > T9 > T10 > T7 with T3 having the highest content and K7 much lower content, samples T7, T9 and T10 falls within the safe level. While the level in the sampling areas from Bagwai is as shown in Figure 3. The order is B6 > B7 > B8 > B3 > B5 > B> B9 > B2 > B1 > B10. Samples B1, B2, B9 and B10 were within the safe level (that is, below 0.2 mg/kg). The mean and standard deviation of As concentration in Kura, Tudun Wada and Bakwai Local Government Areas were 0.369 ± 0.092, 0.293 ± 0.126 and 0.055 ± 0.125 mg/kg, respectively. The mean concentration was all a little above the maximum limit of 0.2 mg/kg set by Alimentarious Commission, United Nations (UN, 2014) and Commission Regulation (EU, 2015). Kura Local Government has the highest As content followed by Tudun Wada Local Government, while samples obtained from Bagwai has the least content. However, analysis of variance (ANOVA) revealed that there is no significant difference in mean concentration of Arsenic (mg/kg) among the three local government areas (Table 2). These results are similar to those reported by Williams et al. (2005), Nishimura et al. (2010), Yamil and John (2008) but in contrast to other authors (Liorente et al., 2012; Nookabkaew et al., 2013) who reported higher values in their regions (Table 3).

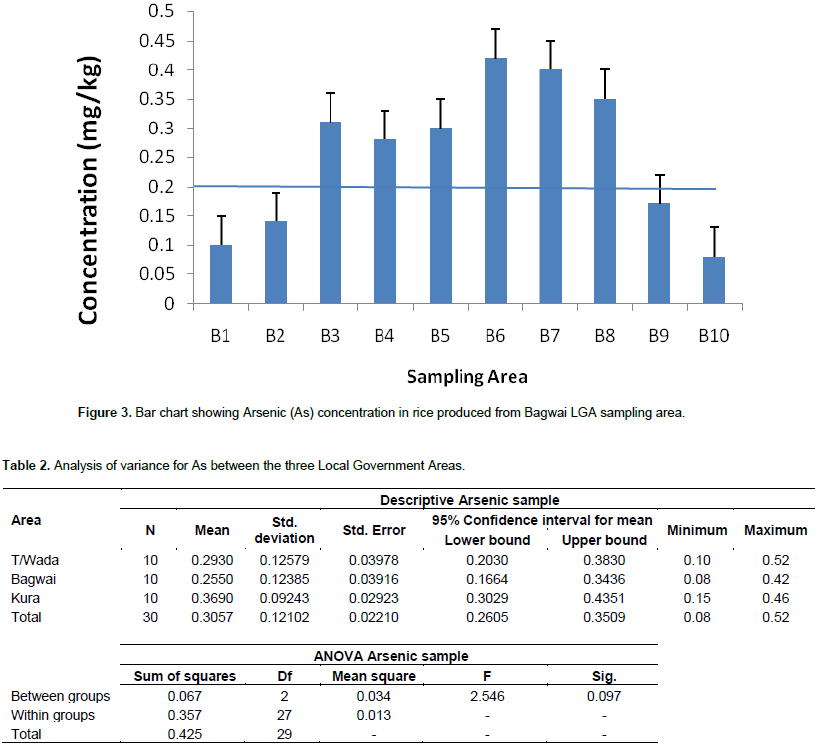
Human exposure to toxic elements has been the topic of increasing attention among researchers, formulators and managers of health and nutritive policies due to its damages to health (Ayodele and Bayero, 2010). The results obtained in this study revealed that the mean concentrations of As in rice from the three local government areas were all above the maximum limit set by the Alimentarious Commission, United Nations (UN, 2014) and Commission Regulation (EU, 2015). However, the levels in some sampling areas were below the limit (that is, within the safe level). Comparing the levels of As between the three local government areas, ANOVA revealed that there is no significant difference.
(1) Measures should be taken to avoid irrigation of rice in an environment contaminated with As by constantly monitoring its level in water and soil, as rice is grown in water flooded condition.
(2) People should limit rice consumption to avoid accumulation of the toxic element.
(3) Government should set a monitoring committee to encourage collaboration between the farmers and researchers.
The authors have not declared any conflict of interests.
This research was sponsored by TETFUND. The authors gratefully acknowledge the support given by the body. They are also immensely grateful to Prof. M. I. Mohammed for his comments on the draft of the manuscript. Finally, they would like to acknowledge with gratitude the Management of Yusuf Maitama Sule University, Kano and everyone that has contributed to the success of the research.
REFERENCES
|
Agrawal A (2012). Toxicity and fate of Heavy metals with particular reference to Developing Foetus. Advances in life science. 2(2):29-38.
|
|
|
|
Ayolede JT, Bayero AS (2010). Copper and calcium concentrations in hair and fingernails of some Kano inhabitants. Acta SATECH. J. Life Phys. Sci. pp. 122-129.
|
|
|
|
Chamannejadian A, Sayyad G, Moezzi AM, Jahangiri A (2013). Evaluation of estimated daily intake (EDI) of cadmium and Lead in rice (Oryza sativa L) in calcarius soils. Jehse biomed central. Com/articles/10.1186/1735-2746-10-28).
|
|
|
|
Codex Alimentarius Commission (2014). Governments agree to stem cancer causing arsenic in rice. The Japan time news.
|
|
|
|
Commission Regulation (EU) 2015/1006 (2015): Amending regulation (EU) No. 1881/2006 as regards maximum levels of inorganic arsenic in foodstuffs.
|
|
|
|
Green Facts (2016). Facts on Health and the Environment Arsenic. Published Green Facts Scientific Board.
|
|
|
|
Jill B. Calibration Curves/Protocol–JOVE (2016).
View
|
|
|
|
JI-Young K, Won-II-K. Kunchikrishnan AK, Kang D, Kim D, Lee Y, Kim Y, Kim C (2013). Determination of arsenic species in rice grains using HPLC-ICP-MS. Food Sci. Biotechnol. 22(6):1509-1513.
Crossref
|
|
|
|
Kennedy G, Burlingame B, Nguyen VN (2015). Nutritional contribution of rice and impact of biotechnology in rice consuming countries.
|
|
|
|
Liorente T, Josep C, Jose FLS, Centrich F, Rubio R (2012). Determination of arsenic species in rice and rice-based infant cereals using ICP-MS. Pure Appl. Chem. 84(2):225-238.
Crossref
|
|
|
|
Nall WR (1971). An improve method for the determination of As in steal. Analyst 96:398402.
Crossref
|
|
|
|
Nishimura T, Hamono NM, Sakakibara N, Abe T, Maekawa Y, Maitanic T (2010). Determination method for total arsenic and partial digestion method with nitric acid for inorganic arsenic speciation in several varieties of rice. Shokuhin Eiseigaku Zasshi. 51(4):178-81.
Crossref
|
|
|
|
Nookabkaew S, Rangkadilok N, Mahido C, Promsuk G Satayavivad J (2013). Determination of Arsenic species in rice from Thailand and other Asian countries using Extraction and HPLC-IC-MS Analysis. J. Agric. Food Chem. 61(28):6991-6998.
Crossref
|
|
|
|
Singby RW, Al-Horr R, Policl CA, Lee JH (2007). Sources of Arsenic. American laboratory. 39(10):42-46.
|
|
|
|
Tritscher A (2014). Governments agree to stem cancer causing arsenic in rice. UN news on July 17, 2014.
|
|
|
|
United Nations (UN) (2014).
View
|
|
|
|
Williams PN, Price AH, Raab A, Hossain SA, Feldmann J, Marharg AA (2005). Variation in Arsenic speciation and concentration in paddy rice related to Dietary exposure. Environ. Se. Technology. 39(15):5531-5540.
Crossref
|
|
|
|
Yamili JZ, John MD (2008). Arsenic in Rice: estimating normal levels of total arsenic in rice grain. Environ. Sci. Technol. 42(10):3856-3860.
Crossref
|