Full Length Research Paper
ABSTRACT
The purpose of this study was to determine the concentration and toxicological implications of heavy metals (Cr, Cd Zn, Fe, Pb and Cu) in effluents coming out Eastern Industrial Zone (EIZ). Wastewater samples were collected from three points (0, 200 and 500 m) from discharge point was collected with three replications. The wet digestion procedure was employed to solubilize the metals from the collected samples. The validation of this procedure was performed by spiking the samples with a standard solution of each metal having a known concentration and percentage recovery values in the range of 92.0-102% were obtained. The results obtained from this study showed overall concentrations of heavy metals (Cr, Cd, Zn, Fe, Pb, and Cu) in the range of (0.20-1.04), (0.04-0.08), (0.07-0.21), (2.89-5.15), (3.11-45) and Cu (0.30-0.99) in mg/L, respectively. The concentrations of heavy metals (Cr, Cd, Zn, Fe, Pb and Cu) in the wastewater were above the recommended limit of both WHO and FAO. Based on facts obtained from this study, we suggest concerned official body (ies) to take the necessary precaution measures for cleaning the polluted factory effluents.
Key words: Effluent, heavy metal, toxicological Implications, percentage recovery.
INTRODUCTION
Industries are to a large extent, a contributing factor to the economic growth of any nation. However, most of these industries have in no small way contributed to the level of pollution of our surface and ground water aquifer. In fact, many aquatic organisms have been brought into extinction as a result of the introduction of certain contaminants and pollutants (Ogunleye and Izuagie, 2013).
Industrial wastewater generated by the industries is one of the sources of pollution. Contaminated air, soil, and water by effluents from the industries are associated with heavy disease burden (WHO, 2002). It contains high levels of heavy metals that may pollute the environment once it is discharged to the nature. These metals include As, Cr, Cu, Zn, Al, Cd, Pb, Fe, Ni, Hg, and Ag. They are some of the most toxic types of water pollutants. According to Khaled et al. (2008), at least 20 metals are toxic, and approximately half of them are emitted to the environment in quantities that are hazardous to the environment, in addition to the human health. Heavy metals are of serious environmental concern in recent years.This is because of their toxicity, bioaccumulation and bioconcentration in living organisms. Also, their persistence in the environment and non- biodegradable nature has heightened its concern (Yoon et al., 2006).
The most widespread visual evidence of heavy metal toxicity is a reduction in plant growth (Sharma and Dubey, 2007, Akhionbare et al., 2010). On the other hand, wastewater is also a resource that can be applied for productive uses, since it contains nutrients that can be used for the cultivation of agricultural crops (Hati et al., 2007; Chandra et al., 2009; Rath et al., 2011). The present study was undertaken to assess the extent of toxic trace heavy metal contamination in industrial effluent around the fields of eastern industrial zone of the Oromia National Regional State. The study was necessary as many farmers used this effluent for irrigation water due to absence of irrigation water and no research has been conducted to elucidate the extent of the problem around the study area.
MATERIALS AND METHODS
Description of the study area
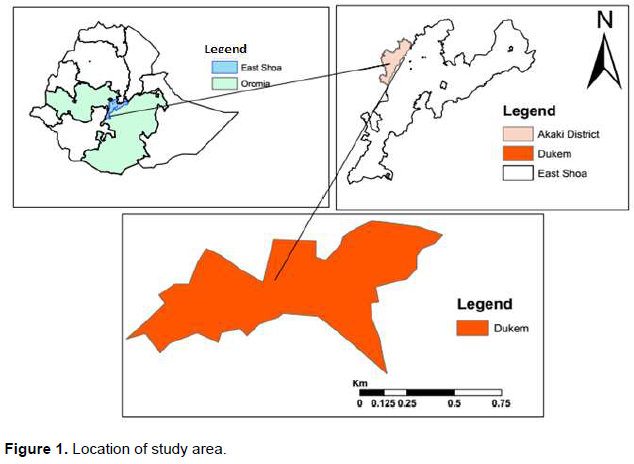
This study was conducted around Eastern EIZ in Dukem, Ethiopia. The EIZ of Ethiopia is located at 35 km southeast of Addis Ababa and 680 Km from the port of Djibouti with 200 ha of land in Dukem (Figure 1) (Bahiru et al., 2019). For Ethiopia, EIZ is the first and largest-scale industrial park. The Ministry of Industry of Ethiopia requires the EIZ to focus on Chinese companies in the area of textile, apparel, building materials (including east steel, cement factory), mechanical manufacturing, and agricultural processing. Currently, 26 Chinese firms are operational and producing different products for export markets having agreement with EIZ in all targeted areas. In addition, to the present 26 manufacturing industries, more than 20 other manufacturing industries are about to join the EIZ (Gebregeorgis, 2016; Bahiru et al., 2019). This implies that more wastewater from various industry of EIZ is discharged to the surrounding through one wastewater channel; this wastewater is used as source of irrigation water by the farmers around this industry area.
Apparatus and equipment
The instruments used for this study were flame atomic absorption (FAAS), Agilent technology with model no. 210 for toxic heavy metal determination of wastewater and a Microprocessor based pH-EC-TDS Meter; Model 1615 was used for the determination of soil pH and conductivity. The common laboratory apparatus which were used during the study include; different sized beakers, erlenmeyer flasks, funnels, volumetric flasks, block digester, fume hood, droppers, glass pipettes, spatula, measuring cylinders, vinyl gloves, analytical balance, and conical flasks.
Chemicals, reagents and standard solutions
All the chemicals used were analytical reagent grade. Deionized water and distilled water were used for all preparation and dilution purposes throughout the study. HNO3 (69%), KCl, H2SO4 (98%), H2O2 (30%) and HCl were used for digestion. Stock standard solutions of 1000 ppm were prepared for the selected heavy metals (Cr, Cd, Zn, Fe, Pb, and Cu). pH 4 and 7 Buffers were used for pH meter calibration and potassium chloride was used for conductivity meter calibration.
Wastewater sampling and preparation
The industrial wastewater (effluent) samples were collected from Eastern Industrial Zone. Samples were collected during February 2017. A total of three samples were collected; measurement points for the sampling were designated as N1 to N3. Wastewater samples were collected at the discharge point designated as N1, 200 m away from the discharge point designated as N2 and at 500 m away from the discharge point designated as N3 samples were collected in clean and dry polyethylene bottles. These three bottles immediately acidified with 1 ml nitric acid, for later analysis of metal concentrations. The purpose of the acid is to keep the metals in solution and to avoid adsorption to the container walls (APHA, 1999).
Digestion of wastewater samples
The water samples from each sampling bottle were mixed thoroughly by shaking. A 50 ml filtered aliquot of water sample was pipetted into a digestion flask. The metal percentage found in the water was determined by digestion in 3 ml concentrated HNO3 and 3 ml H2O2 below 80°C for 1 h until a clear solution was observed. The clear solution was diluted to 100 ml volumetric flask with distilled water and blank digestion was also carried out in the same way (Birtukan and Gebregziabher, 2014). The blank solution contained all reagents except wastewater. All samples were digested in triplicates. The digests were analyzed for the toxic heavy metals by using FAAS in Holeta Agricultural Research Center Chemistry Lab. The concentration of each metal was calculated using the formula below (Birtukan and Gebregziabher, 2014):

Where: CM = Concentration of metal, DF = Dilution factor, NV = Nominal volume, SV= Sample volume (mL).
Instrument’s operating conditions
Concentrations of Cr, Cd, Zn, Fe, Pb, and Cu in the wastewater were determined using FAAS in Holeta Agricultural Research Center Chemistry Laboratory. Calibration curves for each heavy metal was set to ensure the accuracy of the instrument and to confirm that the results of determination were true and reliable. Standard stock solutions of 1000 ppm for all the metals were obtained. These solutions were diluted to the desired concentrations to calibrate the instrument (A 100 ppm multi-element solution containing Cr, Cd, Zn, Fe, Pb, and Cu was utilized to prepare elemental calibration solutions. This multi-element solution was diluted with 2% nitric acid to obtain working standards for each metal of interest).
Instrument calibration
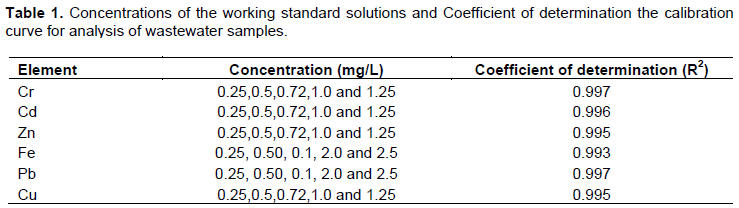
Calibration curves for Cr, Cd, Zn, Pb, Fe and Cu were obtained by using suitable standard solutions prepared from stock solutions. The quality of results obtained for heavy metal analysis using FAAS are seriously affected by the calibration and standard solution preparation procedures. Calibration standards for the elements analyzed were prepared in concentration range expected for the analytes in the samples analyzed. In addition, the
calibration standards were prepared by taking into consideration the optimum working ranges of the elements. The correlation coefficient (R2) values that are closer to the absolute value of 1 indicate that there is a strong relationship between the variables being
correlated whereas values closer to 0 indicate that there is no linear relationship. As shown in Table 1, the correlation coefficients of metals were found to be from 0.993-0.997, which indicate strong relationship. The correlation coefficients of the elements were determined using prepared standards versus their corresponding absorbance. The prepared standard concentration and the corresponding correlation coefficients of the calibration curve for each metal in wastewater are presented in Table 1.
Method detection limit
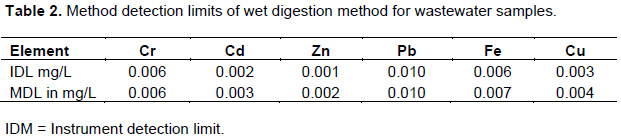
Three replicate blank samples were digested following the same procedures utilized for digesting the wastewater samples. Each blank were assayed the metal contents (Cr, Cd, Zn, Pb, Fe and Cu) by FAAS. The SD of the three replicate blanks was calculated to determine the Method detection limit (MDL) (David and Terry, 2008) (Table 2). MDL was then calculated according to equation indicated below.
MDL = YB +3SD (2)
Where: YB = Blank mean
SD= standard deviation
Method validation
In present study due to the absence of certified reference materials for effluent samples in our laboratory, the validity of the digestion procedure, precision and accuracy of FAAS were assured by spiking effluent samples with standard of known concentration. The spiked and non-spiked effluent samples were digested following the same procedure employed in the digestion of the respective samples and analyzed in similar condition. Then the percentage recoveries of the analytes were calculated by (Deribachew et al., 2015; Kedir, 2015; Bahiru and Teju, 2019):

Where, CM = concentration of metal of interest.
Statistical analysis
The analyses of variance (ANOVA) were performed to examine the significance level of all parameters measured. Least Significant Difference (LSD) test was used for means comparison. The level of significance for means comparison was p<0.05. Methodological precision was therefore evaluated with standard deviation (SD).
RESULTS AND DISCUSSION
Physico-chemical analysis of wastewater samples
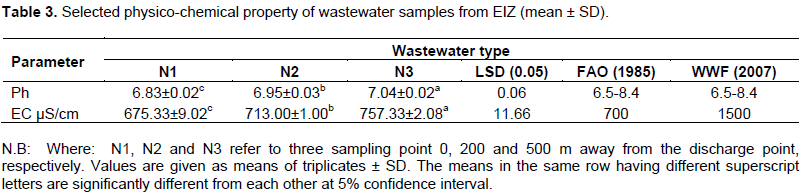
Assessment and control of irrigation water quality depend upon physico-chemical properties like pH and electrical conductivity (EC) these are used to identify and quantify toxicants and to provide data that, for regulatory purposes, could be compared to allowable concentrations for particular recipient water (WWF, 2007). The results of the physico-chemical parameters of the wastewater samples investigated in the present study are presented in Table 3. Electrical conductivities of wastewaters values collected from EIZ in N2 and N3 were above the recommended limit set by AFO (1985), but below the value set by critical limits as described by WWF (2007) for Pakistan. Conductivity is measured to establish the pollution zone around an effluent discharge (Tessema et al., 2015). The minimum EC of an effluent recorded in a similar study was found to be 3101 μS/cm and the maximum was 4630 μS/cm (Tessema et al., 2015).
Method validation
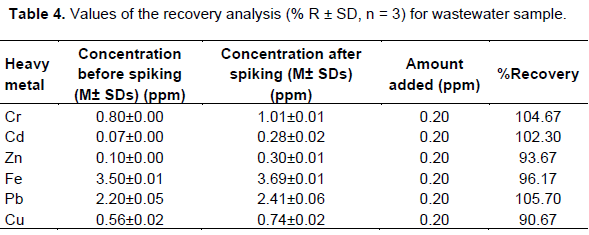
The procedures used in the current study were validated by spiking method and the percent recovery values (90.67‑105.70%) are given in Table 4. The obtained results are in acceptable range which is not less than 70% and no greater than 125% according to Duan et al. (2003) and which revealed that the digestion method and the FAAS analysis utilized in the present study were reliable.
Level of heavy metals in wastewater samples
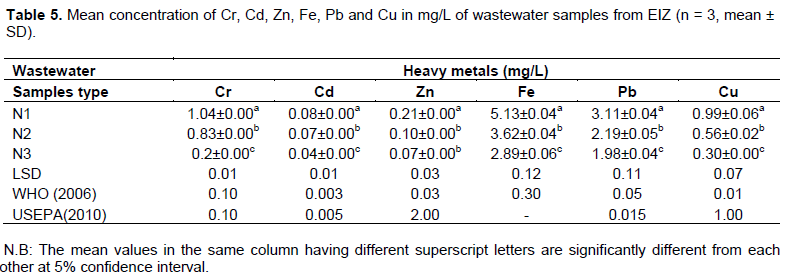
The distribution of heavy metals (Cr, Cd, Zn, Pb, Fe and Cu) in wastewater samples from the EIZ has been evaluated. Wastewater samples were collected from the discharge point, 200 and 500 M away from point of discharge and taken to the laboratory for chemical analysis. As shown in Table 5, the results obtained revealed that the concentration of the heavy metals were found to be in the order of Fe > Pb > Cr > Cu >Zn > Cd. Moreover, the concentration of each heavy metal was higher than the permissible limit set by WHO (2006) which could pose a huge threat to human health and the natural environment.
Concentration of Chromium (Cr) in wastewater samples
Chromium plays a vital role in the metabolism of cholesterol, fat, and glucose. Its deficiency causes hyperglycemia, elevated body fat, and decreased sperm count, while at high concentration it is toxic and carcinogenic (Chishti et al., 2011).The concentrations of chromium in the wastewater samples at N1, N2 and N3 were 1.04±0.00, 0.83±0.00 and 0.2±0.00 mg/L, respectively. These values are above the permissible limit set by WHO (2006) and USEPA (2010) (Table 5) for crop irrigation. Chromium a toxic pollutant due to its harmful effects on human health, especially in its hexavalent (VI) form (Abagale et al., 2013). A remedy must be sought for Cr levels in the effluent of industries where the metal is high in effluent.
Concentration of Cadmium (Cd) in the wastewater samples
Cadmium is also a non-essential heavy metal. It is extremely toxic even at low concentration. It causes learning disabilities and hyperactivity in children (Hunt, 2003).The results show that the Cd concentrations in the wastewater samples at N1, N2 and N3 was 0.08±0.00, 0.07±0.00 and 0.04±0.00 mg/L, respectively. The sample at N1 recorded the highest concentration than that of samples at N2 and N3 (Table 5). The concentrations of Cd obtained in the present study are above the permissible limit set by WHO (2006) and USEPA (2010) for crop irrigation. Cadmium is considered to be hazardous metal because of its toxicity and accumulation capacity in the living system (Singh et al., 2005). Cadmium used in industry finds its way into many water supplies. Old galvanized pipes and new plastic (PVC) pipes are sources of cadmium in water pump (Tyagi, 2014).
Concentration of Zinc (Zn) in the wastewater samples
The other heavy metal determined in the wastewater sample was Zn. Its concentrations in the samples at N1, N2 and N3 were 0.158±0.00, 0.132±0.00 and 0.249±0.00 mg/L, respectively. The sample at N1 recorded the highest concentration than that of samples at N2 and N3 (Table 5), and all the samples exceeded the recommended maximum concentration for crop irrigation (WHO, 2006). But the concentration of Zn was below the permissible limit set by USEPA (2010). Zn is the least toxic and is an essential element in the human diet as it is required to maintain the proper functioning of the immune system, normal brain activity and is fundamental in the growth and development of the foetus, but a very high concentration of zinc is very toxic, hence harmful to the human body (Helen and Othman, 2014).
Concentration of Iron (Fe) in wastewater samples
Iron at high concentration, it causes tissues damage and some other diseases in humans. It is also responsible for anemia and neurodegenerative conditions in human being (Fuortes and Schenck, 2000). Concentrations of iron in the wastewater samples at N1, N2 and N3 were 2.89±0.04, 3.62±0.04 and 5.13±0.06 mg/L, respectively. Iron concentrations in three samples were above the recommended maximum concentration (RMC) for irrigation WHO (2006) and USEPA (2010) (Table 5). The concentration of iron can therefore be said to be high for crop irrigation purposes in the area. The highest concentration was recorded in sample at the point of discharge. According to Ayers and Westcot (1985), high concentration of iron in wastewater contributes to soil acidification and loss of availability of phosphorus and molybdenum when applied to the soil. Wastewater containing high concentration of Fe can increase soil acidity and diminish phosphorous in soil (Abagale et al., 2013).
Concentration of Lead (Pb) in wastewater samples
Lead has been used widely for application in metal products, cables and pipelines, as well as paints and pesticides. Lead is one of the metals that have the most damaging effects on human health (Bainies, 1999). It is a non-essential heavy metal. Pb causes oxidative stress and contributes to the pathogenesis of lead poisoning by disrupting the delicate antioxidant balance of the mammalian cells. High level accumulation of Pb in body causes anemia, colic, headache, brain damage, and central nervous system disorder (Rehman et al., 2013). Concentrations of lead in the wastewater samples at N1, N2 and N3 were 3.11±0.04, 2.19±0.05 and 1.98±0.04 mg/L, respectively. The lead value were of to be higher than recommended limit of Pb for irrigation water set by WHO (2006) and USEPA (2010) (Table 5). This makes the water unsuitable for human consumption as Pb is known to be toxic even at low levels with resultant ill-health effects as chronic exposure has been linked to growth retardation in children (Muiruri, 2009). Significant difference was evident from all the sampling point, with sampling point at the point of discharge recording the highest Pb mean value of 3.11±0.04 mg/L which can be attributed due to the untreated industrial effluent. A generally decrease in the mean concentration of Pb from point of discharge to 500 m away from point of discharge may be due to settlement effect.
Concentration of Copper (Cu) in the wastewater samples
As shown in Table 5, the concentrations of Cu in wastewater samples were found in the range of 0.3±0.00-0.99±0.06 mg/L. These values were found to be higher than recommended limit of Cu for irrigation water set by WHO (2006) and lower than the recommended level set by USEPA (2010) (Table 4). This could be attributed to the reason of anthropogenic activities and industrial effluent released without treatment. In general, the concentration of copper was above the permissible level in three the wastewater samples of EIZ effluent. Significant difference was evident from all the sampling points. Generally, a decrease in the mean concentration of Cu from the point of discharge to 500 meter away from point of discharge could be due to settlement effect.
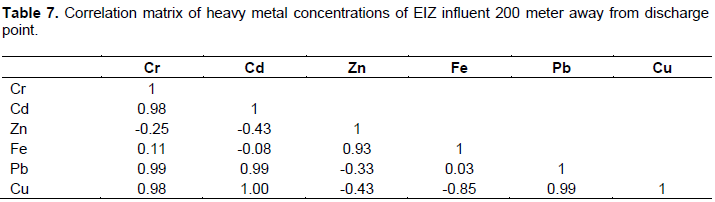
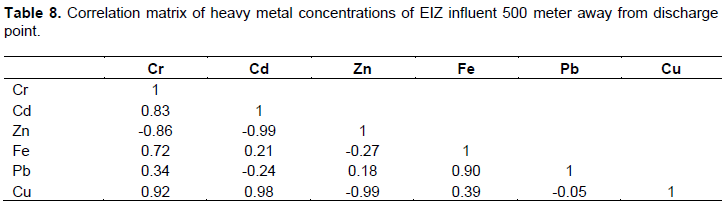
Pearson’s correlation between heavy metals
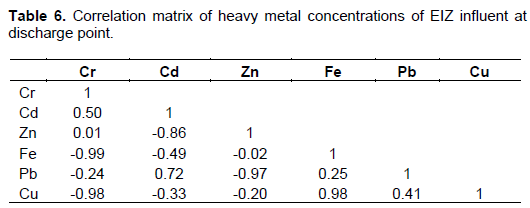
The relationships between contents of different elements in wastewater were analyzed by Pearson’s correlation coefficient. The correlation analysis is a bivariant method which is applied to describe the relation between two different metals. The high correlation coefficient (near +1 or −1) means a good relation between two variables, and its concentration around zero means no relationship between them at a significant level of 0.05% level, it is strongly correlated, if r > 0.7, whereas r values between 0.5 and 0.7 show moderate correlation between two different parameters (Sharma and Raju, 2013). The correlation between heavy metals in three different point (at point of discharge, 200m away from point of discharge and 500 m away from point of discharge were correlated in the Tables 6, 7 and 8 respectively.
CONCLUSION
The analysis of wastewater for heavy metal contamination is an important step in ensuring human and environmental health. Excess levels of heavy metals might cause several short term and long term health effects to the human beings. Wastewater was collected from EIZ effluent in the point of 0, 200 and 500 m away from the discharge point. The wastewater samples were obtained and subjected to acid mixture digestion (3 ml HNO3+ 3 ml H2O2) and the concentration of metals were determined via FAAS. Overall concentrations of Cr, Cd, Zn, Fe Pb, and Cu in the wastewater samples in acid mixture digestion method ranged from 0.20-1.04, 0.04-0.08, 0.07-0.21, 5.13-2.89, 1.98-3.11and 0.30-0.99 mg/kg, respectively. The concentration of heavy metals in the wastewater samples display the following decreasing trend: Fe > Pb > Cr > Cu > Zn > Cd, these concentrations are above the recommended level set by WHO (2006) for irrigation water.
CONFLICT OF INTERESTS
The author has not declared any conflict of interests.
REFERENCES
|
Abagale FK, Sarpong DA, Ojediran JO, Osei-Agyemang R, Shaibu AG, Birteeb PT (2013). Heavy metal concentration in wastewater from car washing bays used for agriculture in the Tamale Metropolis, Ghana. International Journal of Current Research 5(06):1571-1576. |
|
|
Akhionbare S, Ebe T, Akhionbare W, Chukwuocha N (2010). Heavy metal uptake by corn (Zea mays L.) grown in contaminated soil. Research Journal of Biological Sciences 6:993-997. |
|
|
American Public Health Association (APHA) (1999). American water works association, Water environment federation. Standard methods of the examination of water and wastewater, 20thed. New York: American Public Health Association, APHA, AWWA, and WPCF. |
|
|
Ayers RS, Westcot DW (1985). Water quality for agriculture. FAO Irrigation and Drainage Paper 29 (Rev. 1), FAO, Rome. |
|
|
Bahiru BD, and Teju E (2019) Levels of some selected metals (Fe, Cu and Zn) in selected vegetables and soil around eastern industry zone, central Ethiopia. African Journal of Agricultural Research Journal of Natural Sciences 4(2):78-91. |
|
|
Bahiru BD, Teju E, Kebede T, Demissie N (2019). Levels of some toxic heavy metals (Cr, Cd and Pb) in selected vegetables and soil around eastern industry zone, central. African Journal of Agricultural Research Journal of Natural Sciences 14(2):92-101. |
|
|
Bainies J (1999). Dietary exposure assessments lead. Australia and New Zealand national assessments pp. 120-122. |
|
|
Birtukan A, Gebregziabher B (2014). Determination the level of some heavy metals (Mn and Cu) in drinking water using wet digestion method of Adigrat Town. International Journal of Technology Enhancements and Emerging Engineering Research 2(10):32-36. |
|
|
Chandra R, Bhargava RN, Yadav S, Mohan D (2009). Accumulation and distribution of toxic metals in wheat (Triticum aestivum L.) and Indian mustard (Brassica campestris L.) irrigated with distillery and tannery effluents. Journal of Hazardous Materials 162(2-3):1514-1521. |
|
|
Chishti KA, Khan FA, Hassan SSM (2011). Estimation of heavy metals in the seeds of blue and white capitalism's of silybum marianum grown in various districts of Pakistan. Journal of Basic and Applied Science 7(1):45-49. |
|
|
David, AA, Terry P (2008). Limit of blank, limit of detection and limit of quantitation. Clinical Biochemist Review 29:49-52. |
|
|
Deribachew B, Made M, Nigussie D, Taddesse AM (2015). Selected heavy metals in some vegetables produced through wastewater irrigation and their toxicological implications in Eastern Ethiopia. African Journal of Food, Nutritional and Development 15(3):10013-10032. |
|
|
Duan T, Kang J, Chen H, Zeng X (2003). Determination of ultra-trace concentration of elements in high purity tellurium by inductively coupled plasma spectrometry after iron (III) hydroxide co precipitation. Journal of Spectrochemical act part B 58:1679-1685. |
|
|
Food and Agriculture Organization (FAO) (1985). Water Quality for Agriculture. Irrigation and drainage paper No. 29, Rev. 1. Food and agriculture organization of the United Nations, Rome. |
|
|
Fuortes L, Schenck D (2000). Marked elevation of urinary zinc levels and pleural friction rub in metal fume fever. Veterinary and Human Toxicology 42(3):164-165. |
|
|
Gebregeorgis AK (2016). Ethio-China economic relations: nature of China's foreign direct investment in Ethiopia. MSc thesis, Addis Ababa University, Addis Ababa, Ethiopia. |
|
|
Hati KM, Biswas AK, Bandyopadhyay KK Misra AK (2007). Soil properties and crop yields on a vertisol in India with application of distillery effluent. Soil and Tillage Research 92(1-2):60-68. |
|
|
Helen LE, Othman OC (2014). Levels of selected heavy metals in soil, tomatoes and selected vegetables from Lushoto district-Tanzania. International Journal of Environmental Monitoring and Analysis 2(6):313-319. |
|
|
Hunt JR (2003). Bioavailability of iron, zinc, and other trace minerals from vegetarian diets. American Journal of Clinical Nutrition 78(3):6335-6395. |
|
|
Kedir H (2015). Chemical fractionation of some trace heavy metals (Cd, Cr, Cu and Pb) in some selected farm lands of Haramaya Woreda, Ethiopia. MSc. Graduate project, Haramaya University, Haramaya, Ethiopia. |
|
|
Khaled A, Ola-Abdelwahab O, El-Sikaily A, El-Nemr A (2008). Treatment of wastewater containing toxic chromium using new activated carbon developed from date palm seed. Journal of Hazardous Materials 152:263-275. |
|
|
Muiruri MJ (2009). Determination of concentration of selected heavy metals in Tilapia fish, sediments and water from Mbagathi and Ruiru Athi river tributaries, Kenya. MSc thesis, Kenyatta University, Kenya. |
|
|
Ogunleye IO, Izuagie AA (2013). Determination of heavy metal contents in some industrial effluents from Ondo State, Nigeria, Journal of Environmental Chemistry and Ecotoxicology 5(8):216-219. |
|
|
Rath P, Pradhan G, Misra MK (2011). Effect of distillery spent wash (DSW) and fertilizer on growth and chlorophyll content of sugarcane (Saccharum officinarum L) plant. Recent Research in Science and Technology 3(4):169-176. |
|
|
Rehman A, Ullah H, Khan RU, Ahmad I (2013). Population based study of heavy metals in medicinal plant Capparis decidua. International Journal of Pharmacy and Pharmaceutical Sciences, 5(1):108-113. |
|
|
Sharma P, Dubey RS (2007). Involvement of oxidative stress and role of antioxidative defense systemin growing rice seedlings exposed to toxic concentrations of aluminum. Plant Cell Reports 26(11):2027-2038. |
|
|
Singh O, Kumar V, Raj SP (2005). Water quality aspects of some wells, rivers and springs in part of the Udhempur District (UK). Journal of Environmental and Engineering 47:25-32. |
|
|
Tessema BT, Adane KY, Subodh K (2015). The physico-chemical studies of wastewater in Hawassa Textile Industry. Environmental Analytical Chemistry 2(4):1-6. |
|
|
Tyagi R (2014). Assessment of the uptake of toxic heavy metals on cultivation of vegetables of family Solanaceae in contaminated soil. PhD Graduate Thesis University of Kota, Kota, Rajasthan. |
|
|
United State Environmental Protection Agency (USEPA) (2010). Risk-based concentration table. United State Environmental Protection Agency, Washington, DC, USA. |
|
|
World Health Organization (WHO) (2002). Water pollutants: Biological Agency Dissolved Chemicals, Nondissolved Chemicals, Sediments, Heat, WHOCEHA, Amman, Jordan. |
|
|
World Health Organization (WHO) (2006). WHO Guidelines for the Safe use of wastewater, excreta and greywater. Vol. I: Policy and Regulatory Aspects. Vol. II: Wastewater Use in Agriculture. Vol. III: wastewater and excreta use in aquaculture. Vol. IV: excreta and Greywater use in agriculture. Geneva: World Health. |
|
|
Waste Water Forum (WWF) (2007). Report on National Surface Water Classification Criteria, Irrigation water Quality Guidelines for Pakistan. February. Waste Water Forum Pakistan. |
|
|
Yoon Y, Cao X, Zhou Q, Ma LQ (2006). Accumulation of Pb, Cu and Zn in native plants growing on a contaminated Florida site. Science of the Total Environment 368:456-464. |
|
Copyright © 2024 Author(s) retain the copyright of this article.
This article is published under the terms of the Creative Commons Attribution License 4.0


