Full Length Research Paper

ABSTRACT
Technology transition is an essential activity of engineering that bridges the gap between theory and reality. Computer engineering, for instance, takes the infinite accuracy of pure mathematics and applies it to practical situations. For precision irrigation and the calculation of ETc (estimated crop water use), we have the physics and mathematics expressed in the UN’s excellent documentation. A previous paper by the author expressed those mathematics in open-source software. The results were tested against the UN’s documentation and applied to Teff, a crop grown in Ethiopia. Since weather data had to be constructed from what was available, this present paper focuses on sweet corn grown in the USA, while using unmodified weather data downloaded from a regional weather station. It also goes into detail on determining various parameters required for calculation. An additional stop was to use next-day rain prediction in an effort to further minimize water use. Next-day rain prediction resulted in a 20% decline in water use while the crop would never go more than 24 h without an appropriate amount of water being applied. The result also demonstrates the integration of software components with a small cigarette-pack sized computer suitable for embedding within irrigation systems. Finally, ETc is translated into a volume of irrigation to be applied on a daily basis, taking into account moisture already available, ETc, and rain falling during the previous 24 h. Growing-season volume appears large at first glance but correlates with other consumption studies.
Key words: Precision irrigation, precision agriculture, distributed systems, water conservation, soil moisture, evapotranspiration, adaptive automation, embedded systems
INTRODUCTION
An earlier paper by Raeth (2020a), reported on the development and testing of open-source software for calculating evapotranspiration (ETo) and crop water requirement (ETc for a single crop under standard conditions. That paper implemented the mathematics representing the theory behind a crop’s water use (Allen et al., 1998). The testing here was done using examples in the source document and also parameters for Teff, a crop much-grown in Ethiopia, where this research started. However, there was an issue with the last experiment pertaining to the weather data. Insufficient data was available, so a set had to be created from what was available. Still, the software was shown to produce correct results.
In this present paper, the author focuses on sweet corn grown in Idaho, USA. Weather data was downloaded from a regional weather station and used unmodified (NOAA, 2020a). This paper also gives a detailed calculation of various parameters as the crop grows, which is essential since Allen et al. (1998) is not always clear on that matter.
A final component briefly explores the impact of next-day rain prediction on the volume of water used for irrigation. The result showed that 20% less water was used, while the crop would never go more than 24 h without adequate irrigation.
All software for this and the previous paper are available as open-source (Raeth, 2020b). The software is well-commented and documented. It is written in a language often employed within embedded systems (C/C++).
It is important that this technology-transition step be taken. In theory, by itself, it cannot be directly applied to practical situations. For instance, mathematics that describes theory takes place within a sphere of infinite accuracy (For Example: 1/3 = 0.333….., not 0.33333). Engineering takes into account the inaccuracy of mathematical calculations in practice. It also considers imperfect devices and the realities of physical implementation, including the total cost of purchase, installation, operation, and maintenance.
Levidow et al. (2014) discussed irrigation technology development and transition in quite a detailed manner, acknowledging the need and taking into cognizance the decreasing supplies of water available for crop use. On an important issue, besides developing associated equipment and methods, they cite the need for farmer education and their adoption of improvements. Tolbert et al. (2016) found that irrigation methods based on evapotranspiration and others based on soil-moisture sensing provided essentially equal results. Both were statistically beneficial when compared with conventional volume/schedule watering. A great deal of additional benefit was derived from careful training of farmers.
This quote from a US congressional hearing shows that this present effort is on the right track (United States Senate, 2017):
The collection and analysis of data has enabled farmers to reduce costs through more efficient applications of inputs like fertilizers and pesticides; improve production decisions through enhanced recordkeeping and more accurate yield predictions; and enhance land stewardship and sustainable practices by removing inefficiencies in planting, harvesting, water use, and the allocation of other resources. With an increasing volume of quality data, in tandem with improved data analysis, data-collection technology has the potential to dramatically increase farm productivity and profitability.
Despite being valuable, in comparison with commercial efforts, they are proprietary. There is relatively little in the way of open-source expressions of the underlying theory. This present effort seeks to make open-source software and hardware available. This paper speaks of software and a bit of hardware (The BeagleBone is open-hardware), hence it can be said to produce open-source software.
According to Bhalage et al. (2015), this present project addresses an important issue in agriculture, believed that an estimated 80% of the world’s usable water is applied to agriculture, and that in some countries, irrigation efficiency is as low as 30%. They also note deficiencies due to over irrigation occasioned by non-availability of control structures and facilities for volumetric supply of irrigation water, as well as lack of awareness among farmers about correct irrigation practices.
Rhodig and Hillyer (2013) call for a flexible approach combining optimal irrigation techniques with soil, moisture, and weather data in an integrated, easy-to-use decision support solution. They also speak to the need for high-quality data as a fundamental driver of precision techniques.
As we delve further into this paper’s discussion, the software architecture will be discussed and the determination of major configuration variables will be illustrated. The possible outcome when the system was applied to an actual situation is also presented (by “applied”, the author means without connection to an irrigation system. Real weather data was used, connection was made to embeddable computer hardware, and a volume of irrigation displayed). Finally, the study findings were discussed and future opportunities presented.
MATERIALS AND METHODS
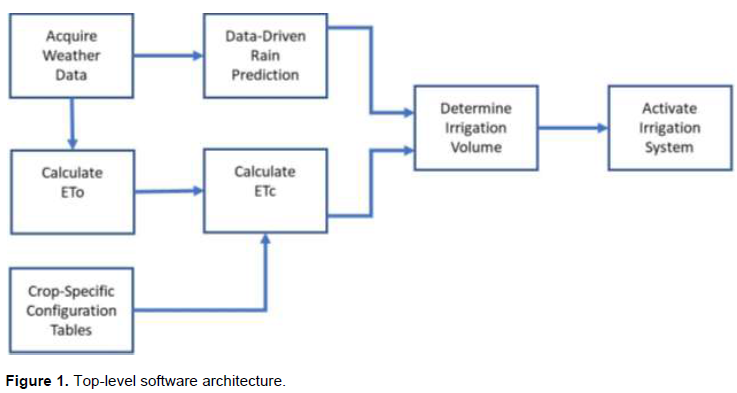
Beginning with a detailed study of Allen et al. (1998), modular software was written in C/C++ to implement the underlying mathematics. Modularity and broad usability make up the foundation of the system. Figure 1 illustrates the top-level components. Each component will be subsequently summarized.
Acquire weather data
Archived pre-cleaned weather data was downloaded from a public website operated by the US National Oceanic and Atmospheric Administration (NOAA, 2020a). Documentation on station codes is contained in NOAA (2018). Documentation on the data itself is contained in NOAA (2020b). Wigmore (2019) offers a good discussion on the use of this data.
The author chose a station in the USA, Idaho Falls Regional Airport as sweet corn is a primary crop in that region of the world and high-quality data from that station is available. There are configuration variables available in Allen et al. (1998) for that crop in that region. Data for the 2019 growing season was extracted from that year’s data and formed the dataset driving ETo calculations.
Calculate ETo
The physics and mathematics behind evapotranspiration are well-explained by Allen et al. (1998). This project developed an implementation of their work for a single crop under standard conditions (as explained in Part B of their work). Implementation was discussed in the previous paper, Raeth (2020a). Careful testing against provided examples was used to check for correctness. A test against CropWat suggests that the study used a tool that records incoming solar radiation instead of the specified net solar radiation. So, CropWat’s ETo will always be 3-4% higher. The author was unable to get the popular ETo calculator to accept greater than three-digit altitude values, so results could not be checked against that tool (Also, there was no response to the author’s email on this matter). Although the executables for those tools are public-access, the author could not find source-code. Thus, further verification using those tools was not possible.
Crop-specific configuration tables
Given the modular nature of the software, the system readily adapts to changes in configuration values. Thus, values appropriate to the location and crop are selected and detailed notes are included with the software.
Altitude, latitude, and longitude are given in the station documentation (NOAA, 2018 November). For this particular exercise, we focused on Idaho Falls Regional Airport in the USA.
Kc was developed for sweet corn grown in Idaho. Figure 2 is drawn from Allen et al. (1998). The plot is due to linear interpolation over the table during the growth period.

Crop height is illustrated in Figure 3 (Allen et al., 1998, Table 11 only gives the ending height at harvest (1.5 m)). Due to this, it was necessary to draw intermediate heights from another source; hence the author chose Tajul et al. (2013, Figure 1). A process of relative percentages yielded intermediate plant heights.

Sunlight data was sourced from WeatherAtlas (2020). It is essential to differentiate between sunlight and daylight. Many sources confuse the two and report one as the other. Periods of sunlight yield the energy needed to calculate net incoming solar radiation. Also, daylight is a longer period of visibility but is not the same as sunlight. Figure 4 illustrates the values used in this exercise.

Data-driven rain prediction
C5.0, RuleQuest (2019), is a well-respected open-source data analysis tool which uses well-grounded formal statistics to produce classification models. For this exercise, C5.0 was used to create a model that generates next-day-rain (yes or no) classifications of daily weather data.
A record for building the model was created by combining three contiguous daily records. Each element in the second record was subtracted from the corresponding element in the first record. If all elements were good numbers, the third record provided a yes/no on next-day precipitation. The resulting record was added to those used to build the model. If any element in the resulting record was not a good number, that record was not added to those used to build the model.
The elements employed are listed in Table 1. (“Diff” refers to the difference between a corresponding element in the current record and the previous day’s record.)
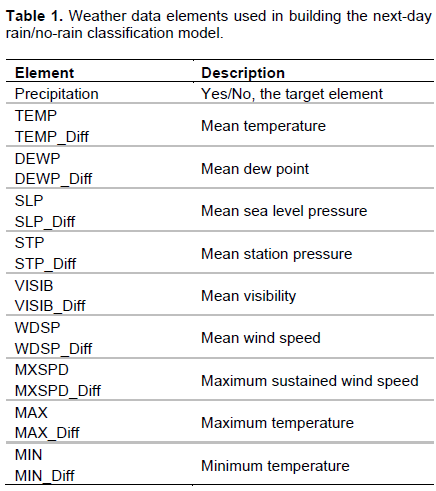
For testing the model, data for the crop growing period (planting to harvest) during 1998-2018 was gathered. Test data was drawn from 2019 and was arranged in exactly the same way as the data used to build the model. At this point, C5.0 was employed to build and test the model. When used within the total system, C5.0 employs an evolving model as new data arrives. This is accomplished via system calls.
Calculate ETc
This is a rather simple matter. Linear interpolation is used to calculate a Kc value from the table inset in Figure 2 based on the number of days after planting. That result is then multiplied by ETo to get ETc.
Determine irrigation volume
ETc is the amount of water used by the crop during the previous 24 h. Notice that ETc is reported in the same basic units as precipitation.
Four values are used to estimate the irrigation requirement: ETc (the crop’s water use), present-day rain, next-day rain prediction, and moisture already in the ground. How to initialize moisture already in the ground is an issue since that is a configuration variable. Initialization can be estimated using an inexpensive portable soil-moisture sensor.
Soil-moisture sensing can be rather involved or rather simple. It can also be rather expensive or rather inexpensive. Sharma (2019) offers a good discussion. For the purposes of estimating soil-moisture content at the very beginning of planting, it should not be necessary to use complex and expensive equipment; something simple and inexpensive should suffice. However, be sure the product you employ has instructions for interpreting the readout in terms of the crop at hand. In the case of this exercise, the author assumed zero moisture in the ground to start. The software readily adapts to whatever value is used for initial in-ground moisture.
When it rains on a particular day, that amount of water is added to in-ground moisture before ETc is subtracted. If the total amount of water (present-day-rain + in-ground-moisture – ETc) is less than ETc, then water is added if no-rain is predicted for the next day. The amount of water added is sufficient to bring the in-ground moisture to the level of present-day ETc on the assumption that next-day ETc will be close to that amount. This is a reasonable assumption since weather conditions rarely change greatly from day to day. Figure 5 shows the general logic for this process.
The calculation to estimate additional irrigation volume takes into consideration that ETc is in the same basic units as is the amount of rain measured for a particular day. It is therefore possible to estimate the volume of water needed for irrigation. The formula for volume is length × width × height. The area covered by the crop comprises the length x width component. Our units of ETc and rain are in millimeters (mm) per day. We can take mm water loss as the height. Thus, volume of water needed each day to maintain ETc over the field can be estimated.

For example: Consider a field covering one hectare
1 ha = 10,000 m2
1 m2 = 1,000,000 mm2
Thus, if ETc = 5 mm,
Volume of water needed = 10,000 × 1,000,000 × 5 = 50,000,000,000 mm3
But,
1 mm3 = 0.000001 L
Thus, the requirement for water for that day is 50,000,000,000 × 0.000001 = 50,000 L.
1 L = 0.26417205 gallons.
Thus,
Required water in US terms = 50,000 × 0.26417205 = 13208.6025 gallons.
If one takes that as the average volume of irrigation per day, it is possible to decide if that amount of water is available so that a viable crop can be grown.
Activate irrigation system
The size of the irrigated field leads to the volume of water required to satisfy ETc. The volume per period of time delivered by the pumping system determines the length of time to operate the pump. In our case, a signal was sent from the computer operating the software to a BeagleBone-Black Industrial single-board embeddable computer (beagleboard.org, 2020 July, 22). This popular open-hardware computer is quite small, about the size of a cigarette pack.
The BeagleBone-Black is pictured in Figure 6. Circled are LEDs that are turned on to represent the length of time required to deliver a specific volume of water. Power for the board and communication with the board was provided through a USB cable. The computer sends a signal to the embeddable computer and the software in the computer triggers the LED. Details are given in Raeth (2020b). Modules for battery power and wireless communication are available for this board, as are means of interfacing with other hardware.

For this transition phase, the author did not have access to an irrigation system. In truth, an embeddable computer is not needed for this present exercise. One could simply display the volume of water required. However, this procedure was followed to briefly explore standard networking modules for such a connection. This proved easy to do as a means of representing a networked pump controller. If the drip irrigation system is assumed to distribute water evenly across the field, then the field can be said to be adequately watered.
RESULTS AND DISCUSSION
The process described in this paper, the calculation and application of ETo and ETc, and their translation to daily volume for drip-irrigation is data driven. Like all data-driven processes, the first requirement is good data: data that is accurate, reliable, and complete. It makes little sense to establish a data-gathering process, in this case a weather station, unless good data is collected, made accessible, and archived. Similar thoughts apply to methods of data analysis and their implementation. Analysis of mathematics must be appropriate to the goal. Implementation must correctly reflect the mathematics. The author hopes this project is an encouragement toward producing good weather data coupled with correct analysis tools [This project’s source-code is available in Raeth (2020b) for public testing, verification, and expansion].
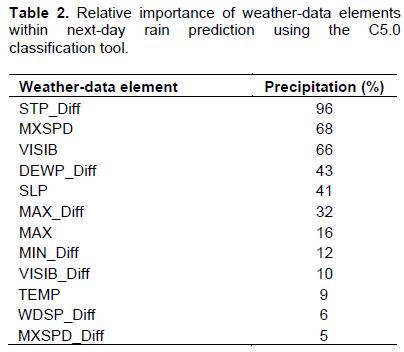
The method used here for next-day rain prediction evolves as new data becomes available. The oldest record is deleted and the newest record is added as new data arrives. All data from ten years was used to initialize the model. Data from the eleventh year was used to test the model. In the training set, there were 3197 instances of next-day precipitation and 4468 instances when precipitation did not occur the next day, for a total of 7665 test records. C5.0 arrived at the importance of data elements shown in Table 2. The percentages are an indication of importance.
Test results are shown in Table 3. Clearly, classifications for next-day rain were no better than flipping a coin. But, classifying the case of no next-day rain were fairly accurate.

There are many approaches to data-driven rain prediction. An example is given by Namitha et al. (2015). Hirani and Mishra (2016) produced an excellent survey of techniques. As regards various techniques, it should be noted that some do not have known construction times. Others do not have construction architectures and initializations that can be determined ahead of time. C5.0 uses a technique where construction time is directly related to the amount of data employed. It determines the architecture and initialization via bounded statistical analysis.
Applying next-day rain prediction within the described irrigation estimation process had a positive impact. Over the 100-day growing period, 278 mm water total was estimated for irrigation use when next-day rain prediction was not employed. When employed, 223 mm water-use was estimated.
Taking into consideration the volume of water represented by 223 mm; during that same growing season, 122 mm rain was measured. Thus, the total water applied was 345 mm. Assuming we are working with one hectare of plantable area and that rain and irrigation are evenly applied, Brouwer et al. (1985) explained how to convert millimeters of water to a volume:
1 ha = 10,000 m2
345 mm = 0.345 m
10,000 × 0.345 = 3,450,000 m3
1 m3 = 1,000 L
4,000.3 × 1,000 = 3,450,000,000 L
That is the volume of water used in this exercise for a crop of corn. In US terms,
1 L = 0.2641720524 gallons
3,450,000,000 × 0.2641720524 = 911,393,581 gallons of water consumed in growing 1 ha of corn.
That does appear to be a great deal of water. However, Trout et al. (2011) has determined that it takes 600,000 gallons of water to grow one acre of corn. One hectare is equivalent to 2.471 acres. Thus, our one hectare would need 2.471 x 600,000 = 1,482,600 gallons of water. Thus, for the specified corn crop, the exercise falls within the broad range.
It must be taken into account that “corn” is a very general term. Hence, there are many varieties of corn and some are drought-resistant. Also, location and ambient conditions during the growing season are important factors. The variety of corn used in this exercise is of no specific variety but is an average of several varieties. Trout et al. (2011) conducted their research in an entirely different part of the country than assumed by this exercise, plus they did not specify the variety of corn they used. Another factor is the length of the growing season. The author used a 100-day period. However, other varieties have longer growing periods. For example, the study by Tajul et al. (2013) used a 120-day growing period. So, the author is willing to accept the volume produced in this exercise.
CONCLUSION
This exercise demonstrates and publishes modular software that calculates single-crop ETc under standard conditions. it is flexible with the selected crop, location, and weather conditions.
Rain prediction proved helpful, resulting in an estimated 20% water savings. At no time was irrigation delayed more than 24 h. Estimated water volume correlates with other studies.
It is not clear if the estimation of a crop’s water use leads to water savings when compared to scheduled irrigation. That would very much depend on how much water the schedule provides as a farmer-selected volume. Savings may be expected if the schedule tends to over-water the crop. Still, the use of ETc estimations can help prevent over and under-watering and therefore, potentially aid in an effort to produce the best crop yield.
Cost is another factor to consider. Providing accurate, reliable, and accessible weather data for ETc calculations is not cheap. Some nations do have such capability. But, even in that case, the further one gets from the weather station, the less applicable are the observations to a specific farm. Cost is a factor as well with soil-moisture sensors. In both cases, a reliable but relatively inexpensive computer is needed, even if automated irrigation is not employed. One must determine where the cost-tradeoffs occur. For example, is regaining yield-loss worth the added expense of precision irrigation? At what planting area does the volume of crop make the added expense worthwhile? What are the purchase, installation, and recurring costs of an irrigation system? The mere saving of water or the improvement of crop yield may not, in and of themselves, be worth the cost and effort.
FUTURE OPPORTUNITIES
It is possible that an improved rain-prediction method may enable even less irrigation volume. In particular, a method could be researched that predicts accurately whether or not rain will occur (instead of just when rain will not occur). And also, if rain is predicted to occur, an accurate prediction of how much rain may fall would be very useful. National weather forecasts may not be sufficiently accurate nor even possible, depending on the reliability, accuracy, and completeness of the data\collected. So, a farmer-owned or cooperative-owned weather station may be necessary.
If the work of Tiwari et al. (2019) is examined, it can be realized that there could be considerable advantage to the combination of weather and soil-moisture data. Although there may be scalability of networked data gathering, communicating, processing, results delivery, and archival issues. In the author’s experience, this should be possible using respected open-source software. Multiple tools would be involved but the system would be capable of integrating loosely-coupled geographically-dispersed processes that are language agnostic. This would be more easily done with Linux systems, but it is possible that Windows systems could be included.
It would be possible to push into greater detail with the present project. For instance, including the calculations for non-standard conditions would take the project deeper into the existing proof-of-concept.
A table of results could be generated by calibrating the software for additional crops grown in different parts of the world. This may be valuable in circumstances where technology insertion is being explored.
Given the number of parameters needed to calibrate the software, a data-entry GUI is an obvious need, especially if real-time user-selectable crop phase were to be entered during system operation. That would be an excellent transition step to take if the software were to be employed during a field study.
CONFLICT OF INTERESTS
The author has not declared any conflict of interests.
REFERENCES
|
Allen RG, Pereira LS, Raes D, Smith M (1998). FAO irrigation and drainage paper # 56 - crop evapotranspiration. Food And Agriculture Organization of The United Nations, |
|
|
beagleboard.org (2020). BeagleBone black industrial - overview. Introductory material and links to considerable detail, |
|
|
Bhalage P, Jadia BB, Sangale ST (2015). Case studies of innovative irrigation management techniques. Proc: International Conference On Water Resources, Coastal and Ocean Engineering, Aquatic Procedia 4:1197-1202. |
|
|
Brouwer C, Goffeau A, Heibloem M (1985) Irrigation water management: training manual no. 1 - introduction to irrigation. Food And Agriculture Organization of The United Nations, |
|
|
Hirani D, Mishra N (2016) A survey on rain prediction techniques. International Journal of Computer Application 6(2):28-42. |
|
|
Levidow L, Zaccaria D, Maia R, Vivas E, Todorovic M, Scardigno A (2014). Improving water-efficient irrigation: Prospects and difficulties of innovative practices. Agricultural Water Management 146:84-94, |
|
|
Namitha KA, Jayapriya A, Kumar G (2015) Rainfall prediction using artificial neural network on map-reduce framework. Proc: Third International Symposium on Women in Computing and Informatics. |
|
|
NOAA (2018). Integrated surface database station history. Explanation of weather station codenames. |
|
|
NOAA (2020a). Global surface summary of the day. International data source provided for public access by the US Department of Commerce - National Oceanic and Atmospheric Administration, |
|
|
NOAA (2020b). GSOD data documentation. Explanation of weatherstation datasets, |
|
|
Raeth PG (2020a). Moving beyond manual software-supported precision irrigation to human-supervised adaptive automation. African Journal of Agricultural Research 16(11):1548-1553, |
|
|
Raeth PG (2020b). Embeddable software for irrigation control. software and documentation, |
|
|
Rhodig L, Hillyer C (2013). Energy and water savings from optimal irrigation management and precision application. Proceeding: ACEEE Summer Study on Energy Efficiency in Industry, |
|
|
RuleQuest Research (2019). "C5.0 Data Mining Tool" latest open-source version, |
|
|
Sharma V (2019). Soil moisture sensors for irrigation scheduling. University of Minnesota Extension, instructional material, |
|
|
Tajul MI, Alam MM, Hossain SMM, Naher K, Rafii MY, Latif MA (2013). Influence of plant population and nitrogen-fertilizer at various levels on growth and growth efficiency of maize. Scientific World Journal. |
|
|
Tiwari R, Patel Y, Saha G (2019). User controlled precision irrigation system. Proceeding: Innovations in Power and Advanced Computing Technologies. |
|
|
Tolbert JW, Tolley B, Thill T, Allen LM, Dukes MD, Breder EM, Monaghan PF, Morea MC, Wells W (2016). Smart Irrigation Controller Demonstration and Evaluation in Orange County Florida. Water Research Foundation, Report #4227, |
|
|
Trout T, Shaner D, Bausch W, Bernard T (2011). Growing crops and saving water in the west. Agriculture Research Magazine 59(7):12-14. |
|
|
United States Senate (2017). Technology in agriculture: Data-driven farming. Minutes: Hearing before the subcommittee on consumer protection, product safety, insurance, and data security of the committee on commerce, science, and transportation, |
|
|
WeatherAtlas (2020). Daylight hours / Sunshine hours - Idaho Falls ID USA. Reporting and visualization of weather data, |
|
|
Wigmore A (2019). How We Process the NOAA Integrated Surface Database Historical Weather Data. Visual Crossing Weather, Weather data processing documentation, |
|
Copyright © 2024 Author(s) retain the copyright of this article.
This article is published under the terms of the Creative Commons Attribution License 4.0


