ABSTRACT
This paper examines the relationship among capital flight, domestic investment and economic growth in the small resource based economy of Trinidad and Tobago. The study utilized capital flight estimates from previous work. A Vector Error Correction Model (VECM) combing short run and long run analysis is presented. The results confirm the a priori expectation that the financial haemorrhage of capital flight is a fundamental problem, which is affecting both the levels of domestic investment and economic growth. Therefore, a reduction of capital flight may provide a stimulus to the overall economy. These findings provide clear evidence of the harmful effects of capital outflows and provide support for the potential re-introduction of capital controls.
Key words: Capital flight, domestic investment, economic growth, Trinidad and Tobago.
Capital flight can be defined as ‘the transfer of assets abroad in order to reduce loss of principal, loss of return, or loss of control over one’s financial wealth due to government-sanctioned activities’ (Epstein, 2005). These undeclared, undocumented or illicit transfers can deprive capital scarce economies of critical financial resources. This is a challenge faced by many economies and several studies have examined the country specific costs of capital flight (Beja, 2011; Chakrabarty et al., 2006; Forgha, 2008; Henry, 1996; Ndikumana and Boyce, 2008; Vukenkeng and Mukete, 2016; Wahyudi and Maski, 2012). Capital flight has been identified as a threat to scarce financial resources, domestic resource allocation, tax revenue, monetary aggregates and macroeconomic objectives of a country.
Given this context, an empirical analysis is important since estimates of capital flight, adjusted for trade misinvoicing and inflation, show an approximate transfer of resources amounting to US$40.9 billion, or 9.1% of GDP from Trinidad and Tobago for the period of 1971 to 20111. Further, there was a substantial increase in capital flight in more recent years, peaking at US $5,564 million in 2008. This is despite the conventional wisdom of a decrease in such outflows post liberalisation. Both Bennett (1989) and Henry (1996) discussed the possibility of capital flight having adverse effects on this resource based developing economy, but neither went into any detailed empirical analysis. Furthermore, there has been no published work on this subject since. This study aims to fill this void by examining the relationship between capital flight and domestic investment and the level of GDP. It also contributes to the scarce literature on capital flight from the small economies of the Caribbean.
Impact of capital flight on investment and growth
Capital flight has been associated with reductions in domestic investment. For example, the Franc Zone experienced a reduction in domestic investment during 1970 to 2005 (Ndiaye, 2009). Umoru (2013) and Adesoye et al. (2012) also presented arguments to support the adverse impact of capital flight on domestic investment in Nigeria. Umoru’s (2013) results show that a 1% increase in capital flight induced a 1.83% decline in domestic investment for the period of 1980 to 2010. AfDB et al. (2012) also pinpoints that capital flight reduced investment by $3.6 billion per annum in Angola, and $10.7 billion per annum in Nigeria over the period of 2000 to 2008. Additionally, Fofack and Ndikumana (2010) indicated that capital flight from Africa during the period 2000 to 2004 reduced average domestic investment to GDP by 11.1%.
Capital flight is also linked to reductions in GDP. For example, the Philippines lost an average of US$432 million to US$864 million in output between 1970 and 1999, South Africa lost US$13 billion in 2000 (9.2% of GDP), China lost US$109 billion in 1999 (10.2% of GDP), Chile lost US$4.7 billion in 1998 (6.1% of GDP), and Indonesia lost US$14 billion in 1997 (6.7% of GDP). Additionally, Umoru (2013) estimates that a 1% increase in capital flight induced a 1.059% decline in GDP growth from 1980 to 2010. Whereas, Ajayi (2012) showed that 66.67% of the variation in GDP in Nigeria was associated with the components of the residual measure from 1970 to 2009. Iran’s growth rate has also been significantly impacted by the past levels of capital flight. Khodaei (2012) showed that lagged capital flight in Iran had a significant impact on economic growth. The estimates showed that a 1% increase in the ratio of capital flight to GDP in the previous year reduced economic growth by 0.9% from 1979 to 2010.
The negative association between capital flight and reduced domestic investment can occur through various channels. The removal of domestically available resources can directly alter the desire for investment by individuals and therefore lead to a fall in aggregate investment. Capital flight indirectly affects domestic investment, as decreases in domestically saved capital reduces bank resources and can inhibit their ability and willingness to provide credit to the private sector for domestic investment (Saheed and Ayodeji, 2012; Ndiaye, 2012). The lower levels of private sector credit can in turn reduce longer term investments generally enhanced by domestic forces rather than external sources (Adegbite and Adetiloye, 2013).
Capital flight also lowers the taxable income and government revenue (Forgha, 2008; Khodaei, 2012; Saheed and Ayodeji, 2012). Ndiaye (2009) also links this loss in public investment to declines in private investment. Capital flight can also indicate the possibility of future economic failures such as: increases in the level of external indebtedness, taxes and exchange rate instability. This expectation of economic failures can also make domestic investors to become more cautious (Collier et al., 2001; Nkurunziza, 2012; Ndiaye, 2009) Considering that an economic axiom of investment is a main component in the calculation of GDP, it is not implausible to conclude that its’ decline reduces GDP (Lesotlho, 2006; Dutta, 2011; Adegbite and Adetiloye, 2013) as it reduces the productive capacity for sustainable long term development (Ndiaye, 2009).
This reduction in the rate of growth occurs via the loss in resources, lower investment and reduction in productivity (Saheed and Ayodeji, 2012; Kapoor, 2009; Gusarova, 2009; Forgha, 2008; Ndiaye, 2009; Chakrabarty et al., 2006). Capital flight also undermines sustainable development by increasing the dependence on external resources such as aid that are needed to replace the gap left by the fleeing of domestic capital (Kapoor, 2009, p.3). In particular, the inability of domestic firms to repay foreign debts may force them to lay off workers, causing unemployment and a further decrease in real output. Growth is also reduced as the capital to labour ratio is reduced. Gusarova (2009) and Collier et al. (2001) showed that as the capital to labour ratio declines so does the productivity of capital and the levels of output. Chakrabarty et al. (2006) also supported this finding and added that the additional effects of capital flight such as redistributive taxation and human capital investments also affect long term growth. The AFDB (2012) report stated, ‘If flight capital was saved and invested in the domestic economy of the country of origin, it would increase income per capita and help to reduce poverty’.
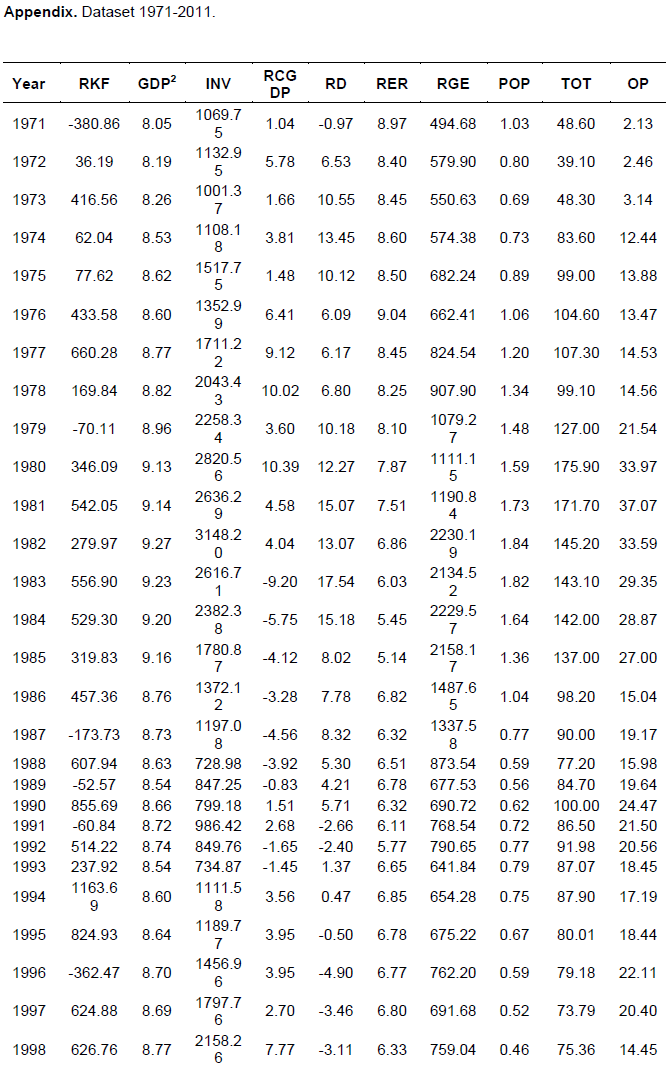
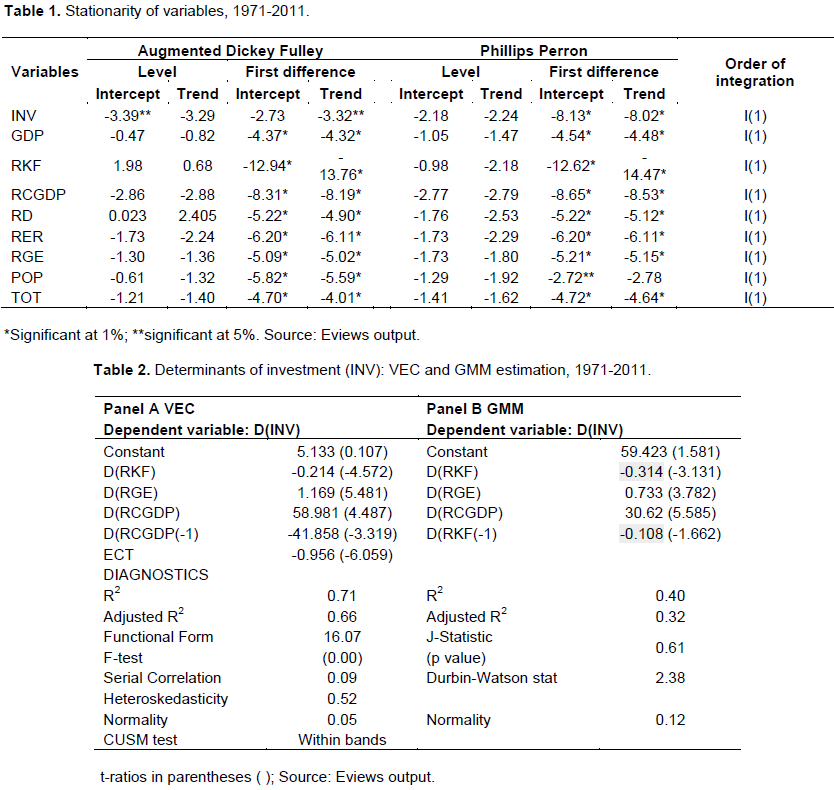
Data Capital flight estimates for Trinidad and Tobago were previously calculated using the Residual or Broad Estimate of capital flight adjusted for Trade Misinvoicing and inflation for the period, 1971-2011. This commonly used measure is supported by several economists including Ajilore (2010), Cerra et al. (2005), Henry (1996), Schneider (2000) and Vukenkeng and Mukete (2016) and calculated as shown by the equations below:
KF = KF* + MIS (1)
KF = [Δ ED + NFDI – CAD – ΔFR] + [Export Misinvoicing + Import Misinvoicing] (2)
RKF = KF/PPI (3)
where KF is estimated capital flight adjusted for trade misinvoicing, KF* is the Residual or Broad Estimate of capital flight, RKF is the estimate of capital flight adjusted for inflation using the United States producer price index (PPI) for 2000 as the deflator, Δ denotes change, ED is stock of gross external debt reported by the World Bank, NFDI is the net foreign investment, CAD is the current account deficit and FR is the stock of official foreign reserves.
The data for the dependent variables; domestic investment (INV) and gross domestic product (GDP) were sourced from the Central Statistical Office of Trinidad and Tobago. Domestic investment was measured by gross capital formation and output measured by GDP. Both variables were adjusted for inflation using the United States producer price index (PPI) for 2000. Significant micro, macro and financial variables were also sourced from the CSO and the Central Bank were utilised as control variables for the functional form. The vector of control variables utilised for the parsimonious domestic investment model was real government expenditure (RGE), the growth rate of GDP (RCGDP) and interest rate differential (RD). The a priori expectations ceteris paribus were as follows:
1. RGE was measured by the final expenditure of the Trinidad and Tobago government in US $Million using data from the World Bank, and is adjusted for inflation using the United States producer price index (PPI) for 2000 as the deflator. It can positively (government infrastructure investment or development spending can support domestic investment) or negatively (can increase interest rates and crowd out private investment) affect domestic investment.
2. CGDP, which is proxied by percentage changes in the real GDP using data from the World Bank, is used to account for the effects of macroeconomic stability and growth on investment. Thus, higher growth rates are signal higher estimated returns and to generate higher levels of domestic investment.
3. CGDP-1 represents lagged changes in the growth rate, and it is measured by lagged changes in CGDP. It acts as an indicator for the investment climate and its effect on current investment decisions. Thus, past increases in growth is expected to positively affect the current investment climate.
4. RD is measured by the gap between the domestic and foreign real rate where, RD = (US Tbill rate – US inflation rate) - (TT Tbill rate - TT inflation rate) using data from the IMF, the International Financial Statistics. It is used to account for the proposed negative effects of the cost of capital. Therefore, domestic investment is expected to fall as lower domestic rates provide greater incentive for foreign asset holdings.
On the other hand, the parsimonious GDP model comprised of domestic investment (INV), the terms of trade (TOT), population growth (POP) and the real exchange rate (RER) as control variables. The a priori expectations ceteris paribus are as follows:
1. INV is sourced from Central Statistical Office (CSO) in US $Million and is expected to have a positive impact on the level of GDP.
2. POP, which is proxied by percentage population growth sourced from the World Bank, is used to account for the positive effect of the development of human capital on GDP. However, Belford and Greenidge (2002) also showed that high population growth rates can negatively influence economic growth, since an expansion in the number of persons in the non-working age group exerts greater pressure on social services, resulting in limited availability of resources.
3. RER is measured as , where e represents the exchange rate between the Trinidad and Tobago dollar and the US, PPIUS represents the Producer Price Index for the US, and CPITT represents the Consumer Price Index for Trinidad and Tobago sourced from Central Bank. RER accounts for the uncertainty created by exchange rate overvaluation, which can make the domestic environment unattractive for investment and reduce the level of GDP.
4. TOT is sourced from the World Bank and is measured as the percentage of the country’s export prices in relation to its import prices, and controls for the positive effects of international trade on the level of GDP.
Model specification and regression analysis
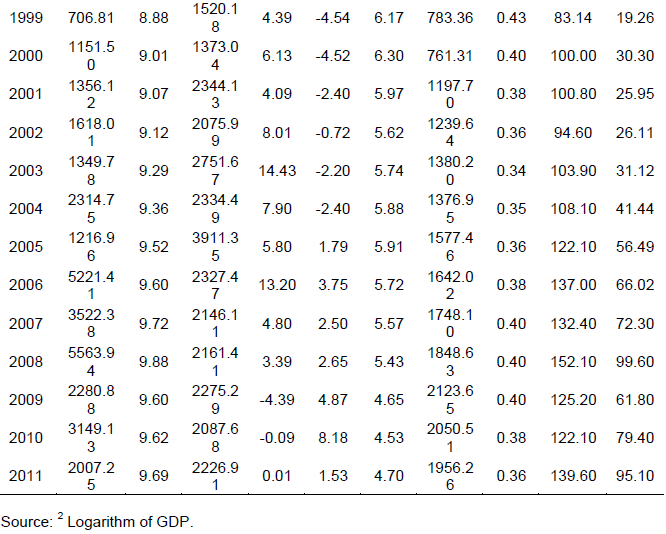
To ensure the regression analysis did not produce spurious results, the independent and dependent variables were tested for stationarity and the order of integration I(d) using the Augmented Dickey Fuller and Phillips Perron tests. In response to the loss of long run information due to regression analysis with first differenced variables and misspecification due to its omission, the non-stationary time series were tested for the possibility of cointegration among the variables. The presence of a cointegrating vector of variables allowed for an OLS regression to be performed keeping the long run and short run aspect via a Vector Error Correction (VEC) model (Enders, 1995).
The long run cointegrating relationship among the non-stationary variables (the linear combination of the I(1) variables which create a stationary I(0) process) was identified using the Johansen-Julius Cointegration test. This test was performed using the appropriate predetermined lag length by the Schwarz Bayesian Criterion (SC). Additionally, the cointegrating rank r and the number of cointegrating equations were determined by the Max Eigenvalue statistic. Thus, with an established long run cointegrating relationship or cointegrating vector, Equation 4 was used to estimate the impact of capital flight on domestic investment (INV) and the impact of capital flight on real GDP (GDP) in the long run (lagged variables at level) and in the short run (first difference).

Where, DEP represents INV or GDP, α0 represents the constant, αi represents the coefficients of each determinant, RKF represents real capital flight, X represents the vector of a priori control variables, λ represents the coefficient of the ECT ( must be negative), ECT represents the error correction term or cointegrating vector ε represents the error term.
One possible weakness of the regression coefficients in the VEC model in Equation 4 is endogeneity bias resulting from unobserved heterogeneity, and the possibility of basic bi-causal relationships such as that between economic growth rate and investment. The models were then estimated using the Generalised Methods of Moments (GMM) estimation technique to correct for possible endogeneity bias, any functional measurement error (Umoru, 2013), and to test the robustness of the VEC model.
The GMM model specifications shown below by Equation 5, estimated the respective stationary dependent variables using stationary first differenced independent variables, including their lag as instruments.
Where, DEP represents INV or GDP, β0 represents the constant, β i represents the coefficients of each determinant, RKF represents capital flight, X represents the vector of a priori control variables, ε represents the error term.
The significance of each parsimonious model was determined by the residual, coefficient diagnostics and stability. The residual of the VAR model was tested for serial correlation, homoscedasticity and normality at the 5% level using the ARCH LM, Breusch-Godfrey and Jarque-Bera tests. The F test ensured the observed variables jointly influenced capital flight, while the correlation matrix ensured results were not affected by multicollinearity. The CUSM test assessed the stability of the residuals, and confirmed cumulative sums were located within the two standard deviation bands. The validity of the instruments used in the GMM model were verified with the use of the Hansen J statistic.
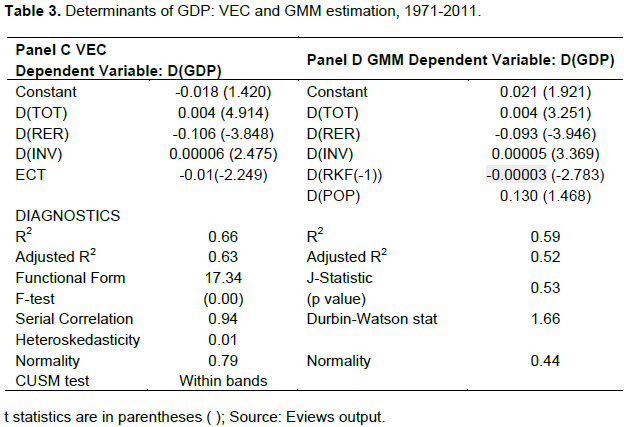
The results of the stationarity test indicate that all dependent and independent variables are characteristic of one unit root [I(1)] (Table 1). The econometric results of the investment models presented by the VEC (Panel A) and GMM (Panel B) estimation in Table 2 and the results of the GDP models shown by the VEC (Panel C) and GMM (Panel D) estimation show in Table 3 highlight the negative impact of capital flight.
The VEC model in Table 2 Panel A has an adjusted R2 of 66% and includes both significant long run and short run variables. The long run cointegrating variables were established with a lag length of 1 as specified by the Schwarz information criterion (SC), and one cointegrating rank as specified by the Unrestricted Johansen Cointegration Max Eigenvalue test. This long run stationary relationship amongst the independent and dependent I(1) variables (INV, RKF, RGE, CGDP and RD) is also supported by the significance of the error correction term (ECT) highlighted in Table 2 in the VEC model. The linear presentation of the vector of long run cointegrating is presented by:

The VEC result is in accordance with the stated a priori expectations, as it confirms the significance of capital flight as a determinant of domestic investment both in the short run and in the long run. Capital flight has a coefficient of -0.242 in the long run and -0.214 in the short run. This result exhibits the inverse relationship between capital flight and domestic investment in both time periods. When capital flight increases by one dollar, investment falls by $0.24 in the long run and $0.21 in the short run ceteris paribus. Furthermore, the results reveal a positive influence of government expenditure and changes in the growth rate on domestic investment in the long and short run. Conversely, the interest rate differential has an observed negative impact in both time periods.
The expected negative relationship is also supported by the GMM estimation results shown in Table 2 Panel B. The result of the GMM INV model show that a one-dollar increase in capital flight reduces domestic investment by $0.31 ceteris paribus. Additionally, a one-dollar increase in capital flight in the previous year reduces the level of real domestic investment by $0.11 in the current year. The controlled variables also retain the same signs.
The VEC model for GDP in Table 3 Panel C includes both significant long and short run variables. Thus, the theoretically proposed hypothesis whereby capital flight is associated with reduced GDP in Trinidad and Tobago is supported. This best fit regression model which includes four control variables has an adjusted R2 value of 63% for an optimal lag length of 2 as specified by the Schwarz information criterion (SC), and one co-integrating rank established by the Unrestricted Johansen Cointegration Max Eigenvalue test. The long run stationary relationship amongst GDP, RKF, INV and POP, is also established by the significance of the error correction term (ECT) highlighted in the VEC model Table 3 Panel C. This long run co-integrating equation is presented by:

The sign of the coefficient of capital flight and all control variables conform to economic theory. The coefficient of -0.003 shows that holding all other factors constant in the long run, a one percent increase in capital flight reduces the real GDP by 0.3%. The VEC results also show that the domestic investment positively impacted GDP in the long run, while the effect of population growth was negative. Unlike the long run result, the result for the first differenced short run control variables displayed in Table 3 Panel C are partially confirm stated a priori expectations. The positive coefficient of the terms of trade and domestic investment, and the negative coefficient of the real effective exchange rate are as expected. However, the insignificant effect of population growth and real capital flight on real GDP did not conform to a priori expectations and were eliminated from the model shown in Table 3.
The GMM model in Panel D of Table 3 shows that capital flight is associated with a reduction in GDP in the following year. This lag effect shows that a one-dollar increase in real capital flight reduces real GDP by 0.0003% in the following year. This lag in the adverse impact of capital flight on GDP shown in both the VEC and GMM models was unexpected. Additionally, this seemingly small impact of capital flight on real GDP could have resulted because the impact on GDP is masked by several other factors. One of such factor is the influence of the oil sector. The non-energy tradable sector in the last 50 years has been constantly shrinking as a share of GDP, making the economy energy-dependent, and increasing the risks for the entire economy to energy prices shocks (Artana et al., 2007).
The results presented in Tables 2 and 3 shows diagnostic tests. The models are normally distributed, show no sign of serial correlation or heteroskedasticity in the residual. The Hansen test for over identifying restrictions did not reject the null at any conventional level of significance since both estimations featured p values of 0.75 and 0.56. Thus, the instruments and the results of both GMM models were accepted.
CONCLUSION AND POLICY RECOMMENDATIONS
Capital flight is arguably a fundamental problem for Trinidad and Tobago. It has amounted to a real adjusted sum of US$40.9 billion or an average of 9.1% of GDP from 1971 to 2011. After 20 years of financial liberalization, the observed results contradict the conventional wisdom of reduced capital outflows post reforms. The results show that capital flight is associated with a reduction in domestic investment and GDP. This result remains robust with respect to other macroeconomic control variables and with different estimation techniques (VEC and GMM). The financial haemorrhage of capital flight is found to be associated with a reduction of domestic investment and GDP. In particular, the negative impact of capital flight for such a small open economy contradicts the view that capital outflows for portfolio diversification, due to limited domestic absorptive capacity, are harmless or even beneficial. Thus, this loss can further impair development as social sectors can be affected directly or indirectly.
Policy makers should not be passive to this source of potential instability. The reason for increased capital flight should be identified before appropriate policies can be utilized. Firstly, the determinants or causes of capital flight from Trinidad and Tobago should be clearly understood. Secondly, the domestic investment environment should be evaluated because capital flight may not only indicate poor regulative measures, but also an unfavourable investment environment. Thirdly, capital management techniques may also be needed to restrict the continuous outflow of capital from such an economy. Thus, capital flight can be added to the list of fears or reasons identified by Magud and Reinhart (2006) which support the use of capital controls. These results here can be a lesson for similar resource dependent developing economies of Africa and Latin America, some of whom are in the early phases of developing energy based industries.
The authors declare that there is no conflict of interest.
REFERENCES
|
Adegbite OE, Adetiloye AK (2013). Financial Globalisation and Domestic Investment in Developing Countries: Evidence from Nigeria. Mediter. J. Soc. Sci. 4(6):213-221.
Crossref
|
|
|
|
Adesoye BA, Olukayode E. Maku A, Atanda A (2012). Capital Flight and Investment Dynamics in Nigeria: A Time Series Analysis 1970-2006. Working Paper, Munich Personal RePEc Archive, Research Consulting, Nigeria, Globafrique.
|
|
|
|
|
Adetiloye KA (2012). Capital Flight versus Domestic Investment in
Crossref
|
|
|
|
|
AfDB (African Development Bank), OECD (Organisation for Economic Co-operation and Development), UNDP (United Nations Development Programme) and UNECA (United Nations Economic Commission for Africa) (2012). African Economic Outlook 2012. Paris: OECD.
|
|
|
|
|
Ajayi LB (2012). Capital Flight and Nigeria Economic Growth. Asian J. Fin. Account. 4(2):277-289.
Crossref
|
|
|
|
|
Ajilore TO (2010). An Economic Analysis of Capital Flight from Nigeria. Int. J. Econ. Fin. 2(4):89-101.
Crossref
|
|
|
|
|
Artana D, Sebastián A, Ramiro M, Sandra S, Patrick W (2007). Trinidad & Tobago: Economic Growth in a Dual Economy. In: Growing Pains: Binding Constraints to Productive Investments in Latin America, edited by Manuel Agosin, Eduardo Fernandez-Arias, and Fidel Jaramillo, 365-415. Washington, D.C., United States: Inter-American Development Bank.
|
|
|
|
|
Beja E (2011). Capital Flight and Economic Performance of the Philippines. In: Economic Policies and Issues on a Global Scale, edited by Henry J. Grover, and Nancy C. Regmond, 51-65. New York, NY: Nova Science Publishers.
|
|
|
|
|
Belford C, Greenidge K (2002). The Impact of International Financial Liberalisation on Economic Growth: The Case of CARICOM. In: Facing Globalisation: Impact and Challenges for Barbados and the Caribbean, edited by Harold Codrington, Roland Craigwell, Darrin Downes, 53-77. Barbados: Central Bank of Barbados.
|
|
|
|
|
Bennett KM (1989). Capital Flight and Its Implications for Caribbean Development. Paper presented at the Regional Programme of Monetary Studies Conference on Financing Development in the Caribbean, Bridgetown, Barbados, December 4-8.
|
|
|
|
|
Cerra V, Sweta SC, Meenakshi R (2005). Robbing the Riches: Capital Flight, Institutions, and Instability. IMF Working Paper 05/199, International Monetary Fund, Washington, D.C.
Crossref
|
|
|
|
|
Collier P, Anke H, Catherine AP (2001). Flight Capital as a Portfolio Choice. World Bank Econ. Rev. 15(1):55-80.
Crossref
|
|
|
|
|
Chakrabarty D, Areendam C, Chetan G (2006). Education, Growth, and Redistribution in the Presence of Capital Flight. Woking paper, Department of Economics, Louisiana State University, Louisiana, United States.
Crossref
|
|
|
|
|
Dutta N (2011). Financial Development and Capital Flight: Is the Association Non-Linear? Rev. Int. Econ. Forthcoming. Accessed November 2, 2013. http://papers.ssrn.com/sol3/papers.cfm?abstract_id=1260045
|
|
|
|
|
Enders W (1995). Applied Econometric Time Series. 2nd ed. New York: Wiley.
|
|
|
|
|
Epstein G (2005). Capital Flight and Capital Controls in Developing Countries: An Introduction. In: Capital Flight and Capital Controls in Developing Countries, edited by Gerald Epstein, 3-14. Cheltenham, UK: Edward Elgar.
|
|
|
|
|
Fofack H, Ndikumana L (2010). Capital Flight Repatriation: Investigation of its Potential Gains for Sub-Saharan African Countries. Afr. Dev. Rev. 22(1):4-22.
Crossref
|
|
|
|
|
Forgha NG (2008). Capital Flight, Measurability, and Economic Growth in Cameroon: An Econometric Investigation. Int. Rev. Bus. Res. Papers 4(2):74-90.
|
|
|
|
|
Gusarova V (2009). The Impact of Capital Flight on Economic Growth. Master's thesis. Kyiv School of Economics, Kyiv, Ukraine.
|
|
|
|
|
Henry L (1996). Capital Flight from Beautiful Places: The Case of Three Caribbean Countries. Int. Rev. Appl. Econ. 10(2):263-272.
Crossref
|
|
|
|
|
Kapoor S (2010). Illicit Financial Flows and Capital Flight. A Re-Define Briefing Paper, Europe.
|
|
|
|
|
Khodaei H (2012). The Calculation of Capital Flight and its Effect on Macroeconomic Variables in Iran. J. Basic Appl. Sci. Res. 2(9):9365-9369.
|
|
|
|
|
Lesotlho P (2006). An Investigation of the Determinants of Private Investment: The Case of Botswana. Master's thesis. University of the Western Cape, Botswana.
|
|
|
|
|
Magud NE, Reinhart CM (2006). Capital Controls: An evaluation. NBER Working Paper 11973, National Bureau of Economic Research, Cambridge, MA.
|
|
|
|
|
Nkurunziza DJ (2012). Illicit Financial Flows: A Constraint on Poverty Reduction in Africa. Bull. Assoc. Concerned Afr. Scholars 87:15-21.
|
|
|
|
|
Ndiaye AS (2009). Impact of Capital Flight on Domestic Investment in the Franc Zone. In Africa's Development Challenges and Opportunities in the Global Arena –Proceedings of the African Economic Conference 2007 in Addis Ababa, Ethiopia, edited by African Development Bank and United Nations Economic Commission for Africa, 317–355. Paris: Economica.
|
|
|
|
|
Ndiaye AS (2012). Effect of Capital Flight on Financial Development in the West African Economic and Monetary Union. Paper presented at the African Economic Conference on Economic Development, Africa, March 18-20, 2012.
|
|
|
|
|
Ndikumana L, Boyce JK (2008). New Estimates of Capital Flight from Sub-Saharan African Countries: Linkages with External Borrowing and Policy Options." Working Paper Series Number 166, Political Economy Research Institute, University of Massachusetts, Amherst.
|
|
|
|
|
Saheed ZS, Ayodeji S (2012). Impact of Capital Flight on Exchange Rate and Economic Growth in Nigeria. Int. J. Humanit. Soc. Sci. 2(13):247-255.
|
|
|
|
|
Schneider B (2000). Issues in Capital Account Convertibility in Developing Countries. Working Paper, Overseas Development Institute, Stag Place, London, United Kingdom.
|
|
|
|
|
Umoru D (2013). Capital Flight and the Nigerian Economy. Eur. J. Bus. Manage. 5(4):2222-1905.
|
|
|
|
|
Vukenkeng AW, Mukete EM (2016). Capital Flight and Economic Development: The Experience of Cameroon. Economics 5(5):64-72.
Crossref
|
|
|
|
|
Wahyudi ST, Maski G (2012). A Causality between Capital Flight and Economic Growth: A Case Study Indonesia. Working Paper, Department of Economics, Brawijaya University, Indonesia.
|
|
|
|
|
Wooldridge JM (2001). Applications of Generalized Method of Moments Estimation. J. Econ. Perspect. 15(4):87-100.
Crossref
|
|
APPENDIX