Full Length Research Paper
ABSTRACT
This study aims to investigate the relationship between corruption and growth in the context of the Arab world. By controlling the different variables that affect growth, the study tries to focus on how corruption could have affected growth and in which way. The literature leans towards corruption having a negative impact on growth and development, however such view is not pervasive as there are some arguments emphasizing that there might be positive implications for corruption. Moreover, there are some other variables including type of political regime, degree of development, poverty levels, etc that shape the relationship between corruption and growth. The interaction between those variables and corruption produces different impacts on growth. Qualitative analysis shows that among Arab countries there is certainly a negative relationship between the gross domestic product (GDP) per capita and high level of corruption. However, there is no exact relationship between the type of political regime and corruption. Additionally, the study estimated a panel data random effects model to evaluate the impact of corruption on economic growth in 15 Arab countries during the period (1998 to 2009). The study results support the negative direct impact of corruption on growth in this sample of Arab countries, which confirms “sanding the wheels” hypothesis, yet this impact highly depends on other variables, and namely the governance structure. A good governance structure shows that corruption has a determinal impact on growth. When the governance structure is very poor the impact of corruption on growth tends to be lower or most probably positive, that goes along with “greasing the wheels” hypothesis. Thus, it is necessary to improve the governance quality in Arab countries hand in hand with controlling corruption, in order to achieve better growth performance.
Key words: Corruption, economic growth, democracy, governance, Arab countries.
INTRODUCTION
The relationship between growth and corruption has attracted the attention of economists trying to understand how corruption affects growth. The channels through which corruption affects growth, the nature of the effect, and its significance remain questions that still did not find a concrete answer whether from a theoretical or from an empirical point of view. Recent studies show a significant negative effect of corruption on growth, yet this result still cannot be generalized. Arab countries have attracted the attention of scholars due to the rising Arab spring effect. The nexus between the Arab Spring, corruption, and the growth models adopted in Arab countries has created increased interest in trying to understand the relationship between corruption and growth in the Arab countries. Crony capitalism, nepotism, and favoritism have been evident features of the Arab countries that experienced the Arab Spring phenomenon. Yet, growth performance differs sharply in Arab countries whether those that have experienced an Arab Spring effect or not. Even among those that have experienced the Arab Spring, the growth model adopted has not been identical and the extent of corruption was different.
This study aims at investigating the relationship between corruption and growth in the context of the Arab world. By controlling for the different variables that affect growth, the study tries to focus on whether corruption affects growth and the direction of this effect. Do the Arab countries specificities of oil abundance and/or dictatorship regimes provide additional insights on the relationship between corruption and growth?
LITERATURE REVIEW
Corruption usually leads to inefficient economic outcomes. It reduces domestic and foreign investments, creates rent seeking activities and distorts sectoral policy choices by creating incentives to contract large public projects rather than smaller projects that might be of greater relevance to the economy (Gray et al., 1998). Corruption generates also economic distortions in the public sector by diverting public investment away from efficient usage, as education, into inefficient capital projects where bribes and kickbacks are flourishing. Officials may increase the technical complexity of public sector projects to conceal such dealings, thus further distorting investment (Kaufmann and Mauro, 1996) . In other words, there are several channels through which corruption can negatively affect growth.
Empirical evidence has been leaning towards the conclusion of emphasizing the negative significant impact of corruption on growth. However, the evidence has not been pervasive, where channels of effect differed as well as the significance of effect. Moreover, some studies showed that the relationship has not always been negative. From the first camp, showing the negative impact of corruption on growth, Meon and Sekkat (2005) found through empirical analysis that corruption has a negative effect on growth, independent of its impact on investment, which has also been negative.
Corruption leads to misallocation of resources mainly through rent seeking activities , as well as less human and capital productivity via lower compliance with construction, environmental, or other regulations; reduction of the quality of governmental services and infrastructure; and increases in the budgetary pressures on government. These distortions deter investment and reduce economic growth. Other studies have shown that good governance (including fighting of corruption) affects significantly economic growth and development. For example, Mauro’s (1997) indicates that “a one standard deviation improvement in bureaucratic inefficiency is significantly associated with an increase in the average investment rate by 4.3 percent of GDP” and “with a 1.3% point increase in the annual growth rate of GDP per capita.”
Mauro's (1997) analysis of 94 countries suggests that a reduction in corruption of 2.38 points on his 10-point scale would increase a country’s annual investment by 4 percent of gross domestic product (GDP), and would increase annual growth of GDP per capita by 0.5 percent. However, political stability as identified in Mauro (1995) might have a more significant impact on growth when compared to bureaucratic inefficiency. Similarly, Keefer and Knack (1995) indicate that improving the quality of public institutions in developing countries to levels that are more similar to those in developed countries reduces the gap in income per capita between the two. And, Wei (1999) has also shown that an increase in (bureaucratic) corruption from a level akin to Singapore’s to one more similar to that of Mexico’s is “equivalent to a thirty two percentage point increase in the tax rate” on multinational firms” and “a one percent increase in a host country’s tax rate on multinationals is associated with a five percent reduction in that country’s inward foreign direct investment (Asian Development Bank, 1999).”
The World Bank’s The State in a Changing World, World Development Report 1997 further refines this relationship between corruption and investment by distinguishing between the level of corruption and the predictability of payments and outcomes. It suggests that investment drops off most in countries where corruption levels are high but the predictability of payments and outcomes is nonetheless low. Thus, a large portion of empirical literature has shown that corruption diverts the public investments allocation from efficient delivery of services that the poor are in need of to lucrative mega large projects as construction and infrastructure projects where the room for corruption increases (USAID, 2005). Combating corruption and its impact on economic development and growth should not be underestimated. As cited in Kaufmann (2005) improving governance in a country can result in tripling the income per capita.
Corruption also affects income distribution, where as argued by Kaufmann (2006) and UNDP (2004) corruption acts as a regressive tax on household sector where lower income families and individuals pay a disproportionate share of their incomes in bribes to access public services. This in itself worsens income distribution. Yet, the problem is embedded in the fact that in many cases and especially in developing countries governments intentionally get larger in size in order to account for the large public services they envisage to count for the inequalities in income distribution they often face. Hence, larger governments by default are more prone for corruption. This puts policy makers in a tradeoff between larger governments with the good intention to target the poor and count for income distribution, yet in reality they are more vulnerable to more corruption, and smaller governments which cannot handle large public services programs and are less prone to corruption (Alsenia and Angeletos, 2005).
The other group of studies which proved that corruption can have a positive impact on growth in an environment that is characterized by pervasive and cumbersome over regulation and red tape (weak governance), view that bureaucratic corruption (as a second best solution can actually lessen the burden of excessive regulation and hence have positive implications on growth (Bardhan, 1997). In other words, in a framework of imperfect competition where several market failures prevail due to weak governance measures, corruption can induce a positive change by distorting the distorted market, hence bringing allocative and dynamic efficiencies (Mironov, 2005). This argument has been severely criticized in the literature arguing that it does not have theoretical foundations (Syef, 2001) and that "greasing the wheels" by "speed money" is a wrong argument as it enhances the discretion of corrupt politicians and senior government officials (Kaufmann, 1997).
Some studies have focused on the relationship between corruption and level of development (as proxied by GDP per capita). Such studies found that there is a negative relationship between the proliferation of corruption and GDP per capita. In other words, poor societies suffer relatively more from high corruption levels. However, the direction of causality is not clear where whether corruption reduces level of development or vice versa has not been clearly identified (Lambsdorff, 2005). Moreover, the correlation is not always significant where some developing countries as Botswana and Chile have less bribes than most of the industrialized countries (Gray and Kaufmann, 1998).
Few studies have tackled the issue of the nature of the political regime (democracy versus autocracy) and its relationship with corruption. The conventional wisdom has articulated that corruption is less in democratic regimes where checks and balances are more prevalent, yet there is no conclusive relationship between the two variables on empirical basis (Ehrlich and Lui, 1999), although there exist some studies that have applied econometric analysis on large data sets and reached the conclusion that democracy tends to control corruption (Drury et al., 2006). As pointed out by Lambsdorff (2005), intermediate, or pre mature, and lukewarm types of democratic regimes do not necessarily reduce corruption, and the positive impact of democracy on reducing corruption only appears in the long run.
In other words, the literature leans towards corruption having a negative impact on growth and development, however such view is not pervasive as there are some arguments emphasizing that there might be positive implications for corruption. Besides, there are some other variables including type of political regime, degree of development, poverty levels, etc that shape the relationship between corruption and growth. The interaction between those variables and corruption produce different impacts on growth.
Corruption and growth in the Arab world
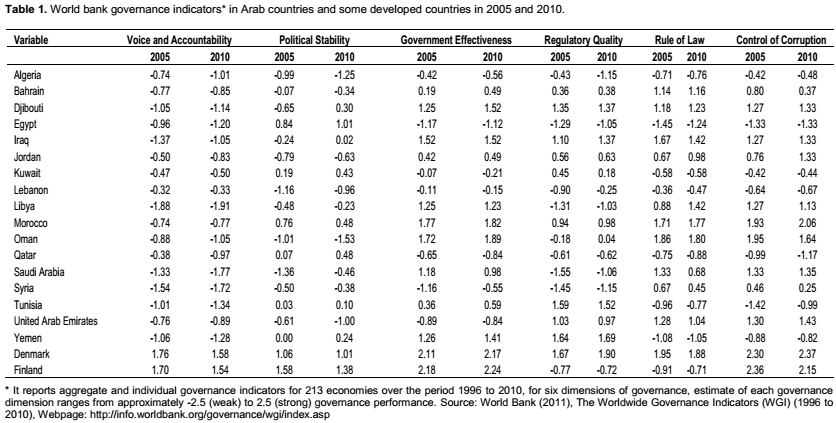
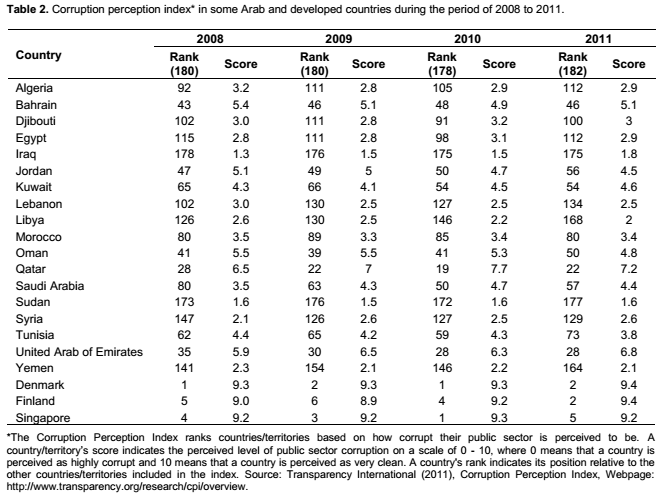
Corruption has been believed to be pervasive in the Arab world. According to some estimates the costs of corruption had reached $ 1 trillion over the period 1950 to 2000 (Arab Anti-Corruption Organization, AACO, 2012). The nature of state business relationships in this part of the world has been based on personalized rather than an institutional setup, where patronage and nepotism dominate such setup (Malik and Awadallah, 2011). Several factors have contributed to the proliferation of corruption, including the lack of democracy, being an important element of accountability; nature of governing regimes (autocracy and monarchies); time horizon of remaining in power; weak parliaments; proliferation of poverty in a number of Arab countries; and lack of rule of law (Salem, 2006). The Arab countries have been ranked low in governance indicators, which in fact have deteriorated over time (Table 1). As a result, a number of Arab countries ranked weak in the different corruption indices, again with a general trend of deterioration over time (Table 2).
Yet, as literature review indicated, the empirical evidence has not been conclusive on the relationship between type of governing regime and corruption, although there has been some kind of agreement that democracy reduces corruption. Arab countries, till the Arab Spring, have been considered among the least democratic countries in the world. However, the rentier state developmental model and/or availability of windfall gains arising from foreign aid or other sources (for example, workers’ remittances) have enabled some of the Arab countries to achieve high rates of growth in many cases. Figures 1 and 2 show the relationship between the level of corruption and GDP per capita on one hand and the level of corruption and type of political regime on the other.
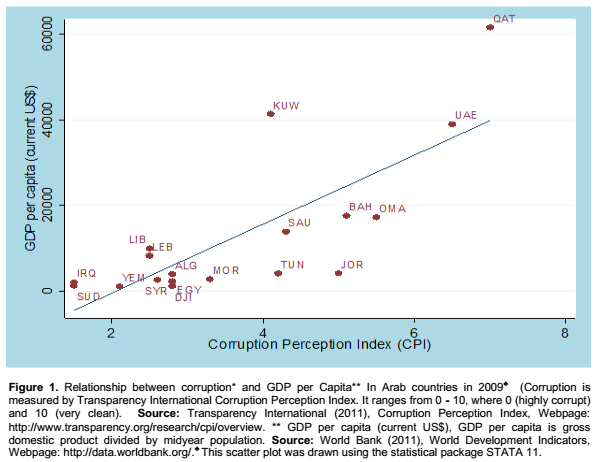
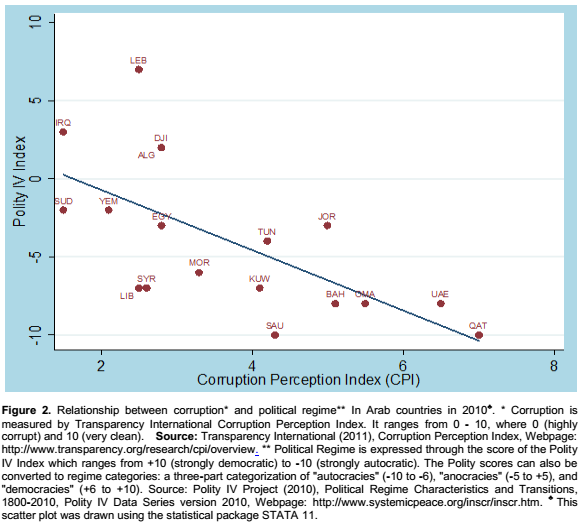
Figure 1 shows that among Arab countries there is certainly a negative relationship between the GDP per capita and high level of corruption. However, figure 2 shows that there is no exact relationship between the type of political regime and corruption, as countries that highly score on democracy suffer from high degree of corruption compared with countries that score low on democracy but low on corruption. For example, Gulf countries are perceived to be more autocratic (monarchies) which should according to signals provided by the literature suffer from higher levels of corruption, but this was not indicated by the data as shown in the figure. However, countries which are relatively more democratic (for example, Egypt and Lebanon) seem to suffer from higher degree of corruption. In other words, the case of Arab countries based on Figure 2 shows that that there is a negative relationship between democracy and corruption.
Hence, there seem to be a number of variables that interact, and that are difficult to control, when trying to focus on the relationship between corruption and growth in Arab countries. The oil domination of the economies of many Arab countries (whether rich as Gulf countries, Iraq and Libya or poor as Sudan and Yemen) seems to complicate matters. Moreover, there are some other aspects that can increase the tendency of corruption in general as large public investment, provision of public goods below market prices, and discretionary decisions in allocating entitlements (for example, land) (Tanzi, 2006). Unfortunately, Arab countries suffer from the prevalence of such aspects whether due to the relative richness of the countries (as in the case of Gulf countries) or due to the proliferation of poverty in others (as in the case of Egypt, Sudan and Yemen).
Hence, in the case of Arab countries it will be extremely naive to test the relationship between growth and corruption, while not pinpointing two crucial factors that are not necessarily captured by data, namely weak institutions and oil domination. The study tries in the following section, to the extent available, to control the factor of weak institutions. However, it is extremely difficult, if not impossible to control for the role of oil, and/or other windfall gains when focusing on the relationship between growth and corruption.
It is worth noting that the majority of Arab countries have undertaken significant steps for combating corruption, ranging from enactingspecific laws, establishing new watch dog and anticorruption agencies, to producing home grown reports on corruption. Yet, their efforts remained humble in effect. The reason for this meager effect as identified by Ashour (2006) embedded in the fact that such reforms remained short of seriously attacking the system under which corruption thrives, remained not integrated in a comprehensive plan and full-fledged strategy for fighting corruption, and finally were not backed up by sincere political will.
EMPIRICAL ANALYSIS
Model specification
This section attempts to answer the following question:
"What is the impact of corruption on economic growth in a sample of Arab countries?", through estimating a panel regression for a sample of 15 Arab countries during the period (1998 to 2009). This study adopts the model used by Méon and Sekkat (2005). Since the modern growth literature has focused mainly on a common specification: cross-countries regression. Also, studies of the institutional and political determinants of growth have widely used the same technique. In the model used in this study, GDP per capita growth rate is expressed as a combination of a few explanatory variables, which are: GDP per capita in the initial year of the period under study, population growth, school enrollment, investment ratio in GDP and a measure of openness to trade. Depending on the purpose of the empirical analysis additional explanatory variables (e.g. corruption) are incorporated. Also, this part will examine how the quality of governance affects the impact of corruption on growth. Therefore, two additional sets of explanatory variables are considered. One refers to corruption indices while the other concerns measures of the quality of governance.
In econometric terms, examining whether growth increase or decrease with corruption when the quality of governance is low implies testing how the latter affects the coefficient of corruption. Hence, the usual set of explanatory variables in the growth regression is complemented by a corruption index and an interaction term defined as the product of that corruption index by a proxy for the quality of governance. This results in thefollowing specification for the growth rate of per capita income:
gdppcgrit = β0 + β1 gdppci0 + β2 Scit + β3 popgrit + β4 invit + β5 openit + [β6 + β7(govit)]corrit + μit
Where:
gdppcgrit: is the growth rate of per capita income
gdppci0: is the initial per capita income
Scit: is the level of schooling
popgrit: is the growth rate of population
invit: is the ratio of investment to GDP
openit: is the degree of openness of the economy
corrit: is the corruption index
govit: is the governance indicator
μit: is the error term
The purpose of including per capita GDP in the first year of the sample period is to take into account the absolute convergence effect highlighted in the neo-classical growth model. Similarly, population growth allows taking into account the negative effect of demographic growth on the growth rate of per capita income. The study also use the enrollment ratio in primary school defined as the ratio of total enrollment, regardless of age, over the population of the age group that officially corresponds to the level of education shown as a common proxy for human capital. An improvement in human capital should boost growth and investment. Theory suggests that the impact of openness on growth should be positive, although the empirical literature has not strongly confirmed such an effect. Openness is defined as the ratio of exports plus imports to GDP. It is used as a proxy for the exposure of the economy to foreign markets.
In this model the parameters of interest are β6 and β7. Under “greasing the wheels” hypothesis the decline in level of corruption (that is, an increase in the score of corruption index, since the increase in this score implies lower corruption level) should have a negative impact on the economic activity and especially if the quality of governance is very low. In the sample very low quality of governance implies (gov) less than zero. With (gov) less than zero, β6 should be negative for corruption to have a positive impact on the economic activity. With high quality of governance the impact of corruption should become negative. In order to get such an impact β7 should be positive. Under “sanding the wheels” hypothesis, corruption is harmful for growth and becomes increasingly detrimental as governance deteriorates. In this case, β6 should be positive for corruption to still have a negative impact. For this impact to be more negative under low quality of governance (gov less than zero) than under high quality (gov above 0) β7 should be negative.
Data
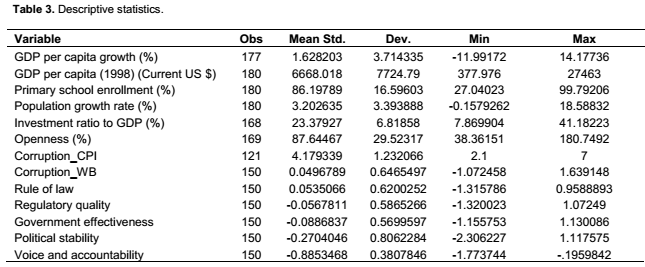
The study uses two composite indices to assess the consequences of corruption. The two indices are the Corruption Perception Index (CPI) published by Transparency International and the control of corruption (WB) index provided by the World Bank. The CPI index is computed yearly as an average of other indices. It ranges from zero to ten, the latter corresponding to an absence of corruption. Unlike the CPI index, the World Bank’s corruption indicator is not an average of other indices. Instead, it is estimated thanks to an unobserved component model that is described in Kaufman et al. (1999). Regarding their composition, the CPI and the WB indices also differ insofar as they aggregate slightly different sets of basic indicators of corruption. The two indices therefore stand as two useful complements, since they aggregate two different sets of indicators thanks to two different methods. The WB indicator ranges from –2.5 to +2.5. Like the CPI index, it is constructed so that an increase in the index reflects a better control of corruption. To measure other dimensions of governance, this study will use the rest of Worldwide Governance indicators published by the World Bank, other than the control of corruption index. These indicators include five composite indices. Each composite indicator refers to a different dimension of governance, “voice and accountability”, “political stability”, “government effectiveness”, “regulatory quality”, and “rule of law”. Like control of corruption index, each indicator ranges from –2.5 to +2.5, higher values signaling better governance. As for economic data, it is collected from the World Developments indicators database of the World Bank. Descriptive statistics for all variables used in the model are found in (Table 3).
Empirical results and analysis
The equations are estimated using random effects, according to the results of Hausman test done on this data, the random effects is more favored than fixed effects since it gives more efficient and consistent estimators. The model uses panel data for 15 Arab countries during the period (1998 to 2009). The countries included in the sample are: Algeria, Bahrain, Djibouti, Egypt, Jordan, Kuwait, Lebanon, Oman, Qatar, Morocco, Saudi Arabia, Syria, Tunisia, United Arab of Emirates, Yemen. The reason behind choosing this sample of Arab countries is data availability or coverage.
A preliminary investigation of "greasing the wheels" and "sanding the wheels" claims consists of examining the impact of corruption on growth independent of the level of governance. This is done by estimating the equation stated above without the interaction term (that is, setting β7 = 0). We conducted this investigation using both transparency international Corruption Perception Index and the WB Control of Corruption Index (Table 4).
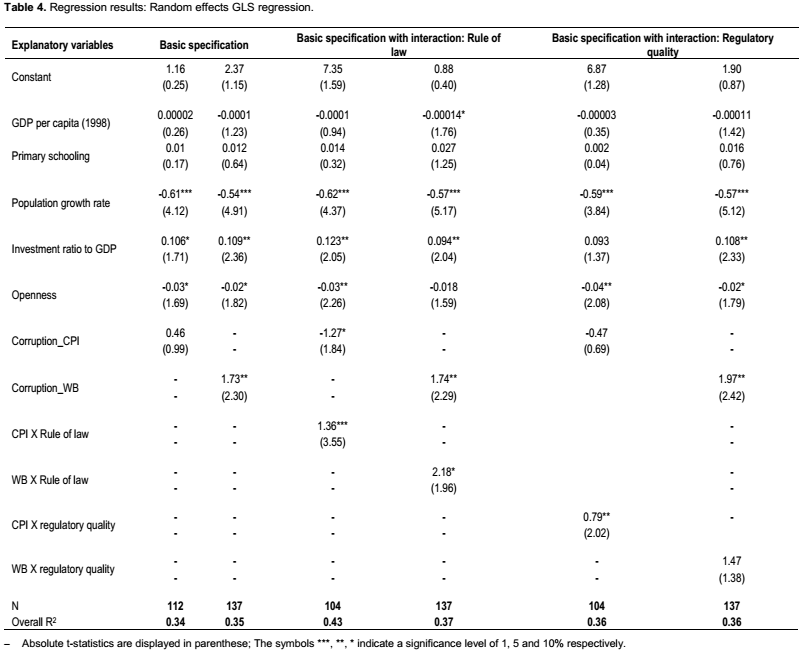
There are three specifications. The basic specification includes all the explanatory variables in stated equation except the interaction term. Each of the other two specifications includes the interaction term. The results are reported for two governance indicators: Rule of law, and Regulatory Quality. To save on space, the results with the government effectiveness, political stability and lack of violence and the voice and accountability indicators are not reported. The coefficients of the interaction terms with these indicators are never significant. This suggests that the accountability of political leaders, the political stability and government effectiveness framework do not modify the impact of corruption on growth.
Across specifications, most coefficients have the expected sign, although not always significantly. Initial GDP per capita enters the regressions with a negative sign but is in general insignificant. However, in the specification using WB control of corruption indicator and the interaction term with rule of law, the coefficient of initial GDP is significant, but only at the 10% significance level, which means that we observe the usual convergence effect in this case. The coefficient of primary school enrollment is correctly signed but always insignificant. Population growth enters the regressions negatively and is generally significant at all significance levels, which indicates the negative effect of demographic growth on growth. Openness has a negative sign and is always significant mostly at 10% significance level. This contradicts the usual theory that suggests a positive impact of openness on growth. Finally, the investment ratio is always significant and exhibits a positive coefficient, mostly at the 5% and 10% significance level.
Regarding corruption, both indices appear in the basic specification regression (with no interaction terms) with a positive coefficient. While the coefficient of the CPI is insignificant at all significance levels, the WB control of corruption index is significant at 5%. This means that corruption tends to hamper growth, and controlling corruption affects positively the growth rate of per capita income. This result confirms previous studies (Mauro, 1995 and Mo, 2001) that observed the same relationship, and supports “sanding the wheels” hypothesis.
In the second specification including the interaction term with rule of law indicator, the CPI appears with a negative and significant coefficient at 10% significance level. This implies that the decline in the level of corruption (i.e. increase in the score of CPI) has a negative effect of growth rate of per capita income, especially if the quality of governance is very low (the rule of law indicator is less than zero), since the coefficient on the interaction term is positive and significant at all significance levels. This supports “greasing the wheels” hypothesis that corruption may boost growth in the presence of weak rule of law. While at very high levels of rule of law (the rule of law indicator is far higher than zero) the decline in the level of corruption will have a positive effect on growth in this case (since the coefficient of the interaction term is larger than the CPI coefficient). As for the WB control of corruption indicator, it has a positive and significant coefficient at 5% significance level. This indicates that controlling corruption (that is, increase in the score of WB index) has a positive effect on growth, especially if the quality of governance is high (the rule of law indicator is greater than zero), since the coefficient of the interaction term is positive and significant at 10% significance level. But at very low levels of governance and poor rule of law (rule of law indicator is much less than zero), controlling corruption may have a negative effect on growth.
As for the third specification that includes the interaction term with regulatory quality indicator, the CPI also appears with a negative but insignificant coefficient at all significance levels, while the coefficient on the interaction term is positive and significant at 5% significance level. This implies that at high levels of regulatory quality (that is, the regulatory quality indicator is higher than zero) the decline in the level of corruption (that is, an increase in CPI) will have a positive effect on growth. But at low levels of regulatory quality (that is, the indicator is less than zero) corruption will affect growth positively. This supports again “greasing the wheels” hypothesis that corruption should have positive impact on the economic activity if the quality of governance - regulatory quality in this case - is very low. On the other hand, the WB control of corruption index has a positive and significant coefficient at 5% significance level, while the coefficient of the interaction term is insignificant at all significance levels. This means that corruption tends to hamper growth independent of the level of regulatory quality.
Hence, these results show that impact of corruption on growth depends on the level of governance prevailing in the country, and also on the indicator used to measure corruption. It follows that the results of this section neither accept nor reject "greasing the wheels" hypothesis in the Arab countries, unlike the results of Méon and Sekkat (2005) which rejects this hypothesis and supports “sanding the wheels” hypothesis instead. In this study the direct impact of corruption in Arab countries on growth is negative, but poor governance tends to make corruption more helpful to growth. Yet, it is worth mentioning that these results depend also on the sample and techniques of estimation used, which leaves room for further research to check the validity of these results using a different sample, longer period of time, other specifications, or different techniques of estimation.
CONCLUSION AND RECOMMENDATIONS
Based on data of 15 Arab countries during the period (1998 to 2009), the study’s empirical analysis has shown that the relationship between corruption and economic growth is not linear. In fact, the significant role played by many other variables in the context of Arab countries implies that story is more complex, and hence solutions are not straightforward. In other words, contrary to the empirical evidence reviewed, and not in line with the conventional wisdom, reducing level of corruption will not necessarily imply higher economic growth in Arab countries. The positive impact of reducing corruption on economic growth hinges upon a number of factors as reforming institutions that ensure accountability and prevent conflict of interest, as well as other factors as enhancing the role of civil society.
In other words, this study supports the negative direct impact of corruption on growth in this sample of Arab countries, which confirms “sanding the wheels” hypothesis, yet this impact highly depends on other variables, and namely the governance structure. A good governance structure shows that corruption has a detrimental impact on growth. When the governance structure is very poor the impact of corruption on growth tends to be lower or most probably positive that goes along with “greasing the wheels” hypothesis. Thus, there is need to improve the governance quality in Arab countries hand in hand with controlling corruption, in order to achieve better growth performance.
Another important aspect to highlight in the context of Arab countries is that the Arab Spring will not directly lead to less corruption. As indicated by literature, pre mature democracy does not ensure less corruption. Moreover, as has been proven according to empirical evidence, periods of reform involve a high degree of flux and hence corruption in fact can increase as happened during the transitional period of Central and Eastern Europe (Kaufmann, 1997).
There are a number of policy implications for Arab countries to ensure that fighting corruption results in a positive impact on growth. Overcoming corruption cannot be solely attained and sustained by only punishing the corrupt or by establishing new agencies or enacting more laws. There must be fundamental changes in the bureaucratic system and machinery of the society as shown by the Hong Kong experience. In other words, there must be a whole institutional framework capable of managing and monitoring corruption. In Arab countries there exist several agencies that deal with corruption. In addition, fraud and corruption in the majority of Arab countries’ laws and regulations are considered a criminal act.
Nevertheless, the roots of corruption are embedded in the weak system of checks and balances, weak procedures for public reporting on corruption, absence of measures tackling nepotism and favoritism, lack of full independence of anticorruption agencies, absence of whistle blowing mechanisms, and proliferation of conflict of interest. All those factors are highly linked to the authoritarian regime, long lasting one party rule, and high government intervention in the economy. Moreover, and most importantly, the low wage scale in civil service of
the non-Gulf Arab countries and the wide gap in income levels are amongst the most important reasons behind the proliferation of corruption in both countries.
To combat corruption in an efficient manner, a well comprehensive strategy should be set. International donors have produced several documents identifying different ways and strategies to combat corruption and pinpointing the key challenges based on the success stories of countries across the world. Defining an overall strategy is the key starting point and the failure to identify this strategy could lead to dissatisfaction results in eradicating corruption. The strategy should have two major features as identified by Gray and Kaufmann (1998) . “Emphasis should be placed on selecting the key measures to be implemented, in line with a country’s implementation capabilities, during the first and subsequent stages of an anticorruption campaign. The entrenched nature of systemic corruption requires boldness in implementation-incrementalism is unlikely to work.” Following the World Bank (2000), such strategy should consists of the following:
1. Existence of a credible leadership.
2. Defining entry points for fighting corruption: since the issue is difficult to handle in a comprehensive manner, countries should start by identifying entry points with a time frame to tackle specific issues, which can act as a pilot for further work.
3. Developing a diagnosis for the extent of corruption in the country which should be undertaken by a capable and credible agency or organization.
4. Assessment of the political culture where accountability mechanisms should be studied to ensure effective means of combating corruption and identifying the loopholes existing in the political culture which can defy the activities undertaken to fight corruption.
The World Bank has stressed two main conditions for the success of any strategy aiming at fighting corruption, namely sequencing and sustainability. To ensure that such conditions are met, there is a need for engagement of civil society in the process of fighting corruption, building critical mass among the population, and ensuring that the necessary technical and financial capacities to implement this strategy are available. Following the overall strategy, a comprehensive institutional framework that governs detection of corruption and monitoring it should be set.
De Asis (2000) provides an action plan of how to fight corruption once the vision is clear and there is a political will. Among the components of such action plan is the establishment of a steering committee that sets the agenda needed of policies and regulations to fight corruption. Such steering committee should comprise representatives from the government and civil society. The institutional framework should consist of policies and regulations. Moreover, code of conduct and guides on anticorruption measures should be made available and actionable. For example, fighting corruption in the privatization process should be made available. This type of guides has been made available by some international organizations as GTZ of Germany (GTZ, 2004). In addition there are major key factors to ensure success of this type of strategy including: government determination; strong legislation; public support; efficient system of checks and balances; and international cooperation. Help from international donors with expertise in this field is of paramount importance. The World Bank has been among the leading international organizations in this regard (World Bank, 2000).
Countries’ experiences in fighting corruption have shown that the engagement of civil society in monitoring the process of public service delivery is of crucial importance for the success of any anticorruption scheme. This is mainly undertaken by ensuring the access of public to information and making detailed information available upon request for the public representatives (Asian Development Bank, 2004). However, the process of ensuring public access to information is not an easy task. It requires building up of a whole strategy and a framework where the details of how the information is to be provided, on which basis, how much fees, contradiction with issues of privacy and data protection, etc. should be tackled in a prudent manner. Organisation for Economic Co-operation and Development (OECD) has many experiences in this regard and can certainly help by providing the technical expertise (OECD, 2001).
In general, Arab countries should pay extra attention to institutional and regulatory reform. In other words, combating corruption should be integral within an overall strategy of institutional and regulatory reform. Regulations are indispensible to ensure the proper function of economies and societies. What is needed is clear "rules of the game" for politicians and different stakeholders of the society. Such rules of the game should be properly implemented to ensure that such regulations are effective.
Furthermore, absence of a sincere (versus announced) political will to combat corruption can be the main reason behind the proliferation of corruption in Arab countries. Hence, it should be clear that any forthcoming initiative should be politically supported to ensure its success. The transformation towards democratization in countries that have experienced the Arab Spring cannot guarantee such move as explained above, as extra effort is needed at early stages of democracy. Finally, reducing petty corruption requires reducing poverty levels since both are highly correlated (Riley, 1999). Yet, there is also a need to increase literacy, and especially political literacy, which is the key strategy to reducing petty corruption in relatively poor Arab countries as Egypt, Sudan, and Yemen. All such elements of reform mentioned above are integral in any initiative to combat corruption. Piece-meal reform is not likely to yield any positive outcome, if not accompanied by other reforms.
CONFLICT OF INTERESTS
The author has not declared any conflict of interests.
REFERENCES
|
Alsenia A, George-Marios A (2005). "Corruption, Inequality, and Fairness", NBER Working Paper Nr. 11399, National Bureau of Economic Research. Arab Anti-Corruption Organization (AACO). Ashour AS (2006). "Integrity, Corruption, and Development: A Systematic Approach", presentation delivered at ESCWA, April 2006. |
|
|
Asian Development Bank (1999), "Good Governance and Anticorruption: The Road Ahead for Indonesia", paper presented at the eighth consultative group on Indonesia, 27-28 July, Paris. |
|
|
Asian Development Bank (2004). Anti-corruption Policies in Asia and the Pacific: The Legal and Institutional Frameworks for Fighting Corruption in Twenty One Asian and Pacific Countries, Asian Development Bank. |
|
|
Au YJ (2000). "Fighting Corruption: The Hong Kong Experience", paper presented at the seminar on international experiences on good governance and fighting corruption, Bangkok, 17 February, 2000. |
|
|
Bardhan P (1997). Corruption and Development: A Review of Issues. J. Econ. Lit. 35(3):1320-1346. |
|
|
De Asis MG (2000). "Coalition Building to Fight Corruption", paper prepared for the anti-corruption summit. |
|
|
Drury AC, Jonathan K, Michael L (2006). Corruption, Democracy, and Economic Growth. Intern. Polit. Sci. Rev. 27(2):121-136. |
|
|
Ehrlich I, Francis TL (1999). Bureaucratic Corruption and Endogenous Economic Growth. J. Polit. Econ. Vol. 107, No. 6, Part 2: Symposium on the Economic Analysis of Social Behavior in Honor of Gary S. Becker (Dec., 1999). pp. S270-S293 Published by: The University of Chicago Press Stable. Fernandes Marcos, Gonçalves da Silva, Fernando Garcia, and Andrea Camara Bandeira (undated), "How does corruption hurt growth? Evidences about the effects of corruption on factors productivity and per capita income. Gray, Cheryl and Daniel Kaufmann (1998), "Corruption and Development", Finance and Development, March, 1998, Washington D.C.: World Bank. |
|
|
GTZ (2004). Avoiding Corruption in Privatization: A Practical Guide, Eshborn: 2004. |
|
|
Kaufmann D (1997). "Corruption: The Facts. Foreign Policy107:114-31. |
|
|
Kaufmann D (2005). "Back to Basics — 10 Myths About Governance and Corruption. Finance and Development, IMF, September 2005, 42(3). |
|
|
Kaufman D (2006). Myths and Realities of Governance and Corruption, Chapter 2.1 in Global Competitiveness Report 2006/2007, World Economic Forum, New York: Oxford University Press. |
|
|
Knack S, Philip K (1995). Institutions and Economic Performance: Cross-Country Test Using Alternative Institutional Measures. Econ. Politics 7(3):207-227. |
|
|
Lambsdorff JG (2005). Consequences and Causes of Corruption – What do We Know from a Cross-Section of Countries? University of Passau, Diskussionsbeitrag Nr. V-34-05, Volkswirtschaftliche Reihe ISSN 1435-3520. |
|
|
Malik A, Bassem A (2011). "The Economics of the Arab Spring", OxCarre Research Paper No. 79, Oxford: Oxford Centre for the Analysis of Resource Rich Economies. Mauro P (1995). Corruption and Growth. The Quart. J. Econ. 110(3):681-712. |
|
|
Mauro P (1996). The Effects of Corruption on Growth, Investment, and Government Expenditure", IMF Working Paper, No. 96/98, International Monetary Fund, Washington, DC. Mauro P (1997). The Effects of Corruption on Growth, Investment, and Government Expenditure: A Cross Country Analysis", In Kimberly A. Elliot, ed. Corruption and the Global Economy, Washington, D.C.: Institute for International Economics. |
|
|
Méon P, Khalid S (2005). Does corruption grease or sand the wheels of growth? Public Choice 122:69-97. |
|
|
Mironov M (2005). Bad Corruption, Good Corruption and Growth", University of Chicago, mimeo. |
|
|
Mo PH (2001). Corruption and Economic Growth. J. Comp. Econ. 29:66-79. |
|
|
OECD (2001), Citizens as Partners: OECD Handbook on Information, Consultation, and Public Participation in Policy Making, Paris: OECD. |
|
|
Polity IV Project (2010). Political Regime Characteristics and Transitions, 1800-2010, Polity IV Data Series version 2010. |
|
|
Riley S (1999). Petty Corruption and Development. Dev. Pract. 9(1-2):189-193 |
|
|
Salem P (2006). The Impact of Corruption on Human Development in the Arab World: A Concept Paper. The Lebanese Transparency Association The Fares Foundation. Shah A, Mark S (2004), Combating Corruption: look Before You Leap", Finance and Development, December, 2004, Washington D.C.: World Bank. |
|
|
Syef A (2001). Corruption and development: a study of conflict. Dev. Pract. 11(5):597-605. |
|
|
Tanzi V (2006). Corruption and Economic Activity", ECES Distinguished Lecture Series 26, Cairo: The Egyptian Center for Economic Studies. |
|
|
Transparency International (2011). Corruption Perception Index. |
|
|
UNDP (2004). Anti-Corruption Practice Note. |
|
|
USAID (2005). USIAD Anticorruption Strategy, Washington D.C.: USAID. |
|
|
UNDP (2004), Anti-Corruption Practice Note. |
|
|
USAID (2005). USIAD Anticorruption Strategy, Washington D.C.: USAID, |
|
|
Wei SJ (1999). "Corruption in Economic Development: Beneficial Grease, Minor Annoyance, or Major Obstacle?", World Bank Policy Research Working Paper, No. 2048, (Washington: World Bank). |
|
|
World Bank (2000), Anticorruption in Transition: A Contribution To Policy Debate, Washington D.C. World Bank. |
|
|
World Bank (2000). Helping Countries Combat Corruption: Progress at the World Bank since 1997, Washington D.C.: World Bank. |
|
|
World Bank (2011). The Worldwide Governance Indicators (WGI) (1996 – 2010). |
|
|
World Bank (2011). World Development Indicators. |
|
Copyright © 2024 Author(s) retain the copyright of this article.
This article is published under the terms of the Creative Commons Attribution License 4.0


