ABSTRACT
The study seek to explore the extent and nature of trade and its growth over the period 2005 to 2013 between China and its five South Asian neighbours (Bangladesh, Bhutan, Pakistan, Sri Lanka, and Nepal). We measure the extent of trade by the trade intensity index and then check whether whole of this is explained by complementarity in the conventional sense. The study reveals that China’s trade intensity increased with all south Asian countries, thus confirming its greater presence in real terms. This in spite of the fact that trade complementarities between china with these economies have experienced decline over the period. This confirms the strong presence of factors apart from traditional comparative advantage perspective that have increased trade intensity. However, china’s import intensity with the region does not show a positive trend. As such china enjoys a trade surplus with these economies which in the long run may have many ramifications for these.
Key words: Trade intensity and complementarities, China and South Asia.
China strengthens its economic integration with the global economy as well as with neighbouring countries (South Asia). From the last few years, china has taken various positive steps and initiatives to enhance its economic relations with South Asian region. In 2006, China and Pakistan signed a Free Trade Agreement (FTA), Memorandum of Understanding (MoU) coupled with bilateral investment treaties (BIT) in order to increase trade and investment relations. Similarly, China has to a large extent increased economic relations with Bangladesh (Rahman, 2000) Bangladesh gives accessible exploration rights to China at Barakpuria and naval access to Chittagong port which brings china closer to the sea around India and to the oil fields in Myanmar (Aneja, 2006). In addition to this, China has also increased its relations with Sri Lanka, prior to few years, China gives infrastructural assistance to Sri Lanka which in turn has given an exploration block in the Manner Basin to China for exploration (Kumar, 2006a). China tries to improve its relations with Nepal. It has been investing in road infrastructure connecting the China-Nepal border, as is its case with Bhutan. By and large, China has been successful in enhancing economic ties with South Asian countries, in a bid to increase market size for its products and access to raw materials (Roy, 2000). These south Asian countries are also neighbours of India and all these are members of the South Asian Association for Regional Cooperation (SAARC). Despite their geographic continuity and proximity their economic relations, in terms of mutual trade and investment, fall significantly short of their potential.
India being an economic giant in the region could lead these countries in the direction of growth and development. However, its hegemony is perceived negatively rather than as an adviser or guardian (Taneja, 2004, 2001; Chaudhari, 2005; Aneja, 2006; Kumar, 2006b; Sengupta, 2007; Sahoo and Taneja, 2010). Unhealthy political scenario has led to high tariff and non-tariff barriers between India and its neighbours. This furnishes China an added opportunity to increase its economic relations with India’s neighbours in the South Asia In general, China has increased its trade relations with Pakistan, Bangladesh, Sri Lanka, Bhutan and Nepal, particularly in an effort to achieve better market for its exports (Agarwal and Sahoo, 2013). Nonetheless to say China has fascinated numerous sectors in these countries in the recent past. Besides increasing trade relations, China also offers huge amounts of assistance and aid, and has set up many important projects in these economies (Amighini et al., 2011). In this perspective, the study analyzes how China’s trade intensity with five South Asian countries (that is, Pakistan, Bangladesh, Sri Lanka, Bhutan and Nepal) changed over time from 2005 to 2013. To estimate increasing trade relations, trade intensity and complimentarity indices are employed.
MERCHANDISE TRADE BETWEEN INDIA AND SOUTH ASIAN COUNTRIES
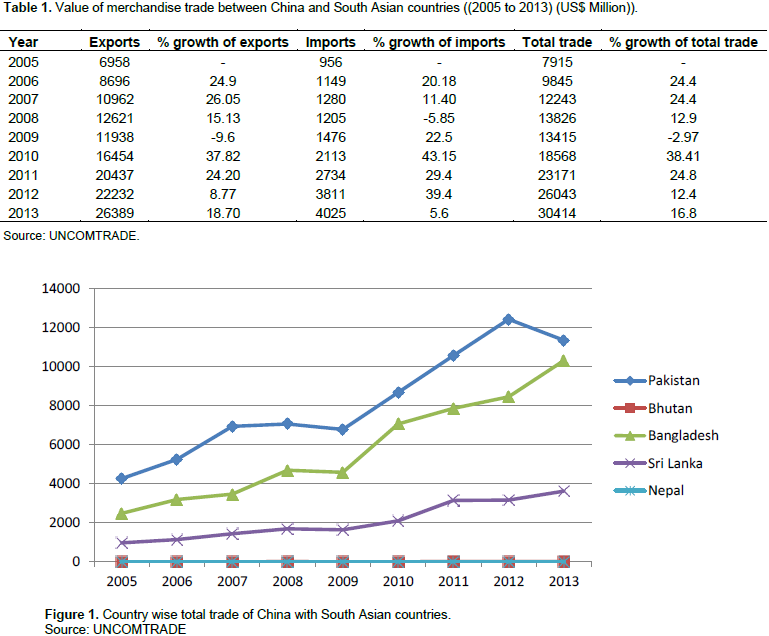
The value of merchandise trade between China and South Asian countries for the period from 2005 to 2013 has been presented in Table 1. China’s total trade with the South Asian region increased from US$ 7915 million in 2005 to US$ 13826 million in 2008, but due to recession total trade decreased to US$ 13415 million, while as percentage growth of total trade shows 24.4% in 2006 to 12.9% in 2008, but its percentage decreased to -9.6% in 2009 due to recession. However, after recession total trade also increased to US$ 18568 in 2010 to 30414 in 2013. The significant increase in the total trade was mainly due to the development of diplomatic and economic relation coupled with the signing of many trade agreements. China, however, experienced favourable trade balance, as its percentage growth of exports is higher than imports. Chinas total exports increased from US$ 6958 million in 2005 to US$ 12621 million in 2008 but fell to US$ 11938 million in 2009. Nevertheless, total exports of China to this region increased to US$ 16454 million in 2010 to US$ 26389 million in 2013. On the other hand, China’s imports from South Asian region have also registered a sustained rise from US$ 123 million in 2005 to US$ 198 million in 2008 to US$ 828 million in 2013 (Table 1). China’s total trade value for individual countries during 2005 to 2013 is presented in Figure 1. Among South Asian region, China’s major trading partner is Pakistan; China exported US$ 3427 million in 2005 to Pakistan which accounts for 49.5% share in this region. Gradually China’s exports to Pakistan increased from US$ 6051 million in 2008 to US$ 11019 million in 2013.

Similarly, among South Asian region China imports major portion from Pakistan, in 2005 Pakistan exported US$ 833 in 2005, which increased to US$ 2118 million in 2011 and US$ 3196 million in 2013. Like Pakistan, China exports a major portion to Bangladesh which accounted for US$ 2402 million in 2005, and it increased from US$6789 million in 2011 to US$ 9705 million in 2013. Bangladesh’s export to China is less as compared to import but it also shows an increasing trend, which accounts US$ 78 million in 2005, US$ 268 million in 2011 and US$ 602 million in 2013. The total trade line of Bangladesh shows an upward direction except in 2009. Sri Lanka is third largest trading partner of China in this region, China’s exports to this country increased from US$ 939 million in 2005 to US$ 1569 million in 2010 to US$ 3436 million in 2013. On the other hand imports from Sri Lanka for China increased from US$ 36 million in 2005 to US$ 182 million in 2013, followed by Nepal and Bhutan (Figure 1). That China’s economic dominance in the south Asian region is on the rise is clearly seen in the way its export to other countries is increasing. China’s export in total world exports to Bangladesh increased from 9.5% in 1992 to 25% in 2007, whereas India’s export share increased from 16.9% in 1992 to 21.8% in 2003, but it declined to 15.15% in 2007 (UNCOMTRADE). Similarly, Chinas exports have found significant acceleration since 2005 mainly due to the speeding up in economic cooperation between these two economies that led to a bilateral free trade agreement. Same is the case with Sri Lanka, Nepal and Bhutan; China’s exports are growing at a higher rate in several industries.
Apart from steadily improving trade relation with South Asian countries, China also keenly focuses on improving investment and developmental assistance to this region. It mainly invests through government owned enterprises, which also represents it policy stance towards this region. In this respect, it set up China Investment Corporation (CIC) in 2007 for abroad economic and trade relation. So for as Pakistan is concerned, it’s major inflow of foreign investment comes from China, which shows a rising trend after singing free trade agreement (FTA) in 2007. China has interest in trade and energy sectors of Pakistan, like investment on Gwadar port and Cheshma Nuclear Power Plant. In addition to this, China and Pakistan have designed equal point venture called Pakistan-China Investment Company Limited (PCICL). However, Chinese firms are also present in oil and gas, science and technology, telecommunication, power generations and infrastructural development. However, China is not investing comparably in Sri Lanka, even though providing finance to certain projects and grant in aid is rising fast. Same is the case for Nepal and Bhutan. By and large, China has firmly established itself in Pakistan and Bangladesh markets and is enhancing its trade relation with Sri Lanka, Bhutan and Nepal.
Trade intensity and complimentarity index
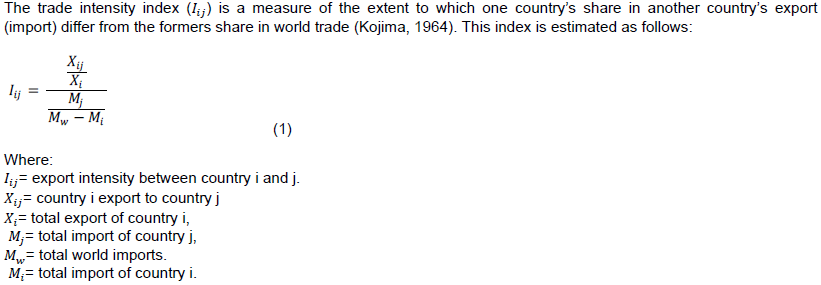
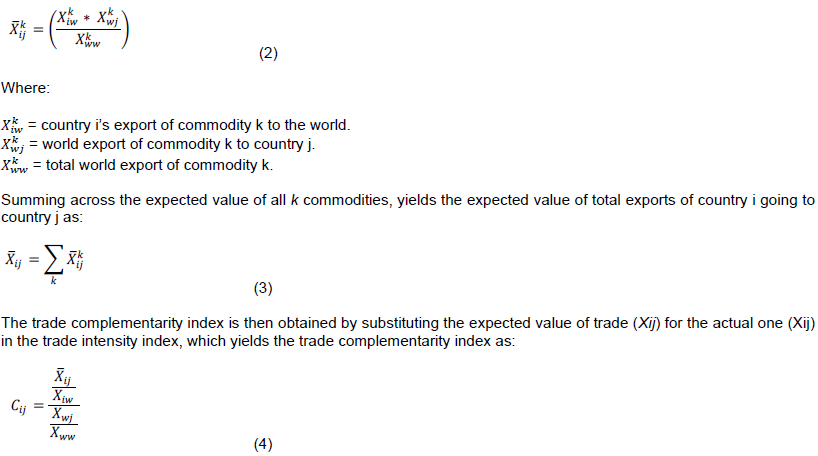
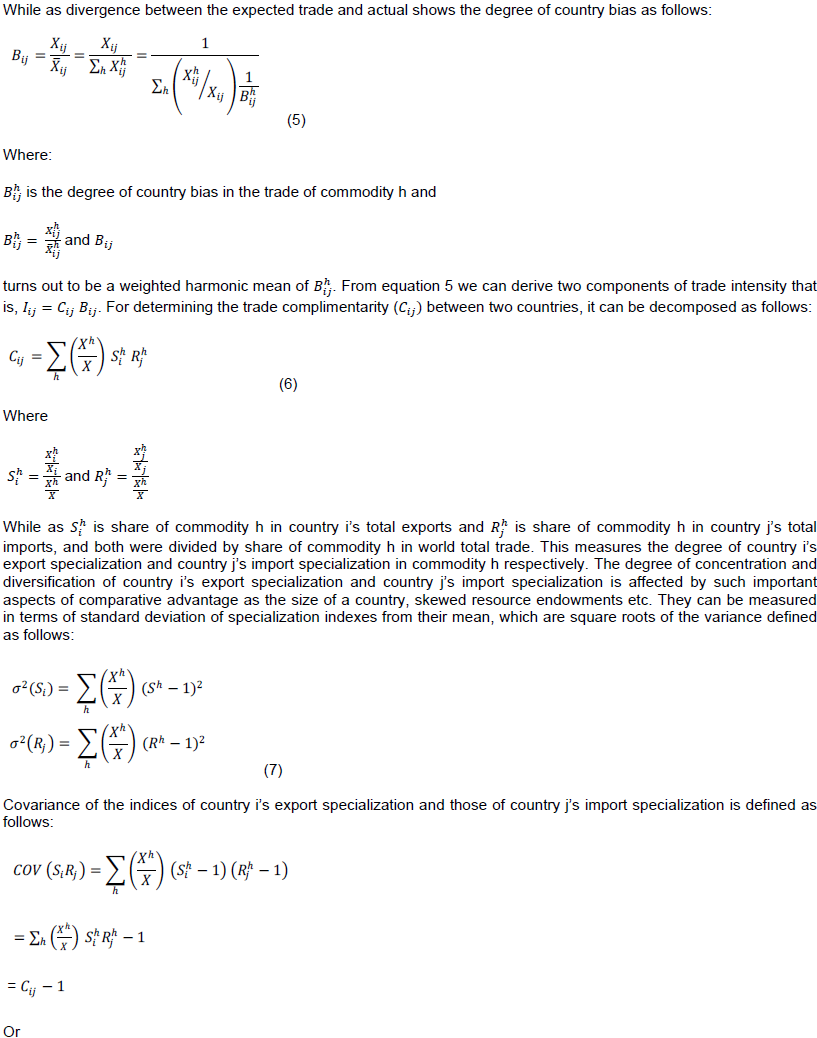
The trade intensity index has a range from zero to infinity. The value of this index of more (less) than unity, indicates that a country is exporting more (or less) to another country than what is expected from the country’s share in world trade. The trade intensity index can be decomposed into trade complimantarity index and country bias index in order to assess the contribution of complimentarity and other factors that influence intensity of trade. The complimentarity index measures the extent to which one country’s import pattern matches more closely than it matches that country’s import pattern for world imports. The country bias index measures the extent to which one country exports enjoy more or less favourable access to another country’s markets than might be expected from both countries share in world trade (Drysdale, 1969; Drysdale and Garnaut, 1994). While Yamazawa (1970) discussed that high trade intensity indicates strong complementarity in comparative advantage between trading partners and vice versa for low trade intensity. The trade intensity shows the degree of complementarity in comparative advantage in addition to this it enables us to identify trade determining factors and their overtime changes. It is expressed as follows:

Data sample
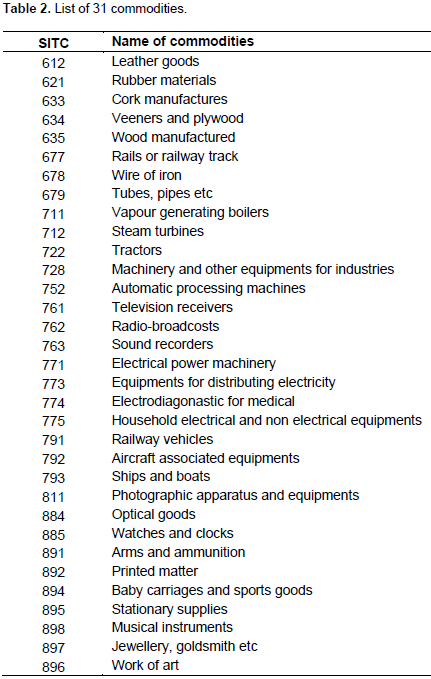
To estimate a trade intensity index, a trade complementarity index and a special country bias index between China and South Asian countries from 2005 to 2013 we include only Pakistan, Bangladesh, Bhutan, Sri Lanka, and Nepal. We include only 50 commodities at SITC 3-digit level as seen in Table 1. Data were obtained from UNCOMTRADE. The list selected commodities in which China has comparative advantage are presented in Table 2.
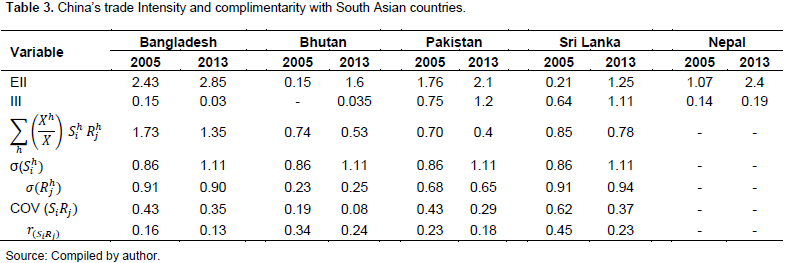
China’s trade intensity and trade complementarity with South Asian countries in the selected commodities for the period of 2005 and 2013 are shown in Table 3. But in this paper, we are able to measure only export and import intensity of Nepal because of non-availability of data on export and import of commodities.

Bangladesh
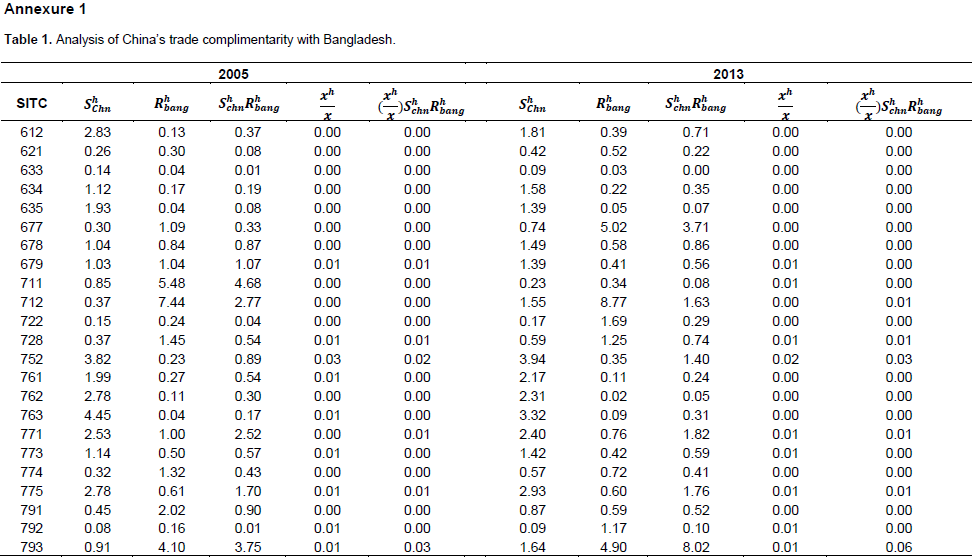
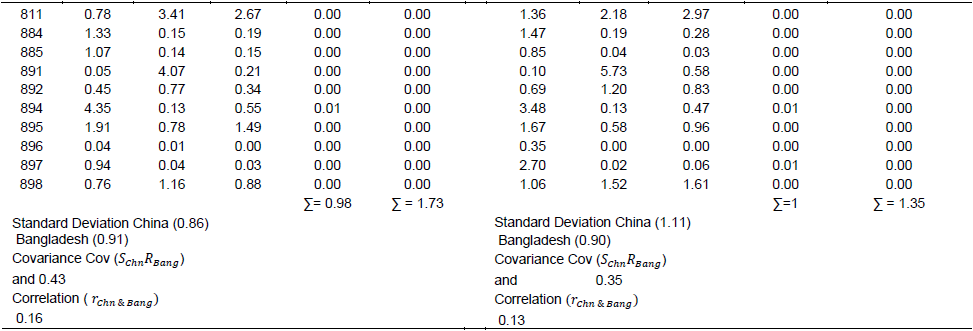
The result shows that China’s trade intensity with Bangladesh increased from 2.43 to 2.85 in 2005 and 2012 respectively. This indicates that Bangladesh became an important trading partner of China over the last years. This was mainly due to China’s trade complementarity with Bangladesh which falls from 1.73 in 2005 to 1.35 in 2013, which means that China’s export structure and Bangladesh import structure became less complementarity with each other. In Annexure A, table 1 shows that the standard deviation of China’s export of commodities to total export increases from 0.86 in 2005 to 1.11 in 2013 this means China’s export specialization became more concentrated over the period. While as standard deviation of Bangladesh’s import of commodities to total import also remain to some extent the same at 0.90 or 0.91, this shows that Bangladesh’s import specialization was not concentrated over time period. China’s export specialization and Bangladesh’s import specialization were positively related at 0.43 in 2005, and 0.35 in 2013 which means that China’s export structure and Bangladesh’s import structure are not complementarity with each other, and value of covariance decreases means that they became less complementarity. The correlation coefficient between china’s export specialization and Bangladesh’s import specialization structure measures the degree of match of the two patterns neutral from the degree of concentration or diversification, which decreased from 0.16 in 2005 to 0.13 in 2013. This means that China’s export structure and Bangladesh’s import structure becomes less complementary with each other.
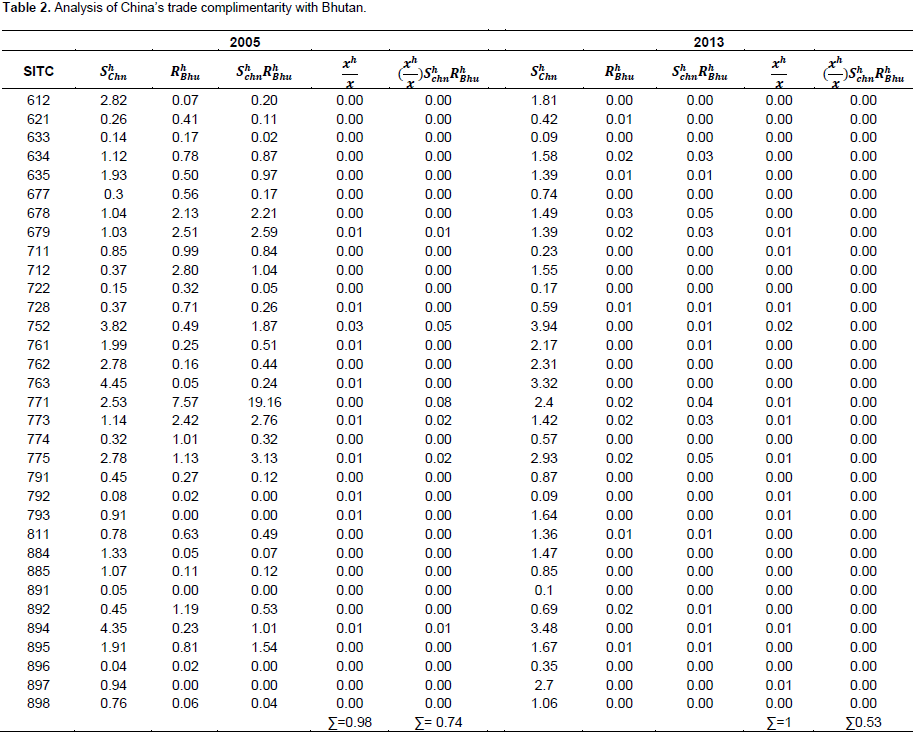
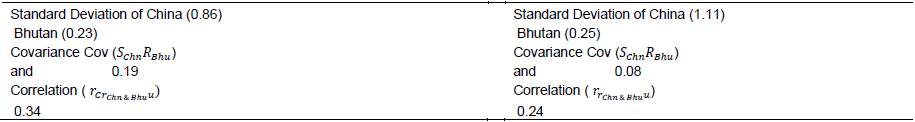
Bhutan
Trade intensity increased through the period of study from 0.15 in 2005 to 1.6 in 2013. Like Bangladesh, Bhutan’s significance as China’s trading partner increased. Though not as important as Bangladesh, Bhutan velocity of improvement in the concerned period is definitely more than the former. While as Bangladesh showed an improvement of 0.42 points from 2.43 to 2.85, the same in case of Bhutan was 1.45 points. Thus, Bhutan made better progress in improving its trading partner status both in absolute as well as relatives perspectives. In terms of improvement of trade status with china, Bhutan leads the group of SAARC countries for the period of study. Bhutan’s trade complementarities show a declining trend through the period from 0.74 in 2005 to 0.53 in 2013. Like Bangladesh, the trade complementarity declined in spite of an overall increase in trade intensity. This represents the impact of factors apart from comparative advantage in the conventional sense. In Annexure A, table 2 shows that the standard deviation of china’s export commodity h to total export increased from 0.86 in 2005 to 1.11 in 2013. This shows an improved concentration of china’s export specialization over the period of time. Contrary to Bangladesh’s slight decrease in concentration of import specialization, Bhutan makes a slight improvement from 0.23 in 2005 to 0.25 in 2013 in the same. The value of the extent of China’s export specialization and Bhutan’s import specialization is given by value of the covariance of the respective specializations. The covariance decreased from 0.19 in 2005 to 0.08 in 2013. This indicates a decline in export-import complementarity between the two countries. This declining trend in complementarity is also exhibited by the correlation.
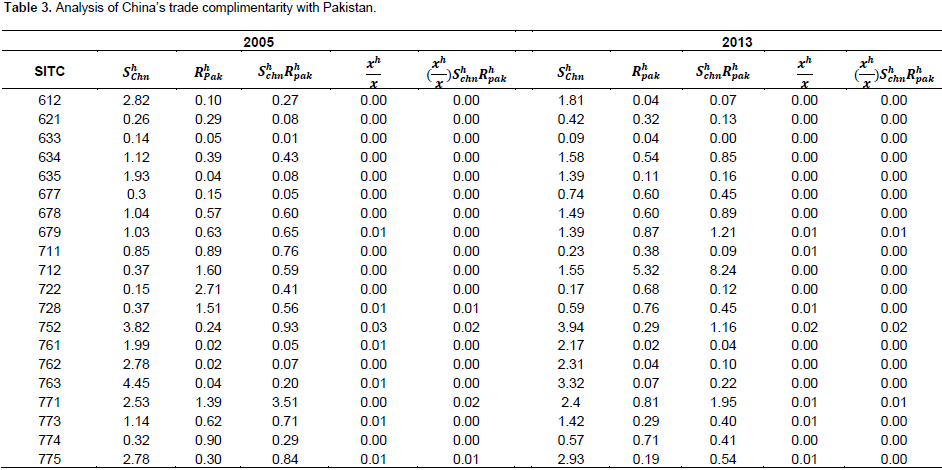
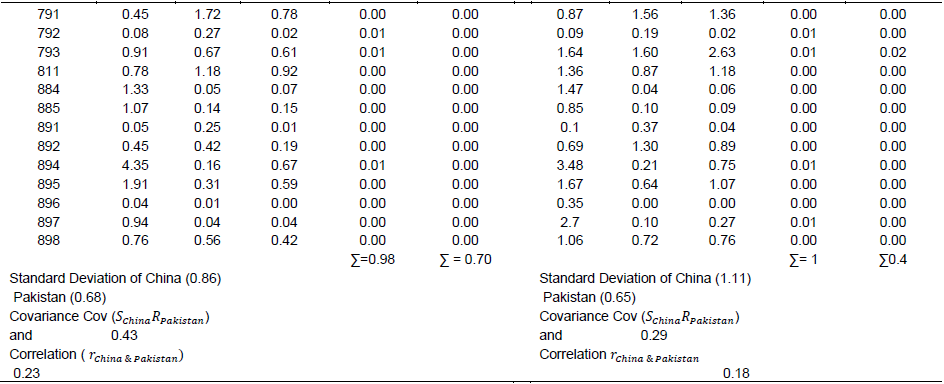
Pakistan
Trade intensity increased through the period of study from 1.76 in 2005 to 2.1 in 2013. Like the former two countries, Pakistan’s significance as China’s trading partner increased. Like Bangladesh and Bhutan, Pakistan’s trade complementarities show a declining trend through the period from 0.70 in 2005 to 0.4 in 2013, this is in spite of the fact that an overall increase in trade intensity occurred. As discussed earlier, this represents the impact of factors apart from conventional comparative advantage. In Annexure A, table 3 shows that the standard deviation of China’s export commodity h to total export increased by the same amount as in the case of other countries that is, from 0.86 in 2005 to 1.11 in 2013. This represents an improved concentration of China’s export specialization over the period of time. Like Bangladesh’s slight decrease in concentration of import specialization, and unlike Bhutan’s slight improvement, Pakistan records a decrease from 0.68 in 2005 to 0.65 in 2013. The values of covariance of the respective specializations give the extent of china’s export specialization and Pakistan’s import specialization. This decreased from 0.43 to 0.29 from the beginning to the end of the period. This indicates a decline in export-import complementarity between the two countries. This declining trend in complementarity is also exhibited by the correlation.

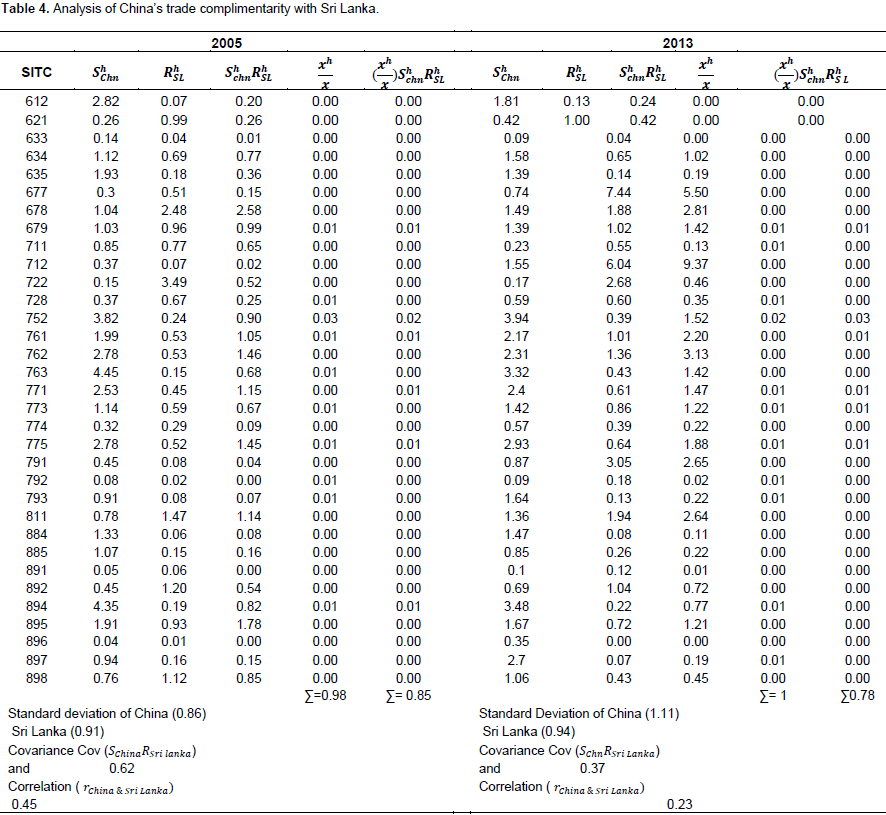
Sri Lanka
Trade intensity significantly increased through the period of the study from 0.21 in 2005 to 1.25 in 2013. Thus, Sri Lanka’s importance as china’s trading partner increased. In terms of the velocity of improvement in trade intensity, Sri Lanka is outpaced only by Bhutan. Despite speedy improvement, both of these have smaller trade intensities compared to Bangladesh, Sri Lanka and Nepal. Sri Lanka’s trade complementarities like the first three countries also show a declining trend through the period from 0.85 in 2005 to 0.78 in 2013. Among the group, however, Sri Lanka experienced least decrease in trade complementarity. Also in terms of this index, Sri Lanka fares better than all countries for which values are derived apart from Bangladesh. The role of other factors apart from complementarity in increasing trade intensity is obvious as in case of other economics. Improved concentration of china’s export specialization over the period is obvious from the values of standard deviation. In Annexure A, table 4 shows that the standard deviation of china’s export commodity h to total export increased from 0.86 in 2005 to 1.11 in 2013. The value of the extent of China’s export specialization and Sri Lanka’s import specialization is given by value of the covariance of the respective specializations. The covariance decreased from 0.62 in 2005 to 0.37 in 2013. This indicates a decline in export-import complementarity between the two countries. This declining trend in complementarity is also exhibited by the correlation.

Factors for China’s growing presence in South Asia
Reasons for increase in China’s trade intensity with selected south Asian economies fall within the domains of economy, polity and external sector policy as enumerated below:
Four factors make china’s products relatively cheaper to be at advantage on international market including developing countries. The first of these is a technology that on the one hand is relatively superior to its counterparts in the developing world and on the other has a mass spread. While as the former gives china an edge on the technological front the latter makes the technology accessible to its mammoth population as a whole. The level and the spread of technology play an important role in relative better performance of china in the long run. The former helps it to compete with countries with capital intensive technological policy; the latter makes it even capable of outpacing countries using labour intensive technology. It is this great balancing in technological state, that helps china grow with great momentum. This high capital firms in this way are able to progressively develop better technology and the masses are adapted to use new and improved versions with relative comfort and consistency. This not only secures for china a benchmark technology on current international market but even positions it for even better future. Unless severe global economic tumults or some unimagined domestic crisis fracture China’s momentum, this spontaneous snowballing of technological momentum seem to sail it at better velocity in the coming decades. Second is cheap labour, China’s strength also lies in its formerly assumed weakness, or at least a central indicator, in development economics, that is, large population. The simple interplay of dynamics of supply and demand of labour in a population rich country obviously result in low wages in its factor market.
Both this and relatively better productivity in the backdrop of reasonably superior technology keep the masses busy in the production process. The actual and the prospective firms, both domestic and foreign, are attracted to china’s production process partly because of cheap labour in comparison to wages in countries at the same level of technology and output. The resultant use of labour not only leads to higher production but also helps creating necessary market for this output. As a result, the output produced with the use of cheap labour has an assured cost advantage given the state of technology of the country. Thus here again, like in the former case, china enjoys two pronged advantage over its adversaries on the international market. The more technologically advanced countries’ products are at disadvantage because of cost effective Chinese products because of cheap labour. Thus china’s technological deficit is more than made up for by its cheap labour. On the other hand, countries with wages similar or lower compared to china also themselves at disadvantage because of china’s superior technology. Thus where china has a wage burden its technology brings gains for it. Third high level of specialization, over the period of time china has made stupendous progress in not only producing complete products but even where it enjoyed advantage only in part of the product. Since more and more firms are concentrating either on specific products or specific parts of different products, these continue to enjoy improved dexterity and excellence in production.
The efficiency of both overall production and labour at each stage of production continues to rise incrementally. The fourth is the advantages of economies of scale also accrue to the firms producing in bulk. These include pecuniary as well as real economies of scale. Moreover, China is carefully managing its political relations and trying to avoid any larger pitfalls with most of the countries including its neighbours. The economic success it has been able to achieve would simply be impossible in the presence of active political conflicts. China has been successful in keeping its economic interests and political reservation in balance. It has held itself back from any sort of active conflict in the region. On the contrary it has attempted to and largely been successful in deliberately fostering better relations with all of its neighbours in the region by signing different agreements and pacts as discussed in the beginning. Additionally, Chinas designed emphasis on export led growth makes its firms to concentrate on markets and needs of other countries. This focused approach includes the development of Special Economic Zones which played a leading and dynamic role in the export capability in china.
In the past few decades, China has put up lots of measures to improve its competitiveness in the international market. Complementing this, the diplomatic efforts it has made in South Asian region has led to a surge in its trade in the region. It has successfully managed to prop up different pacts and agreements as well as investments aimed at closer economic ties with its neighbours. As a result merchandise trade between China and SAARC increased manifold in the past decades. In this paper, we analysed china’s commercial relations with specific south Asian countries, by employing trade intensity index and trade complementary index for the period 2005 to 2013 on the basis of 50 commodities. The important results emerging from the study include that despite a general reduction in trade complementarities, trade intensity between China and its south Asian neighbours namely Pakistan, Bhutan, Sri Lanka, and Nepal, has increased. This overall better performance can be attributed to many factors within different domains interacting to create such a possibility. These include economic factors like better technology, relatively cheap labour, specialization and economies of scale. There are additional but no way less significant factors of better diplomacy intended at better trade environment as well as an active export policy working towards the same end.
The authors have not declared any conflict of interests.
REFERENCES
|
Agarwal P, Sahoo P (2003). China's Accession to WTO: Implication for China and India, Econ. Polit. Wkly. 38:2544-2551. |
|
|
|
Amighini A, Rabellotti R, Sanfilippo M (2011). China's Outward FDI: An Industry-Level Analysis of Host Country Determinants. CESIFO working paper, Empirical and Theoretical Methods. |
|
|
Drysdal P (1969). Japan, Australia, New Zealand: The Prospect for Western pacific Economic Integration, Econ. Rec. 45(11):321-342.
Crossref |
|
|
|
Garnaut R, Drysdale P (1994). Trade intensities and the analysis of bilateral trade flows in a many-country world: A survey in Asia-Pacific Regionalism, Reading in International Economic Relation. |
|
|
|
Kojima K (1964). The Pattern of International Trade Among Advanced Countries, Hitotsubshi J. Econ. 5(1). |
|
|
|
Kumar A (2006a). China-Pakistan Economic Relation, Institute of Peace and Conflict Studies, special report New Delhi. P 30. |
|
|
|
Kumar A (2006b). China's Growing Influence in Sri Lanka: Implication for India. Institute of Peace and Conflict Studies, IPCS Article. P 30, New Delhi. |
|
|
|
Rahman M (2000). Bangladesh-India bilateral trade, an investigation into trade in services. Paper prepared for the South Asia Network of Economic Research Institute (SANEI) Study Programme. |
|
|
|
Roy C, Chakraborty D (2000). Location of comparative advanateg in India and Bangladesh. J. Appl. Input-Output Anal. 6:17-35. |
|
|
|
Sahoo P, Taneja N (2010). February 5. China's growing presence in India's neighbourhood. In East Asia Forum 2010. |
|
|
Sahoo P (2013). The Growing Dominance of China in South Asia: An Indian Perspective. Int. Trade. J. 27:111-141.
Crossref |
|
|
|
Sengupta J (2007). Time to Boost India-Bangladesh Trade and Economic Relation. Observer Research Foundation, Policy Issue Brief, August. |
|
|
|
Taneja N (2004). India-Pakistan: Trade Relations: Opportunities for Growth. Econ. Polit. Wkly. 39:326-327. |
|
|
|
Taneja N (2001). Informal Trade in SAARC Region, Economic and Political Weekly, 17 March. |
|
|
|
Yamazawa I (1970). Intensity Analysis of World Trade Flow, Hitotsubashi J. Econ. 10(2):61-90. |