ABSTRACT
This study aimed to determine the threshold level of public external debt-to-GDP ratio for Guinea and compared it with the current evolution of public debt. The authors used an autoregressive distributed lag (ARDL) approach to test the hypothesis of long-term relationship among the variables of interest and the data used ranged from 1990 to 2018. The results revealed that External debt-to-GDP ratio and per capita GDP are positively related. Moreover, the null hypothesis of no co-integration was rejected. Thus, external debt-to-GDP ratio and economic growth as well as other variables are co-integrated. Moreover, the debt variable had significant non-linear effects on economic growth and indicated that there exists an optimal level of external debt-to-GDP ratio that stood at 25.2%. Compared to its current level which stood at 21.7%, the country still has some borrowing margin. In the short run external debt-to-GDP ratio has no significant effect on the country’s economic performance.
Key words: External debt, Economic growth, autoregressive distributed lag (ARDL), Guinea.
The problem of external public debt emerged in most developing countries during the 1970s and in the early 1980s for Africa. With an external debt of $337.2 billion (1999), Africa is the most indebted continent in relation to its gross national product (GNP). This situation can be explained by the ease with which African countries were able to borrow money in the late 1970s and early 1980s, but also by the duration of the global economic crisis and the fall in the prices of raw materials and agricultural products. In addition, external debt has often impacted the economy of over-indebted countries by taking away from the state budget resources necessary for the proper functioning of public administrations and services thereby reducing the country’s capacity for investment, etc. It can also lead to an increased need for additional resources and hence a need for more borrowing. Faced with macroeconomic and financial imbalances in their economies, governments have often resorted to external borrowing to rebalance their external and internal deficits. The idea that debt servicing negatively affects the economy of poor countries has been the subject of sustained discussions within international institutions. This could explain why numerous programs aimed at relieving debt were put in place that is, the HIPC (Highly Indebted Poor Country) initiative. Indeed, many countries, including Guinea, were facing economic difficulties due to the large share of their GDP that they were allocating to debt service. Thus, the country embarked on a borrowing spray both internally and externally (International Monetary Fund, 2017). These borrowings undoubtedly affected the country’s public finances.
Indeed, between the year 2000 and 2005, Guinea's external debt stock rose from US$ 3 billion to US$ 3.4 billion (World Bank, 2020). In 2011, the country’s external debt stood at US$ 3.4 billion. It dropped to US$ 1.56 billion in 2012 in line with the HIPC initiative, representing a 54.66% reduction of the country’s external debt. Notwithstanding this, the country’s external debt kept rising steadily. By 2018, the country’s external debt has reached another peak. Indeed, it stood at US 2.55 billion (World Bank, 2020). This represented a 63.88% increase in a six years period. The current observation is that Guinea's external debt is still on an upward sloping trend. Thus, in order to avoid falling back into the cycle of debt overhang with its adverse effects on both economic growth and fiscal sustainability, the mobilization of foreign resources should be carried out in a prudent manner, taking into account the costs and risks associated with these resources. It is in line with the above that, this study seeks to provide a better understanding of the following issues:
1. How did the country’s public debt and its components evolved from 1990 to 2018?
2. What could be the short- and long-term impact of the country’s rising external debt on economic growth?
3. Whether there is a critical threshold for Guinea's external debt?
The overall objective of this study is therefore to provide a better understanding of the impact of external debt on Guinea's economy. More specifically, the study seeks to: determine the short and long term impact of the country’s external debt on its economic growth; determine the optimal threshold for Guinea's external debt. In addition to the above objectives, the following hypotheses will be tested: external debt has a positive impact on Guinea’s economic growth in both the short and long run; and Guinea's optimal external debt-to-GDP ratio is below the current level of external debt which stood at 21.7%.
Stylized facts
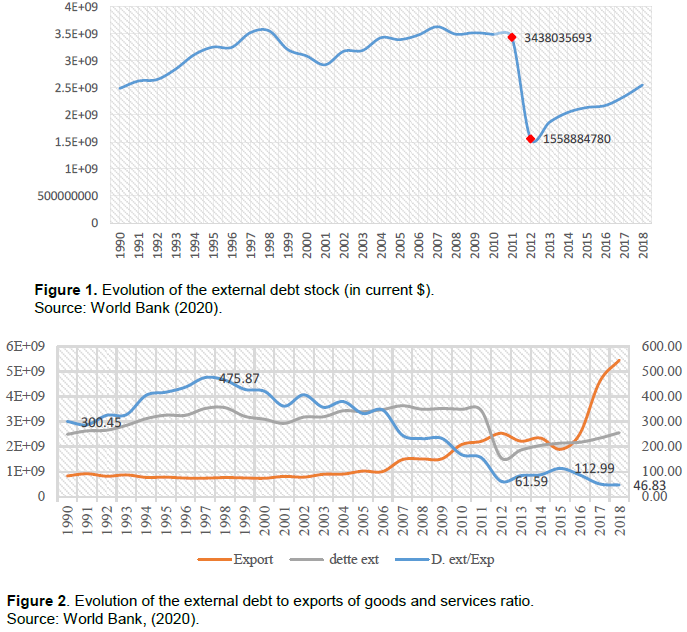
As countries seek ways to ensure macroeconomic stability and mobilize resources for the financing of major development projects they resort to debt. However, in many instances, public debt has a number of limitations that should not be overlooked. Indeed, poor management of public debt can lead to a number of difficulties that can be very unfavorable to the proper functioning of the economy. In Guinea, the increase in external debt in recent years could be explained by the implementation of several major economic and social development projects. Thus, a descriptive analysis of external debt, as well as its relationship with certain key macroeconomic variables, should provide a better understanding. From Figure 1, Guinea's external debt increased from US$ 2.489 billion to US$ 3.555 billion between 1990 and 1998, an increase of 42.82%. However, over the period of 1998 to 2008, Guinea's external debt showed a moderate evolution, with light fluctuations.
The year 2012 was marked by a sharp drop of the country’s external debt, this was mainly attributable to the cancellation of debt resulting from the implementation of the Heavily Indebted Poor Countries Initiative (HIPC), that is, a cancellation of more than US$ 2 billion. From 2012 to 2018, the stock of external debt rose from USD 1.558 billion to USD 2.554 billion, an increase of 63.88%. This increase can be explained by the State's investments in the mining and infrastructure sectors. When considering the external debt-to – export ratio, it is observed that the trend was upward sloping in the early 90s (Figure 2). Indeed, it rose from 300.45% in 1990 to 475.87% in 1997 representing a 58.36% rise. From 1997, the trend has been downward sloping till 2012 although not steadily. In 2012 the external debt-to- exports ratio stood at 61.59%. Unfortunately this downward trend was halted in the period ranging from 2013 to 2015 where it reached 112.99%. Thereafter, it dropped to reach its lowest level in 2018 where it stood at 46.83% representing a 58.55% decrease in less than five years (World Bank, 2020).
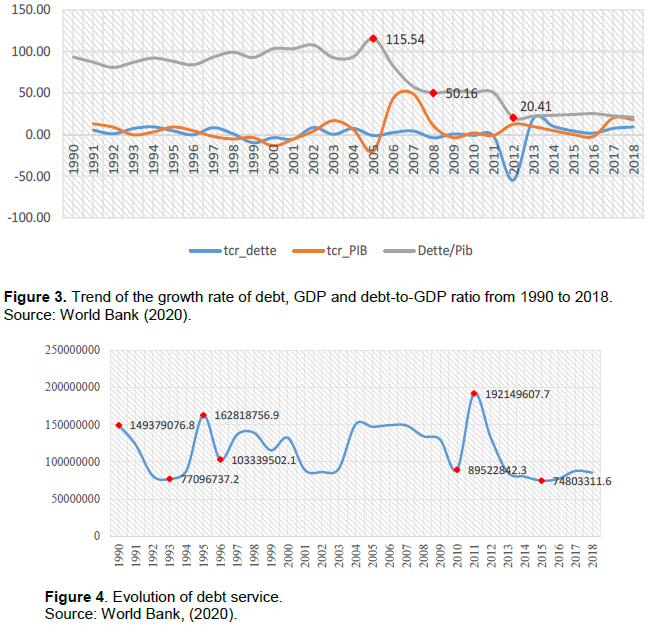
In Figure 3, it is observed that the growth rate of the economy and that of the external debt evolved together but with different amplitudes. Indeed, between 1990 and 2018, the outstanding external debt has grown by an average of 1.17%. As for the economic growth rate, it has evolved on average by 6.45% over the same period. Over the period 1990 to 2004, the external debt/GDP ratio was almost stable with an average growth rate of 2.61%. From 2005 to 2012, there was a clear decline in the external debt to GDP ratio. Indeed, it fell from 115.54% in 2005 to 50.16 in 2008 and then to its lowest level in 2012 at 20.41%. This later one has to do with the HIPC initiative. From 2012, the external debt to GDP ratio evolved around 21% (World Bank, 2020).
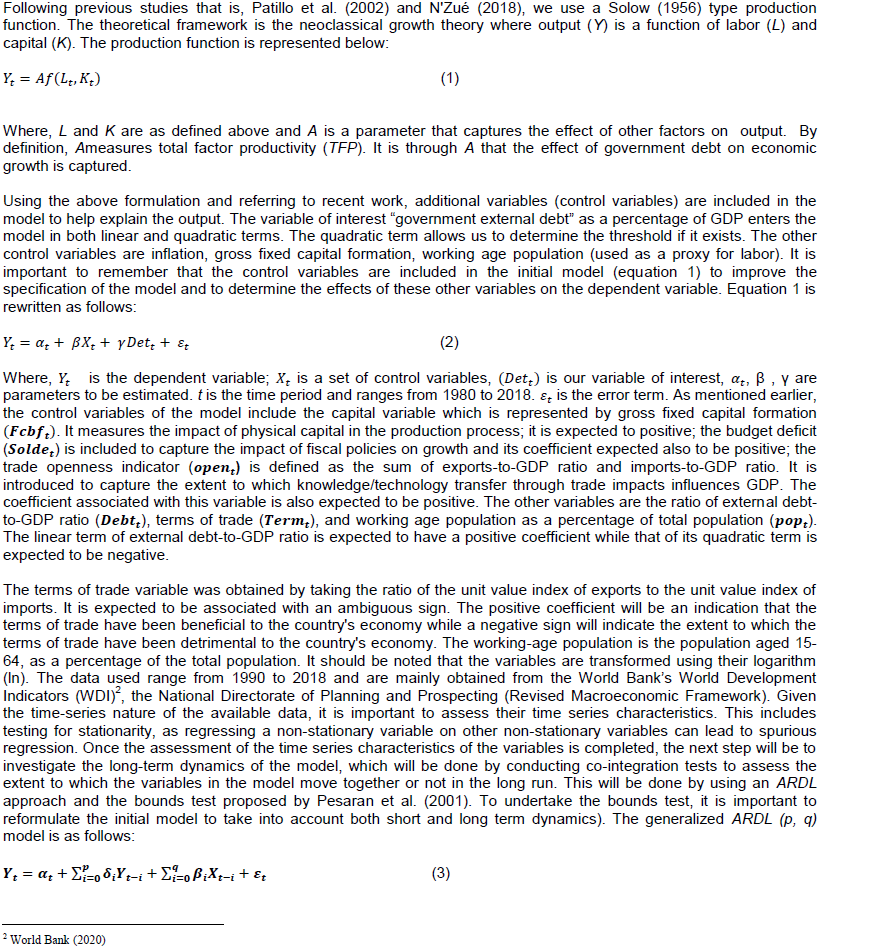
The trend of the country’s debt service is presented in Figure 4. It is observed that it declined until 1992. Then it rose from 1993 to 1995 before another decline in 1996. Broadly speaking was neither steady nor stable throughout the period of analysis. However, from 2011, a downward trend is observed. This last situation is attributable to the cancellation of a large part of the external debt through the Heavily Indebted Poor Countries Initiative (HIPC).
Le Programme d’Investissement Publique / Guinée 2019 (PIP)
A review of selected literature is undertaken in this study. It starts with a brief theoretical review followed by a selected empirical studies review on the link between public debt and economic growth.
Theoretical review
The debate between economic growth and debt is relatively old, one of the pioneers being Cairnes (1874), and owes its revival to endogenous growth theories. Since the 1980s, two schools of thoughts have been clashing over the theory of growth and public debt, namely the Keynesians and the neoclassicals. For the Keynesians, the main idea is that debt does not cause burdens for current and future generations, because of the investments it generates. From this approach, debt stimulates demand, and the accelerating effect of an increase in investment leads to an increase in production. According to Clements et al. (2004), external debt has the potential to stimulate economic growth, provided that it is used to finance investment. For these authors, it is necessary to have a measure of debt, because there is a certain threshold beyond which debt negatively influences economic growth. Indeed, when the return on capital is declining, the benefits of any new investment on economic growth could diminish as the debt increases. This theory gives rise to a "Laffer Curve" relationship between external debt on the one hand and per capita income growth on the other. For the neoclassicals, debt is considered as a future tax and attributes it to the state. According to this school of thought, public debt has a negative effect on the accumulation of capital and the consumption of future and present generations. According to Sargent (1981), a sustainable debt leads to a growth rate higher than the real interest rate on bonds. Thus, government revenues grow faster than interest on the debt, based on the assumption of a unitary elasticity between the budget balance and economic activity. Krugman (1988) and Sachs (1989) predict that a high debt is harmful to economic growth, since it discourages investment. For these authors, when debt exceeds a country's internal resources, the country may no longer be able to repay past loans, which will have a dissuasive effect on potential creditors and investors thus, it hinders economic growth. Moreover, Barro's (1990) model attributed a very important role to productive public spending (for instance public spending on infrastructure) in the process of long-run economic growth. According to the author, debt is neither a wealth for the current generation or a bridge between generations because of the agents' anticipation of future taxes. Thus, part of the debt will be transferred to the future generation (tax debt) and the other part will be compensated by public securities. This is why substituting borrowing for taxation does not necessarily lead to growth. In matters of fiscal policy, public debt is a key factor in analyzing government's room for maneuver in its spending.
Empirical review
Several studies have tackled the issue of the optimal level of external debt to GDP ratio. However, there is no consensus on the threshold to be considered. This could be explained by the peculiarities of countries and their specific needs. This study therefore reviews couple of selected empirical studies including Greenidge et al. (2012), Mencinger et al. (2014), Faye and Thiam (2015), Wade (2015), Omotosho et al. (2016), Adeniyi et al. (2018), N’Zué (2018), Mary et al. (2019), Ehikioya et al. (2020), and Aziz and N’Zué (2020) just to cite a few. Greenidge et al. (2012) studied the threshold effects between public debt and economic growth in the Caribbean. Their study confirmed the existence of a debt to gross domestic product (GDP) threshold of 55-56%. They also found that debt dynamics began to change well before this threshold was reached. Specifically, at debt levels below 30% of GDP, increases in the debt-to-GDP ratio are associated with faster economic growth. However, as debt rises above 30%, the effects on economic growth decline rapidly and at debt levels reaching 55-56% of GDP, the impacts on growth shift from positive to negative. Thus, beyond this threshold, debt becomes a drag on growth. Mencinger et al. (2014) studied the direct effect of higher debt on economic growth for 25 EU countries. Their sample of EU countries was divided into subgroups to distinguish between "old" member states, over the period 1980-2010, and "new" member states, covering the period from 1995 to 2010. Using a panel estimation method, they confirmed the existence of a non-linear relationship between the ratios of government debt to GDP per capita. They also found that the threshold for the debt-to-GDP ratio should be approximately between 80 and 90% for the "old" member states. Yet, for the "new" member states, the threshold for the debt-to-GDP ratio is lower and was between 53 and 54%.
Faye and Thiam (2015) use a nested generation’s model to study the effect of public debt on consumption, GDP, savings, budgetary revenues, investment, and capital dynamics in Senegal. The results show that a 10% increase in public debt positively affects macroeconomic variables but worsens the current account deficit. To be effective, a public debt of at least 65% of GDP should be integrated into the capital accumulation process. A 10% increase in external debt has a positive impact on macroeconomic variables, but worsens the current account deficit. A 10% increase in domestic debt leads to a recession. An increase in debt-financed public spending leads to an increase in the public debt bequeathed to future generations by 15% and an increase in future consumption by about 2%. As for Wade (2015), the author estimated the impact of total public debt-to- GDP ratio on the growth rate of GDP per capita with a PSTR (Panel Smooth Transition Regression Model) and the Generalized Method of Moments (GMM) method. The study covered the eight (8) WAEMU countries over a period ranging from 1980 to 2011. The results obtained with the GMM method indicated that the optimal public debt threshold stood at 48.8% of GDP, while for the PSTR the threshold stood at 49.8% of GDP. Omotosho et al. (2016) investigated the existence of threshold effects in the relationship between public debt and economic growth in Nigeria using quarterly data.
They found empirical support for an inverted U-shape relationship between public debt types and economic growth. For total public debt as percentage of GDP, the threshold level stood at 73.70%. Adeniyi et al. (2018) investigated the possible role of domestic investment in the non-linear relation between external debt and economic growth in Nigeria over the period from 1981 to 2015 using threshold regression analysis. They found that the impact of external debt on economic growth is sensitive to the measures of external debt used, and whether or not the role of domestic investment is accounted for. Accounting for the role of domestic investment in the non-linear relation between external debt and economic growth reduces the optimal debt carrying capacity of the country. Moreover, the study provided support to the crowding-out effect of excessive external debt servicing. They therefore suggested that the Nigerian government internalizes a maximum ceiling of 6.81% as the share of external debt stock in gross national income (GNI) so as to enjoy the resulting growth benefits.
N'Zué (2018), using the model of Patillo et al. (2002) with data ranging from 1970 to 2015, studied the link between external debt and growth in Côte d'Ivoire. He estimated a critical threshold of 42.9% beyond which external debt accumulation will have a negative impact on growth. Mary et al. (2019) examined the optimal point beyond which government debt impairs economic performance in Nigeria. Data from the Central Bank of Nigeria Statistical Bulletin from 1986 to 2017 were used. Dynamic Ordinary Least Square estimation method was applied. They found a significant relationship between government debt and Nigeria’s economic performance. Government debt is growth-enhancing at low levels but growth-retarding at a high level with the optimal government debt estimated as 9.98% of the gross domestic product implying that borrowing beyond such a limit becomes growth retarding in the economy. Thus, government should focus on other sources of revenue to fund its budget deficits to decrease the debt burden. Aziz and N'Zué (2020), revisited the above study by using an ARDL method with data covering the period ranging from 1980 to 2018, they estimated the external debt to GDP ratio threshold to be at 59.53%. The rate beyond which debt accumulation will have a negative impact on growth.
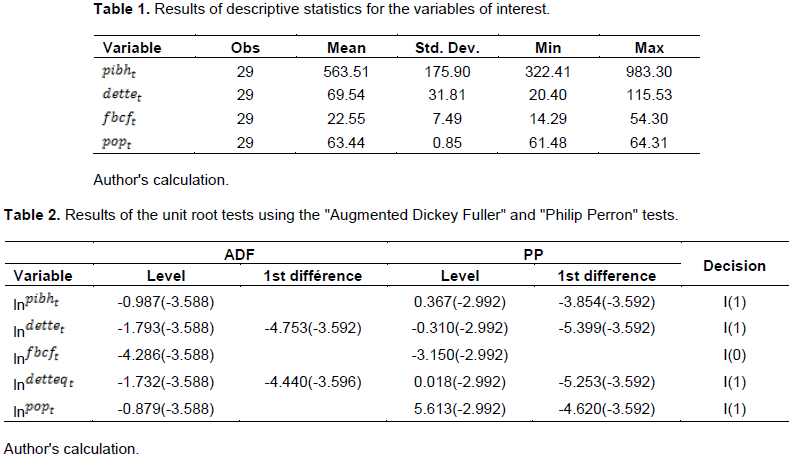
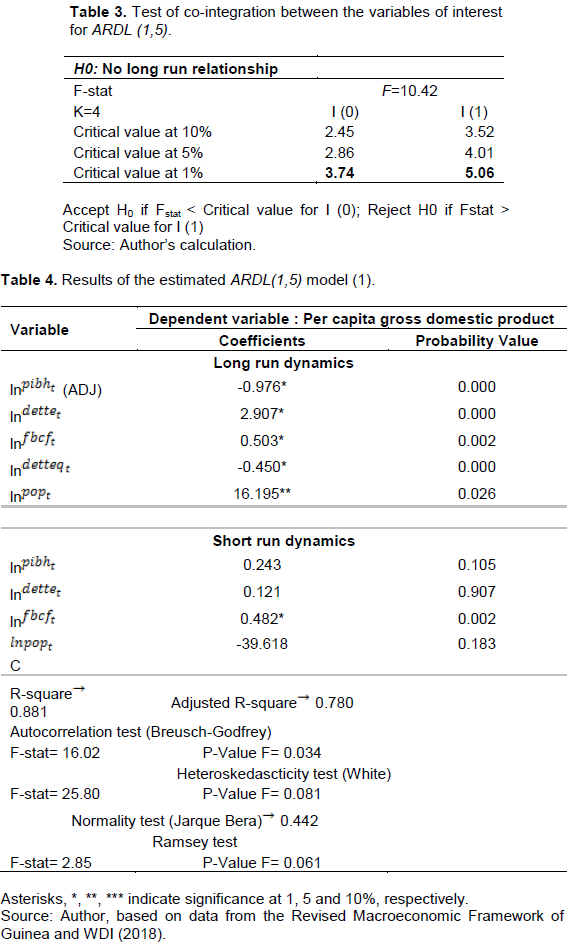
This section presents and discusses the empirical results. It begins with the descriptive statistics presented in Table 1. It can be observed that, on average, gross fixed capital formation is very high in Guinea. Indeed, it was 22.55% and above the ECOWAS regional threshold of 20% On average, the minimum debt-to-GDP ratio was 20.41% and was recorded in 2012 after the country benefited from the Heavily Indebted Poor Countries (HIPC) initiative. The highest debt-to-GDP ratio (115.54%) was recorded in 2005. The time series characteristics of the variables were analyzed (Table 2). The results show that with the exception of the variable gross fixed capital formation which is integrated of order 0, that is I (0), all other variables are integrated of order 1, that is I(1). The above results, show a mixture of I(0) and I(1) variables confirming the use of the ARDL (p, q) approach. The results of the bounds tests are presented in Table 3. The F-statistic is compared to the critical bound test values tabulated by Pesaran et al. (2001) without restriction on the constant and trend. The null hypothesis of the test is that there is no co-integrating relationship versus the alternative hypothesis of a co-integrating relationship. The value of the F-statistic calculated is 10.42. It is greater than all of the critical values considered, namely 1%, 5% and 10%. The null hypothesis of no co-integration cannot be accepted. It is therefore concluded that there is a co-integration relationship between the variables, which means that they move together in the long run.
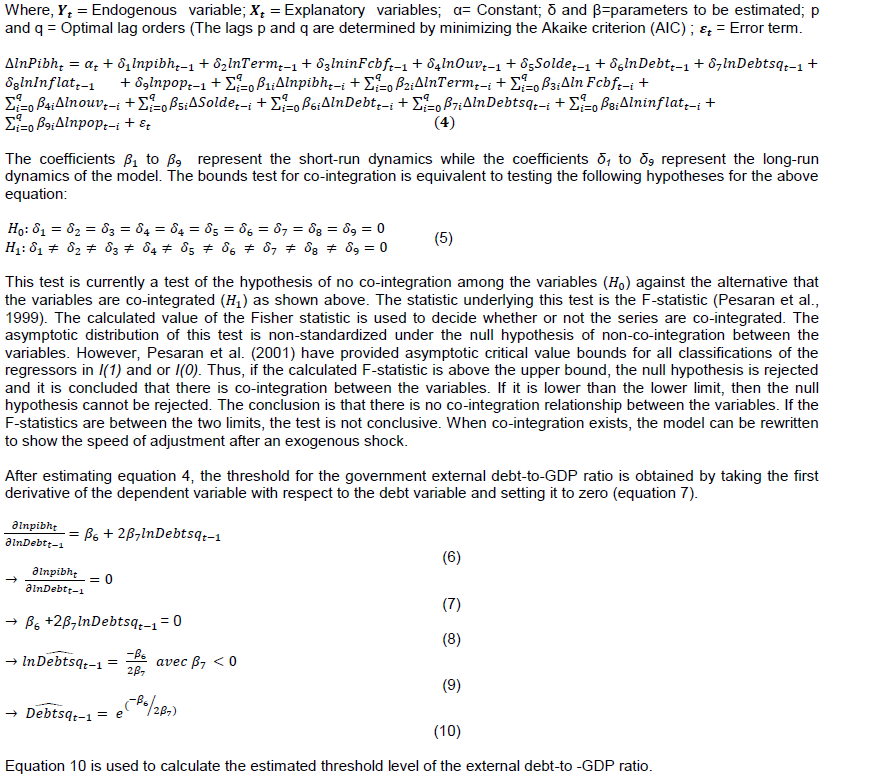
With the above result, we proceed to estimate the short and long term dynamics. The results are presented in Table 4. From Table 4, we found that in the long run, debt is positively related to growth and the coefficient associated with the squared variable is negative. This indicates that in the long run there is an optimal level of debt beyond which it will have a negative effect on growth. The error correction term is negative and significant, confirming the co-integration relationship between the variables. Furthermore, in the long term dynamics, we observe that all the variables are significant at 5%. With the above results (long-term dynamics) and using equation 10, it is possible to estimate the optimal level of indebtedness beyond which an increase in the external debt-to-GDP ratio will have a negative effect on the country's economy. Indeed, replacing the estimated parameters in equation 10 enables us to obtain the estimated optimal level of external debt-to-GDP ratio. It stood at 25.7%. Thus, beyond this point, an increase of the external debt-to-GDP ratio resulting from an increase in external debt will have a negative impact on the country's economic performance. It was also found that in the case of Guinea, the external debt-to-GDP ratio has no effect on the country’s economic performance.
The objective of this study was to determine the threshold of Guinea's external public debt-to-GDP ratio and compare it to the current evolution of public debt. Specifically, the study sought to determine the impact of the external public debt-to-GDP ratio on the country's economic performance; and to determine the threshold level of the external public debt-to-GDP ratio beyond which economic performance would be affected. We used an ARDL approach. We found that the variables considered in this study are co-integrated. That is, they move together in the long run. The ARDL(1,5) model estimated enabled us to have the following results: In the long run, external debt-to-GDP ratio has a positive impact on the country's economic performance; there is a threshold level of external debt-to-GDP ratio beyond which its impact on economic performance is negative. That threshold level stood at 25.27%. Considering the current level of the external debt-to-GDP ratio, which stood at 21.7%, it is clear that the country still has room to more borrowing, however we should call for caution as this level is not too far from the threshold.
This result is in line with previous studies (Omotosho et al. (2016), Adeniyi et al. (2018), N’Zué (2018), Mary et al. (2019)) that found a threshold level for external debt: in the long run, a 1% increase in the stock of external public debt-to-GDP ratio could lead to a 2.9% increase in per capita GDP; a 1% increase in investment as a percentage of GDP will lead to a 0.5% increase in per capita GDP; and a 1% increase in the working age population as a percentage of total population will lead to a 16.1% increase of per capita GDP. The results are also in line with Ehikioya et al. (2020) who found long run equilibrium between external debt and economic growth. In the short run, we obtained the following results: external debt-to-GDP ratio is positively related to economic growth but it is not significant. Investment as a percentage of GDP has a positive and significant impact on GDP per capita thus a 1% increase in the investment variable leads to a 0.48% increase in GDP per capita and the working age population has a negative impact on GDP per capita.
Given that investment has a positive impact on economic growth, it is necessary for the country’s authorities to encourage the development of public investment policies that promote the private sector. Additional research is needed to undertake a thorough assessment of the utilization of the resources borrowed. Also, they should develop the skills of the working age population to boost further its impact on the country’s economic performance.
The authors have not declared any conflict of interest.
REFERENCES
|
Adeniyi O, Adekunle W, Orekoya S (2018). Non-linear Relation between External Debt and Economic Growth in Nigeria: Does the Investment Channel Matter?
|
|
|
|
Aziz DA, N'Zué FF (2020). The Ivorian External Debt: Is There a Threshold? Journal of Economics and Finance 12(1):01-09.
|
|
|
|
|
Barro RJ (1990). Government Spending in a Simple Model of Endogenous Growth, Journal of Political Economy 98(5):279-296.
Crossref
|
|
|
|
|
Clements B, Bhattacharya R, Nguyen TQ (2004). Dette extérieure, investissement public et croissance dans les pays à faible revenu, Helping Countries Develop : The Role of Fiscal Policy, Saneev Gupta (eds), IMF pp. 105-109.
|
|
|
|
|
Cairnes JE (1874). Some Leading Principles of Political Economy Newly Expounded London. London: Macmillan and Co.
|
|
|
|
|
Ehikioya BI, Omankhanlen AE, Osuma GO, Inua OI (2020). Dynamic Relations Between Public External Debt and Economic Growth in African Countries: A Curse or Blessing? Journal of Open Innovation: Technology, Market, and Complexity 6(3):88.
Crossref
|
|
|
|
|
Faye I, Thiam D (2015). «Impacts de l'endettement public sur l'économie sénégalaise», Direction de la Prévision et des Etudes Economiques (DPEE).
|
|
|
|
|
Greenidge K, Craigwell R, Chrystol T, Drakes L (2012). Threshold Effects of Sovereign Debt: Evidence from the Carribean, IMF Working Paper. 157, Washington DC.
|
|
|
|
|
International Monetary Fund (2017). West African Economic and Monetary Union, Country Report 17/99.
Crossref
|
|
|
|
|
Krugman PR (1988). Financing vs. Forgiving a Debt Overhang. Journal of Development Economics 29(3):253-268.
Crossref
|
|
|
|
|
Mary FM, Sunday KE, Haruna AT (2019). Optimal Government Debt and Economic Performance in Nigeria. International Journal of Academic Research in Economics and Management Sciences 8(3):385-399.
Crossref
|
|
|
|
|
Mencinger J, Aristovnik A, Miroslav V (2014). The Impact of Growing Public Debt on Economic Growth in the European Union. Amfiteatru Economic Journal 16(35):403-414.
|
|
|
|
|
N'Zué F (2018). The Ivorian Debt: Should we Worry? Journal of Economics and International Finance 10(2):11-21.
Crossref
|
|
|
|
|
Omotosho BS, Bawa3 S, Doguwa SI (2016). Determining the Optimal Public Debt Threshold for Nigeria. CBN Journal of Applied Statistics 7(2):1-25.
|
|
|
|
|
Pesaran MH, Shin Y, Smith RJ (1999). Bounds Testing Approaches to the Analysis of Long-run Relationships.. Edingburgh School of Economics Discussion Paper Series P 46.
|
|
|
|
|
Pesaran MH, Shin Y, Smith RJ (2001). Bounds Testing Approaches to the Analysis of Level Relationships. Journal of Applied Econometrics 16(3):289-326.
Crossref
|
|
|
|
|
Patillo C, Poirson H, Ricci L (2002). External Debt and Growth, IMF/WP/02/69, Washington, D.C, IMF.
Crossref
|
|
|
|
|
Solow RM (1956). A Contribution to the Theory of Economic Growth. Quarterly Journal of Economics 70(1):65-94.
Crossref
|
|
|
|
|
Sachs (1989). The Debt Overhang of Developing Countries, Debt, Stabilization and Developing: Essays in Memory of Carlos Diaz Alejandro, Calvo G., Finlay R., Kouri P., Braga de Macedo J. Basil Blackwell. Oxford.
|
|
|
|
|
Sargent WN (1981), Some Unpleasant Monetarist Arithmetic, Federal Reserve Bank of Minneapolis Quarterly Review, Autumn. pp. 1-17.
Crossref
|
|
|
|
|
Wade A (2015). Policy-Mix et Croissance Economique dans la Zone UEMOA, Économies et finances, Université d'Auvergne - Clermont-Ferrand I.
|
|
|
|
|
World Bank (2020). World Development Indicators. Available at
View
|
|