ABSTRACT
Trinidad and Tobago is a high-income oil producing Caribbean economy that has been transitioning from the sole reliance on cash for payment, but analysis on the use of electronic payment services remains mostly unanalysed. A slow adoption rate can be a result of voluntary or involuntary financial exclusion if individuals in society choose not to access financial services or are stymied from fully accessing services. The data reveal that despite 81% bank account ownership, there were no deposits or withdrawals made from 19% of the accounts in 2017. Additionally, of the 63% debit card and 19% credit card ownership, card usage only accounted for 14% of GDP; with only 41% indicating the use of a debit or credit card to make a purchase in the past year. As such, this paper examines the use of electronic payments in Trinidad and Tobago and investigates its determinants. The parsimonious Ordinary Least Squares model suggests that financial deepening and increases in the younger proportion of the population are associated with higher use of electronic payments, while the share of the level of employment in the agricultural sector is associated with lower usage.
Key words: Electronic payments, developing economy, Trinidad and Tobago, financial exclusion.
The global landscape for payments and transactions is changing rapidly as economies develop their financial sector and move outside the sole reliance on cash (Bech et al., 2018; Davies et al., 2016; Capgemini, 2019). Trinidad and Tobago is one such economy that has boasted of its increasing financial asset base and depth, and is at the stage of also considering a cashless society transition and the divergence from cash as the main medium of exchange (Neaves, 2019; Oxford Business Group, 2020).
The literature shows that there are many benefits to the increased use of electronic payments (e-payments). E-payments do not involve the use of cash or cheque and are defined as payments made through electronic mediums often facilitated using electronic payment platforms. They include electronic funds transfer using debit and credit cards, Real Time Gross Settlement systems and Automated Clearing House services. The increased use of e-payments have been connected to improved transparency and security and a reduction in the prevalence of money laundering, tax evasion, fraud, human trafficking, drug trafficking, black money and counterfeit notes (Chakravorti, 2014; Frydrych et al., 2015; Herwadkar et al., 2019; Hilaire and Mahabir, 2020; Manyika et al., 2016; Organisation for Economic Co-operation and Development OECD, 2019). Several researchers including Bazarbash and Beaton (2020), Resendiz and Yazmín (2016), and Sahay et al. (2020) have also underscored the link between the increased access to e-payment and improved financial inclusion. A study by A. T. Kearney and VISA (2018) has shown that a 5% increase in digital payments per year for five consecutive years reduces the informal economy by 10.8 to 12.9%. Additionally, pooled cross-sectional time series analysis by Moody’s Analytics indicates that higher card usage contributed to $296 billion in consumption between 2011 and 2015, a cumulative increase in global GDP of 0.1%, and led to an average increase of 2.6 million jobs (Zandi et al., 2016). The digitisation of government payments has also been proven by Gupta et al. (2017) to save US$220 to $320 billion annually in developing countries.
Though the benefits of financial development and the increased utilisation of e-payments are recognised, a slow adoption rate can be a result of voluntary or involuntary financial exclusion, as individuals in society that have access to bank accounts either choose not to access or are stymied from the full utilisation of e-payment services. More discussion and research are needed to understand the progress of the e-payment sector in all economies including that of Trinidad and Tobago, and to determine the current level of usage of e-payment facilities available within the financial sector. The relationship between financial sector development and financial inclusion or the use of non-cash e-payment facilities are not always guaranteed and should be examined. Published research on the empirical examination of the payment system landscape and the use of e-payment facilities for developing economies such as Trinidad and Tobago are limited.
This paper contributes to the literature as understanding the use of e-payments and its determinants are critical for any economy that wants to increase adoption to reap its benefits, and to increase the overall level of financial inclusion. Identification of the factors that affect the use of e-payment is integral and is examined, as the transition to a cashless economy with the reduced reliance on cash as the main medium of exchange can only be achieved if innovative e-payment options in the financial space are being utilised. The benefits of increasing e- payments were discussed in section one. Section two reviews the literature on the determining factors which drive the use of e-payments. The payment landscape of Trinidad and Tobago and the usage of non-e-payment facilities such as cash and cheque and e-payment facilities such as Electronic Funds Transfer at Point-of-Sales Terminals, Real Time Gross Settlement and Automated Clearing House transfers are examined in section three. Section three also provides a comparative analysis with several economies. The methodology and results of a parsimonious econometric examination of a priori determinants for the use of e-payments are explored using the Ordinary Least Squares technique and are presented in section four and five. Section six summarises the major findings and concludes with some policy recommendations to drive e-payment usage.
Drivers of E-payments
Although financial sector development plays a significant role in a country’s overall level of e-payment infrastructure it does not always indicate equal demand or equal use of financial services. The literature shows a slow adoption rate for e-payments and thus financial exclusion can result from several demand and supply side factors.
Improved financial infrastructure, advancements in smartphone technology, increased mobile penetration, and an explosion of non-traditional financial supply-side solutions have created an environment for the increased use of e-payments. The empirical data presented by Herwadkar et al. (2019) show that the wider adoption of e-payment is dependent on the payments system infrastructure. PricewaterhouseCoopers, PwC (2016) also supports the ideology of infrastructure being a key determinant of a successful e-payment system, as they suggest the direct relationship between adequate acceptance infrastructure comprising ATMs, agent networks (MNO agents or retail agents) and Point of Sales (POS) terminals and the growth of e-payments. The use of e-payments can also be determined by cost. For instance, customers may not use POS terminals to avoid card surcharges (Schuh and Stavins, 2012).
Demand for e-payments is also expected to be higher when the average age of the population decreases, as older people tend to have a greater affinity for cash (Bech et al., 2018; Davies et al., 2016; Schuh and Stavins, 2012). Whilst Åšwiecka and Grima (2019) support the conjecture that older people tend to have a greater affinity for cash, they added that younger individuals tend to use cashless instruments more frequently. Schuh and Stavins (2012) also found several distinctions among the ages of those who made e-payments. They found higher debit card use among the group ages 17 to 34, while other types of payments were most common among the middle-aged group of 35 to 54-year-olds.
When analysing the choice of the payment form by consumers’ characteristics, Stavins (2002) found that higher income earners were more likely to use an electronic means of payment. She found that increasing household income by $10,000 raised the probability of using any form of e-payment by 2.7 percentage points.
Panel data analysis for 20 Committee on Payments and Market Infrastructures (CPMI) member countries performed by Bech et al. (2018) showed that as GDP per capita increases, the demand for cash usage declines. A relationship between education and the use of e-payments was also observed by Goczek and Witkowski (2015), and Bergman et al. (2007). The empirical data presented by Stavins (2002) also revealed a 7.6% point increase in the use of any type of e-payment when education was increased by one level.
Oyelami et al. (2020) employed a mixed-method approach as influenced by the data collected through both primary and secondary sources and determined that a higher share of rural population seems to be associated with lesser e-payments. Individuals that are also employed in the agricultural sector also have a lower likelihood of using e-payments (Herwadkar et al., 2019). White-collar workers classified by Stavins (2002) as those working in managerial, professional, or technical specialties were also found to have a higher likelihood of using every type of e-payment as opposed to blue-collar workers and those who were unemployed, even after controlling for income and education.
The shift in consumer behaviour towards e-payment has also been influenced by confidence and expectations. For instance, Chorzempa (2018) stated that in a 2017 survey “84% of Chinese were not concerned about leaving home without any cash-not because they relied on credit cards or checks, but because they were confident that their mobile phone payment methods like Alipay or WeChat would be accepted for any expenses they encountered”. The UK Payment Markets 2019 Report also credits increased comfort and familiarity to the projection of the number of payments made via contactless cards and forecasted an increase from 19% in 2018 to 37% in 2028. The use of e-payments also tends to be habit forming and generally needs to be inculcated. A more recent study on consumers’ choice of payment instrument in Poland found that the most frequently cited reason for not using innovative forms of payment is the habit of using the old forms of payment such as cash (Åšwiecka and Grima, 2019). Structural equation modelling was utilised by Oney et al. (2017) to substantiate their hypothesis that past experience with e-payment systems has a significant and positive effect on consumers’ perceived security and trust.
TRINIDAD AND TOBAGO'S PAYMENT LANDSCAPE
The payment landscape in Trinidad and Tobago has been evolving as the banking and non-bank financial institutions have focussed on revolutionising the financial sector and increasing financial sector inclusion by ensuring that citizens can have access to the banking sector, whilst upholding the regulative guidelines of the Central Bank. The Central Bank also initiated several areas of advancement in 2000 to improve the safety and soundness of the payments system (Central Bank of Trinidad and Tobago (CBTT), 2009, 2019). This involved reform of the legal framework, improving infrastructure, introducing new technology, strengthening the operating rules and the supervision of the system, and educating and disseminating information on the payments system. Thus, over the years the financial sector has added products that would allow citizens to open new accounts and to have more options when they settle their daily transactions (Seerattan, 2000). These payment options span that of cash, cheques, payment cards, and other forms of electronic transfers.
Non-E-payments: Cash and cheque
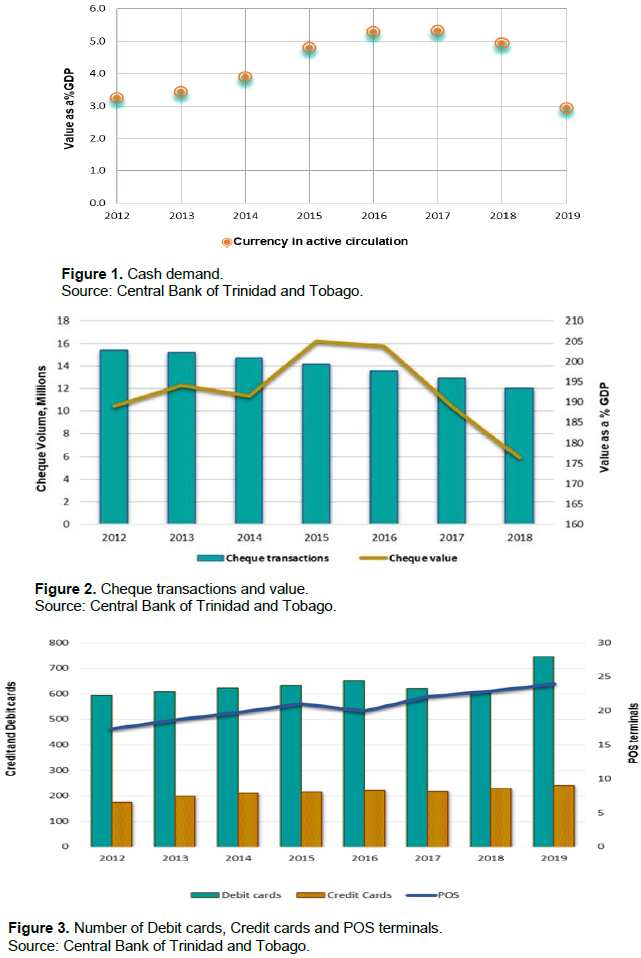
The non-e-payment sector is mainly consisted of cash and cheque. Cash demand as proxied by cash in circulation as a ratio of GDP has transitioned from initial increases and has declined from a peak of 6% in 2016 to 3% of GDP in 2019 (Figure 1). The volume of transactions carried out via cheque, and its overall value as a ratio of GDP also show a similar declining trend. Figure 2 shows that the number of transactions with cheque decreased from approximately 15 million valued at approximately 190% of GDP in 2012 to approximately 12 million valued at approximately 180% of GDP in 2018.
E-Payments: Payment cards and electronic transfers
The payment system was later expanded beyond that of cheque to introduce payment cards and electronic transfers. These e-payment alternatives are facilitated via the use of three electronic payment platforms which include the Electronic Funds Transfer at Point-of-Sales Terminals (EFTPOS), the Real Time Gross Settlement (RTGS) system and Automated Clearing House (ACH) services.
Credit and debit cards are the two forms of card payments currently facilitated by EFTPOS in Trinidad and Tobago. Credit cards such as VISA and MasterCard were issued by commercial banks in the 1980’s, debit cards were offered in 1996 and POS terminals introduced in 1997. Despite not having available data on the initial number of POS terminals, the number of credit or debit card accounts or the volume or value of EFTPOS from its inception, the trend in its increased availability and usage can be gleaned from Figures 3 and 4. Figure 3 shows that the number of debit and credit cards in use was over 740 thousand and 240 thousand in 2019 respectively. The number of POS terminals has also increased over the 2012 to 2019 period and amounted to approximately 24 thousand in 2019. Figure 4 shows that the volume of debit card transactions at POS terminals increased from approximately 31 million valued at TT$9 billion or 6% of GDP in 2012 to 43 million valued at TT$13 billion or 8% of GDP in 2019. The volume of credit card transactions increased from approximately 13 million valued at TT$7 billion or 4% of GDP in 2012 to 19 million valued at TT$11 billion or 7% of GDP in 2019.
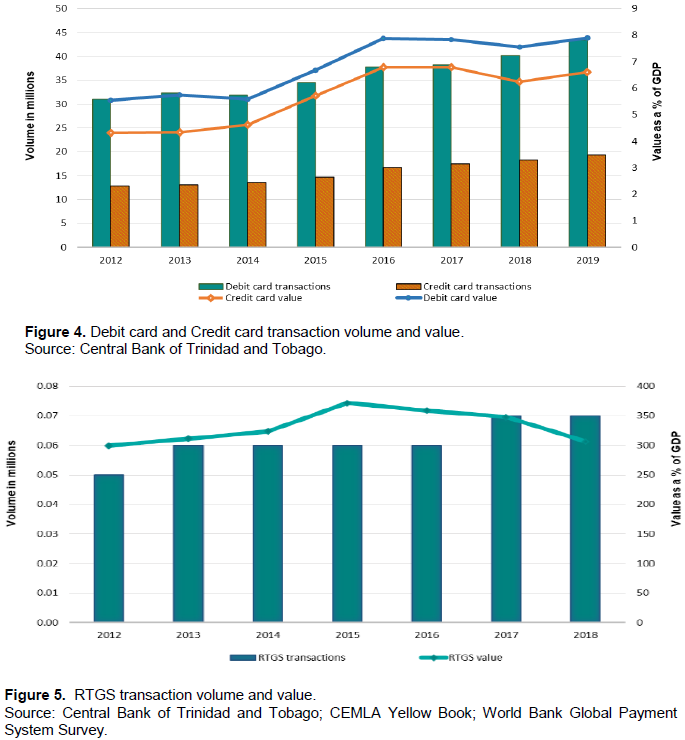
The e-payment platform was again extended in October 2004 with the launch of the Real Time RTGS system. The RTGS system, coined safe-TT, enabled the processing of large value ($500,000 and over) time-critical interbank payments and provided same day access to funds. Figure 5 shows that the volume of RTGS transactions increased from approximately 0.05 million, valued at over TT$496 billion or 300% of GDP in 2012 to approximately 0.07 million, valued at over TT$494 billion or 306% of GDP in 2018.
This measure has been commonly used as a proxy for cash demand, see Bech, Faruqui, Ougaard and Picillo (2018)
The volume and value for cheque transactions in 2019 were not available.
The latest payment addition was the ACH platform, Transach, which was launched in 2005 by the Trinidad and Tobago Interbank Payment System (TTIPS) Limited to facilitate the batch processing of recurrent credit and debit transactions such as salaries. Similarly, to the other components of e-payment, ACH transactions also experienced increases in the volumes and values of transactions since its inception. Figure 6 shows that ACH transactions increased from approximately 3 million, valued at over TT$18 billion or 11% of GDP in 2012 to approximately 5 million, valued at over TT$32 billion or 20% of GDP in 2018.
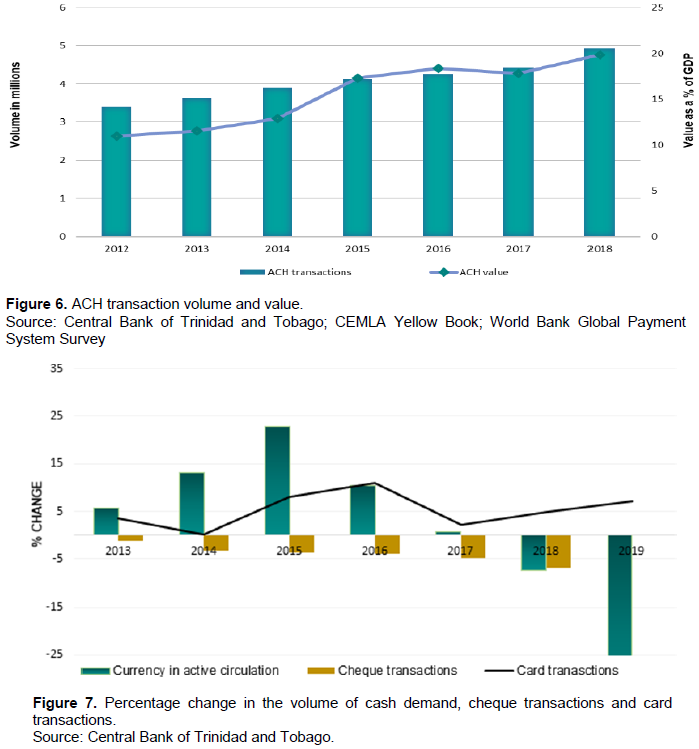
The overall transaction volumes occurring through the three e-payment platforms (EFTPOS, RTGS and ACH) suggest an increased usage of e-payments and can be indicative of rising levels of confidence and future demand. The statistics presented show that debit card transactions at POS terminals was preferred, as it reflected the highest volume of transactions, with credit card transactions as a close second. Over the period 2012 to 2019, this combined growth of debit card and credit card transactions was approximately 41% in volume and 50% in value. The changes in the growth rate of the card payments versus that of cash demand and projected cheque payment also present a clearer picture in terms of the changes in preferences when making payments; as from 2017 to 2019 only card volumes have been experiencing year on year growth (Figure 7).
Comparative analysis
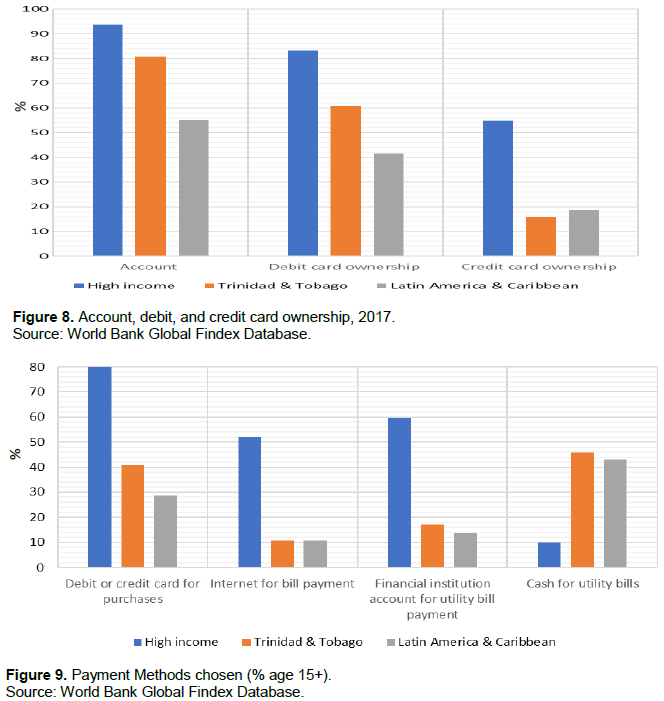
Despite these increasing levels of electronic transactions and discourse on new policy initiatives, the e-payments landscape in Trinidad and Tobago can be considered embryonic. Though 81% of the population 15 years or older had an account at a financial institution in 2017, only 63% of the population 15 years or older owned a debit card while 19% owned a credit card. Figure 8 shows that on comparison with the average Latin American and Caribbean country, Trinidad and Tobago has higher account and debit card ownership, but a smaller sector of the population having a credit card. Trinidad and Tobago also has lower account, debit card, and credit card ownership than other high-income economies.
The large disparity to high-income economies is also noted in the observed methods of payment for the purchase of goods and services and the payment of utility bills. Payments statistics from the World Bank Findex Database (Figure 9) reveal that the average high-income economy has approximately twice as many individuals in the population using debit and credit cards as a payment option. Additionally, five times more individuals in high-income economies choose to use the internet to make payments. The vast difference in payment methods used for the payment of utility bills also signals a higher inclination for cash preference in Trinidad and Tobago than the average high-income or Latin American and Caribbean economy, as a greater proportion of the population 15 years or older use cash to pay utility bills.
The Trinidad and Tobago E-Money Issuer Order 2020, only expanded the payment sector to allow entities registered with the Central Bank as a Payment Service Provider or Payment System Operator (PSO), Money Remitters registered with the FIU, Mobile Network Operators authorised by the Telecommunications Authority of Trinidad and Tobago, Technology Service Providers to issue e-money in August. Republic of Trinidad and Tobago (2020).
However, 19% of these account holders made no deposits and no withdrawal from a financial institution account in the past year, which can also suggest a considerable level of dormant accounts.
Trinidad and Tobago also experienced the highest percentage of the population (13%) receiving private sector wages in cash in 2017.
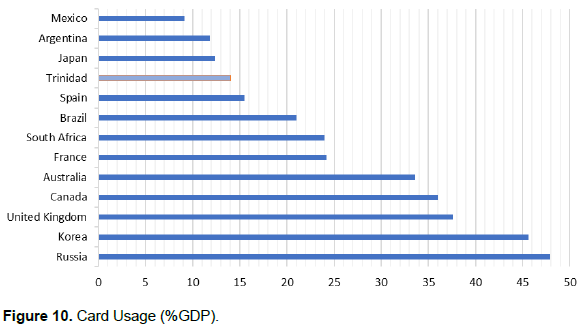
Closer examination of the value of card transactions as a percentage of GDP in 2018 in Figure 10 indicates that at 14% of GDP, it was higher than some Latin American economies inclusive of Mexico and Argentina. However, in comparison to high-income economies such as Australia, Canada, and the United Kingdom it was approximately 50% lower and compared to Russia which is also an oil producer, it was 70% lower. The lower levels of usage of e-payment facilities by individuals as opposed to the number of individuals that have access to accounts at financial institutions signal comparatively lower uptake by the general public and can be indicative of a case of involuntary and voluntary financial exclusion being exhibited. Involuntary financial exclusion can be a consequence of financial service requirements and cost. The restrictive processes and application requirements for commercial banking customers to acquire credit cards can be responsible for the disparity between credit card and debit card ownership. Potential card applicants can believe that they have insufficient income or are of such a high risk, that a prudent financial entity will exclude them.
The affordability over accessibility of infrastructural requirements should also be considered as cost of financial services can act as a barrier against some individuals and firms that may like to use e-payment services. In this instance, the usage of payment cards can also be affected as most commercial banks in Trinidad and Tobago charge a point of sale debit card usage fee of $0.75 per transaction, whilst credit card owners have a maintenance/membership fee which can be as much as TT$625, with late payment fees ranging from TT$50.00 to 10% of the past due amount. ACH transaction fees can also amount to as much as TT$5 depending on the type of account (personal or business) and the commercial banking institution, while RTGS transaction fee range from TT$40 to approximately TT$170 (US$25).
Alternatively, voluntary financial exclusion can be as a consequence of lack of trust, lack of understanding and indirect access. The latest datapoint from the Global payments database reveals that 29% of individuals without a financial institution account (15 years or older) in Trinidad and Tobago did not have one because of the lack of trust in financial institutions. This means that those individuals would be excluded from access to the current forms of e-payment such as card payments because in Trinidad and Tobago access for such services are dependent on having an account with a financial institution. The lack of trust and understanding can also be surmised as only 17% of the population 15 years or older paid a utility bill using a financial institution account, whilst 66% used cash, even though 81% of the population (15 years or older) had access to an account at a financial institution and would have no direct financial charge for its use. Indirect access is also another reason for exclusion, as 34% of the population (15 years or older) did not have an account because someone in their family had one.
The low use of what may appear to be more convenient and, in some cases, a more cost-effective choice can generally suggest the need for policies that promote financial education in accordance with the country’s culture. There is a need for increase in awareness and understanding of financial products which should be targeted to the intended user. Additionally, reducing the restrictive nature of current monetary policy and the fee structure of the financial sector should be considered in Trinidad and Tobago to reduce the under banked population. However, given the high levels of excess liquidity and profitability of the banking sector, financial entities may not be as eager to expand into unfamiliar territory. There is a potential for e-money and mobile money issuers to expand the payment landscape and provide services within the low value payment chain. However, this is also another area within the electronic financial payment landscape where the Trinidad and Tobago economy is lagging, as the legislation was only expanded to include non-financial issuers on August 2020. The E-Money Issuer Order 2020, therefore has the potential to encourage new entrants to apply to the Central Bank to issue e-money and to allow the economy to move past a primarily cash and card-based system to a wider range of e-payment facilities which can utilise the high mobile penetration rates.
Comparative schedule of fees and charges as at June 30th 2019, Central Bank of Trinidad and Tobago (2019).
This leaves room for further investigation to develop surveys so that further analysis can be conducted.
The mobile cellular subscriptions per 100 people was 155 in 2019 as there were 2.2 million mobile cellular subscriptions.
Data analysis can help shed further light on the factors that have affected the use of e-payments in Trinidad and Tobago. Thus, a parsimonious model with established a priori determinants is specified as follows for examination.
Where: represents the constant. represents the coefficients of each determinant, where n =1,2,3,4.ε represents the error term. EPmt represents e-payments; it is proxied by debit card payments at POS terminals as a ratio of GDP.
Age represents the proportion of the younger population in the economy; it is proxied by the percentage of the population between the ages of 20 to 29. Age allows for an examination of how the proportion of younger individuals in the economy impact the use of e-payments as it is projected to have a positive association. FDeep represents financial development; it is proxied by the share of domestic credit provided by the financial sector as a ratio of GDP. FDeep allows for an examination of how the depth of the Trinidad and Tobago financial system has affected the use of e-payments, as wider financial depth can be reflective of a greater availability of digital infrastructure and is expected to lead to greater use.
Agr represents the share of employment in the agriculture sector as a ratio of GDP. Agr allows for an examination of how changes in the agricultural sector have affected the use of e-payments. A larger agricultural sector is generally associated with greater cash usage and thus a lower usage of e-payments is expected with increases in the share of employment in the agriculture sector.
Y represents income; it is proxied by the growth in GDP. Y allows for an examination of how changes in income have altered the use of e-payment, as is not always positively related to lower cash use or the increased use of e-payments.
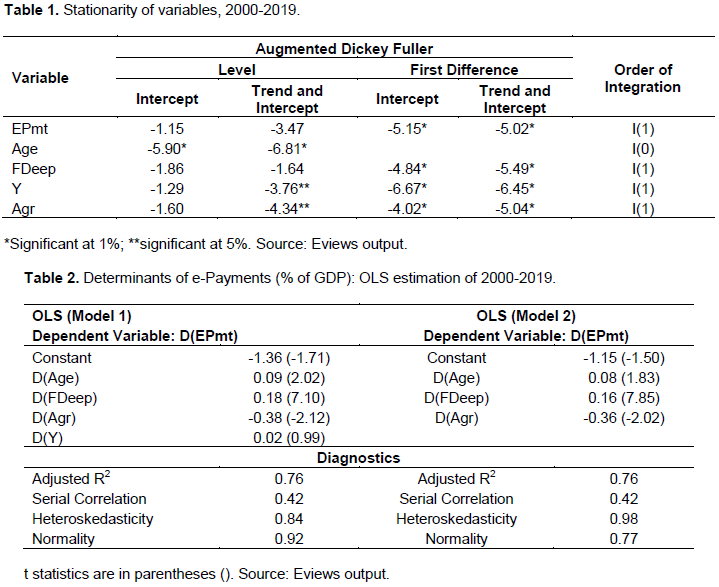
To ensure the regression analysis did not produce spurious results, the order of integration I(d) of all variables were determined by the Augmented Dickey Fuller tests, and non-stationary variables were converted by differencing. OLS estimation was used to investigate the determinants of e-payment usage. The significance of each model was determined by the residual, coefficient diagnostics, and stability. The predictor variables were examined to ensure they were not highly correlated. The residual of the model was tested for serial correlation, homoscedasticity, and normality at the 5% level using the ARCH LM, Breusch-Godfrey, and Jarque-Bera tests. The CUSM test assessed the stability of the residuals, and confirmed cumulative sums were located within the two standard deviation bands.
Debit card payment consisted of the largest volume of e-transactions and could provide the most statistical data points.
Statistical data on other common proxies for financial infrastructure such as the number of ATMs or number of debit cards were not available for the data span.
The results of the stationarity test indicate that all dependent and independent variables with the exception of age are characteristic of one unit root [I(1)], with age having no unit roots [I(0)] (Table 1). Initial econometric analysis as shown in Table 2, indicated that income (Y) was a non-significant determining factor and was therefore omitted from the final model as it provided no significant contribution to the explanation of the use of e-payments. The results of the final model presented in Model 2 were not affected by multicollinearity, pass diagnostic tests, indicate a normal distribution, show no sign of serial correlation or heteroskedasticity in the residual, and are thus statistically acceptable. The results confirm the significance of the independent variables on the use of e-payments and have an adjusted R2 of 76%. The linear representation of the equation is presented by:

The independent age (Age) variable has a coefficient of 0.08 and indicates the direct association between the larger proportion of younger individuals to an increase in the use of e-payments. This can suggest that as the demographic of the population changes such that the current generations advance, the use of e-payments should also continue to increase ceteris paribus. The result for financial development (FDeep) is also in line with the a priori expectation, for which a percentage increase in financial development leads to an average increase of 0.16% in the use of e-payments. The results also show that a greater percentage share of employment in the agriculture sector (Agr) is associated with a reduction in the use of e-payments. Thus, a percentage increase in the share of employment in agriculture is associated with an average fall in e-payment use by 0.36%.
In spite of the limited data availability, which affected the time span for the study, several important details could be recognised and substantiate the need for further work in this area as more data becomes available to understand factors influencing perception towards e-payment. The generated econometric results indicate that Trinidad and Tobago can increase the use of e-payments by increasing the infrastructure throughout the country, inclusive of the ease of use in the agricultural sector, and by the older segment of the population. These findings can also support the prior examination of the use of e-payment facilities in the country, as some segments of the population may appear to have a lower level of inclusion. Infrastructural expansion should be matched with educational campaigns on e-payment functionality and its benefits to increase usage amongst those in the agricultural sector and for individuals that appear to be less willing to use e-payment mechanisms.
The value chain within the agricultural sector is considerably cash based as most local farmers/market vendors generally accept cash for payment and use cash for purchase of materials. Thus, there is a need for a closer examination of the sector to increase e-payment usage. The expansion of e-payment within this sector is arguably fundamental to sustainable agricultural and growth within the sector. Increased e-payment usage can also lead to a reduction of common news headlines such as the 2020 Guardian headline ‘Tableland farmer robbed of $345,000’ and Loop News headline ‘Five held after farmer robbed of $15,000’ in 2019 (De Silva, 2020; Loop News, 2019). Increased usage does not only increase the comfort cited in many reports but can lower overall maintenance cost incurred by merchants and the implicit fixed costs of financial intermediation. Another measure to consider is the incentive for usage. Reduction in the cost of e-payment options via the use of government subsidies and infrastructural grants can also stimulate the e-payment sector and the transition from cash.
If there is no demand, there is no viable product. Understanding the use of e-payments is essential to the future development of alternative payment mechanisms and regulation, as increased financial inclusion and a transition to a cashless society depends on the reduction of both involuntary and voluntary financial exclusion. Thus, a review of the use of current e-payment facilities in Trinidad and Tobago is relevant to understanding the payments system and to ensure overall expansion of the digital payment sector. The data revealed that despite increasing levels of electronic transactions and bank account ownership, which are typically above that of the average Latin American and Caribbean economies, it was substantially below similar high-income economies. The value of card transactions in Trinidad and Tobago was only 14% of GDP, while high-income economies such as Australia, Canada and the United Kingdom recorded transactions valued at more than twice that, at 34, 36 and 38% of GDP respectively.
The OLS model substantiated the possibility that changes to financial deepening and broader acceptance of e-payments in the agricultural sector and across all age groups would lead to increased usage. There appears to be a need to also alter the perception of usage, or to consider increasing uptake by reducing the cost of eâ€payment. Improved accessibility for e-payment in Trinidad and Tobago should occur concomitantly with improving consumer perception, as a successful payment ecosystem needs a customer base that understands the product and its benefits. This change in consumer awareness and habits can occur through educational endeavours to drive adoption initiatives and bolster better practices to allow for a reduction on both voluntary and involuntary exclusion.
The author has not declared any conflict of interests.
REFERENCES
|
A. T. Kearney and VISA (2018). Visa School of Public Policy: Digital payments and the global informal economy.
|
|
|
|
Bazarbash M, Beaton K (2020). Filling the gap: Digital credit and Financial Inclusion. IMF Working Paper 20/150.
Crossref
|
|
|
|
|
Bech LM, Faruqui U, Ougaard F, Picillo C (2018). Payments are a-changin' but cash still rules. BIS Quarterly Review 11.
|
|
|
|
|
Bergman M, Guibourg G, Segendorf B (2007). The costs of paying: Private and social costs of cash and card systems. Sveriges Riksbank Working Paper Series 212:1-38.
Crossref
|
|
|
|
|
Capgemini (2019). "World Payments Report".
|
|
|
|
|
Central Bank of Trinidad and Tobago (CBTT) (2009). The Payments System in Trinidad and Tobago.
|
|
|
|
|
Central Bank of Trinidad and Tobago (CBTT) (2019). Comparative schedule of Commercial Banks' fees and charges.
|
|
|
|
|
Central Bank of Trinidad and Tobago (2009). Public Education Pamphlet Series (No5).
|
|
|
|
|
Chakravorti B (2014). The Hidden Costs of Cash. Harvard Business Review.
|
|
|
|
|
Chorzempa M (2018). How China Leapfrogged Ahead of the United States in the Fintech Race. Peterson Institute for International Economics.
|
|
|
|
|
Davies C, Doyle MA, Fisher C, Samual N (2016). The Future of Cash. RBA Bulletin Reserve Bank of Australia December pp. 43-52.
|
|
|
|
|
De Silva R (2020). Tableland farmer robbed of $345,000. Trinidad and Tobago Guardian.
|
|
|
|
|
Frydrych Jr, Scharwatt C, Vonthron N (2015). "Paying School Fees with Mobile Money in Côte d'Ivoire: A Public-Private Partnership to Achieve Greater Efficiency." GSMA London.
|
|
|
|
|
Goczek L, Witkowski B (2015). "Determinants of card payments". Applied Economics 48(16):1-14.
Crossref
|
|
|
|
|
Gupta S, Keen M, Shah A, Verdier G (2017). Digital revolutions in public finance. Washington DC: International Monetary Fund.
|
|
|
|
|
Herwadkar S, Verma R, Bilantu P (2019). Drivers of Digital Payments: A Cross Country Study. Reserve Bank of India Bulletin 73(8):21-33.
|
|
|
|
|
Hilaire A, Mahabir R (2020). The Great Exchange: Rapid Demonetization in Trinidad and Tobago. Central Bank of Trinidad and Tobago Working Paper 03/2020
Crossref
|
|
|
|
|
Loop News (2019). Five held after farmer robbed of $15,000.
|
|
|
|
|
Manyika J, Lund S, Singer M, White O, Berry C. (2016). Digital Finance for All: Powering Inclusive Growth in Emerging Economies.
|
|
|
|
|
Neaves J (2019). From 100 to Zero. Trinidad and Tobago Newsday.
|
|
|
|
|
Oney E, Guven OG, Rizvi W (2017). "The determinants of electronic payment systems usage from consumers' perspective". Economic Research-Ekonomska Istraživanja 30(1):394-415.
Crossref
|
|
|
|
|
Organisation for Economic Co-operation and Development (OECD) (2019). Lessons from the EU-SPS programme: Implementing social protection strategies.
|
|
|
|
|
Oxford Business Group (2020). The Report Trinidad & Tobago 2020, Banks turn to financial technology in Trinidad and Tobago.
|
|
|
|
|
Oyelami LO, Adebiyi SO, Adekunle BS (2020). "Electronic payment adoption and consumers' spending growth: empirical evidence from Nigeria". Future Business Journal 6:14.
Crossref
|
|
|
|
|
PricewaterhouseCoopers (PwC) (2016). Emerging Markets Driving the payments transformation.
|
|
|
|
|
Republic of Trinidad and Tobago (2020). Legal Notice No. 284 E-Money Issuer Order, 2020.
|
|
|
|
|
Resendiz R, Yazmín P (2016). The role of payment systems and services in financial inclusion - the Latin American and Caribbean perspective. Center for Latin American Monetary Studies.
|
|
|
|
|
Sahay R, Eriksson von Allmen U, Lahreche A, Khera P, Ogawa S, Bazarbash M, Beaton K (2020). The Promise of Fintech Financial Inclusion in the Post COVID-19 Era.
|
|
|
|
|
Schuh S, Stavins J (2012). How consumers pay: Adoption and use of payments. Working Papers No. 12-2 Federal Reserve Bank of Boston.
Crossref
|
|
|
|
|
Seerattan D (2000). Innovations in the Payments System, Systemic Risks and Challenges to Central Banking in Trinidad and Tobago.
|
|
|
|
|
Stavins J (2002). Effect of Consumer Characteristics on the Use of Payment Instruments. New England Economic Review.
|
|
|
|
|
Åšwiecka B, Grima S (2019). "Factors Affecting the Consumers' Choice of Payment Instrument in Poland". European Research Studies Journal 22(4):179-198.
Crossref
|
|
|
|
|
United Nations, Department of Economic and Social Affairs Population Division (2019). World Population Prospects 2019, Online Edition. Rev. 1.
|
|
|
|
|
Zandi M, Sophia K, Virendra S, Paul M (2016). The Impact of Electronic Payments on Economic Growth. Moody's Analytics.
|
|