ABSTRACT
“Access to finance for all” has gained attention in the international development agenda in recent years. In the West African Economic and Monetary Union (WAEMU), the issue of financial inclusion is set at the level of priority but in several dimensions of financial inclusion, countries of the union lag behind the Sub-Saharan Africa and Asian benchmark countries. In this paper, factors that are important for financial inclusion in WAEMU are identified and it is investigated whether these factors are correlated with self-reported barriers to financial inclusion using the 2014 Gallup World Poll Survey data. The results indicate that, the variables: Age, sex, employment status, educational attainment and level of income are all determinants of financial inclusion in WAEMU. The results of the relationship between self-reported barriers and individuals’ characteristics show that, educational level and income are the main factors that affect the livelihood of reporting a barrier to financial inclusion in WAEMU.
Key words: Personal finance, financial institutions, West African Economic and Monetary Union (WAEMU).
The process of ensuring that everyone who wants to have access to financial services can do so at affordable prices within an appropriate regulatory framework has become one of the major socioeconomic challenges of the present century for all development actors world-wide. The agreement at the 2013 G20 meeting to go forward with the agenda of financial inclusion and the objective to achieve universal access to finance by 2020 are informative. This is because it is widely recognized that a better access to financial services is crucial for economic growth, and reducing poverty and unequal inclusion in development (Allen et al., 2016; World Bank, 2014). Indeed, broadening and enhancing financial services is likely to empower disadvantaged but talented groups in an economy (Beck and de la Torre, 2006). Financial inclusion eases funds transfer from abroad and so attracts remittances associated with positive implications on the economies of recipient countries (Demirguç-Kunt et al., 2011).
Bruhn and Love (2009) have investigated using difference-in-difference strategy, the impact of the Bank Banco Azteca’ financial services expansion in Mexico (opening simultaneously more than 800 branches in 2002 and focusing on low-income group clients) on entrepreneurship, employment and income. The authors have found that, the expansion of financial services has raised the number of entrepreneurs by 7.6% and an increase of the overall employment and average income by respectively 1.4 and 7%. Kodan and Chhikara (2013) on a sample of 52 countries using a financial inclusion index that encompasses three dimensions of financial inclusion (depth, availability and usage) have found out that, a 1% increase in the financial inclusion index leads to an average increase in the value of human development index (HDI) by 0.142. Moreover, their results revealed that the three dimensions of financial inclusion are negatively associated with poverty.
On the other hand, barriers to a broad access to financial services are likely to increase income gap and generate poverty traps (Beck et al., 2008). Remaining unbanked can irreversibly financially harm individuals’ well-being since having an account can ease capital accumulation and wealth creation, determinant for consumption smoothing and the ability to withstand shocks (Rhine and Greene, 2013). Ellis et al. (2010) have shown that, access to financial services in Kenya and Tanzania has enabled households to invest in human capital accumulation, to start or develop a business and to invest in agricultural productivity enhancing activities. However, broadening access to financial services (for instance expanding banks branches even to remote areas) does not necessarily translate into an effective use of these services since individuals can have access to these services but avoid using them because of socio-cultural reasons or innate characteristics.
Moreover, some supply-side barriers to financial inclusion in the context of market failure stem from the banking system rational and prudential practices and so could be considered as leading to optimality (Beck et al., 2008). So, promoting financial inclusion requires understanding how individuals and firms levels characteristics matter for financial inclusion. However, little is known about factors that are determinant for individuals and firms’ decisions to participate in the financial mainstream and factors behind individuals and firms-levels financial exclusion (Allen et al., 2016; Beck et al., 2008). The aim of this paper is to identify individuals-level factors that matter for financial inclusion in the West African Economic and Monetary Union (WAEMU) where financial inclusion is set at the level of priority in the development agenda but in several dimensions of financial inclusion, countries of the union are still lagging behind Sub-Saharan Africa and Asian benchmark countries (IMF, 2015) and where no study has identified these factors.
The importance given to the issue of financial inclusion in WAEMU is reflected in the setting up of appropriate regulatory and supervisory frames; the adoption of specific programs such as the regional program PRAFIDE (2005-2009) which aimed at sustaining microfinance and enlarging the access of financial services to the poor segments of population; the action plan for inclusive finance (2007-2012) and different other initiatives in favor of mobile banking development. Despite these efforts, the proportions of adult population with an account in a formal financial institution in WAEMU are among the lowest in the world (Banque de France, 2014). Access to finance is especially very low for the low income segments of population (less than 5% at the bottom 40% of income distribution have a bank account). The low level of financial inclusion in the WAEMU is in part due to financial services costs perceived as higher by the population and the low level of bank branches in rural areas because of a lack of appropriate infrastructures (Banque de France, 2011).
Thus, in order to boost financial inclusion in WAEMU, the central Bank BCEAO has launched free banking for 19 services in the eight (8) countries of the union including the opening and closing of accounts, cash deposits and withdrawals, money transfer from one account to another in the same bank, the set-up of direct debits and standards orders, credit-card payments in the WAEMU zone, cashing a check in the WAEMU banks, cashing remittances at national and international levels, online banking, annual and monthly statements receipts as a first stage for free banking in the union. Moreover, while in the past efforts to increase access to financial services in WAEMU focused on promoting microfinance through national microfinance strategies, in recent years, national microfinance strategies are being replaced by national financial inclusion strategies (Riquet (CGAP), 2015).
These programs and initiatives will be reinforced by the adoption of the regional financial inclusion strategy which is being developed by the central bank BCEAO in collaboration with the WAEMU member countries’ ministries of finance with the chief objective to include financially more than 70% of adult population by 2020. Despite these efforts, if the demand-side factors that determine individuals’ participation in the financial mainstream are not well understood in the union, addressing some supply-side issues will not necessarily translate into a better access to and use of financial services. In this paper, we have identified the determinants of financial inclusion and investigated whether these determinants are correlated to self-reported barriers to financial inclusion in WAEMU.
The results of the determinants of financial inclusion indicate that, the variables Age, sex, employment status, educational attainment and income of the respondents are all determinants of financial inclusion in WAEMU. Globally, the educational attainment matter more for financial inclusion in WAEMU; followed by employment status and the level of income. The gender issue and the age of the respondents play relatively a less important role in individuals’ participation in the financial mainstream in WAEMU. The results of the relationship between self-reported barriers and individuals’ characteristics show that, among those who are excluded from the financial system in WAEMU, educational attainment and income are the main factors that significantly affect the likelihood of reporting specific barrier to financial inclusion.
Studies on the determinants and barriers to financial inclusion and those relating access to financial services to development outcomes are somewhat budding because of lack of appropriate data for such analyses (Efobi et al., 2014). Nonetheless, since the recent effort on households-level survey data collection in more than 140 countries, there has been a renewed interest in measuring and identifying factors that matter for financial inclusion, especially in developing countries. Broadly, empirical studies differ from one another depending on the availability of data and to a certain extent on the way financial inclusion is measured (demand or supply-sides indicators of financial inclusion used and the corresponding determinants at individuals, firms and country levels). At macroeconomic level, Beck et al. (2007) attempted (first to our knowledge) to measure financial inclusion (constructing aggregate indicators of financial sector outreach) and investigate its determinants using survey data on over 99 countries.
The authors measured the outreach through the number of branches and automated teller machines (ATM) relative to population and area to capture the demographic and geographic penetration of the banking system. In this respect, higher branch and ATM intensity were interpreted as higher possibilities for households and enterprises to have access to financial services and opportunity to use them. Since access to financial services is not similar to the use of these services, the authors have measured the actual use of deposit and credit services by the number of deposits and credits accounts relative to population and the average loan and deposit sizes relative to GDP per capita. They have postulated that higher loan and deposit accounts per capita might indicate that a greater share of population use loan and deposit services whereas lower loan and deposit amounts relative to GDP per capita might indicate their use by small-size costumers.
These indicators allowed investigating empirically, the cross-country variations in financial outreach and checking if factors that drive financial sector depth also determine its outreach. The results indicated that, apart from the fact that the level of creditor right protection is positively correlated with financial sector depth; factors that determine financial outreach and depth are the same. Indeed, there is a positive correlation between variables such as the overall level of economic development, the quality of institutional environment, the degree of credit information sharing, the level of initial endowments and the development of physical infrastructure and the indicators of financial outreach and depth on the one hand and a negative correlation between the cost of enforcing contracts and the degree of government ownership of banks and these indicators on the other hand. While the extent of historical variables such as legal origin and religion in explaining cross-country variations in financial outreach is found to be lower in comparison with financial depth, the nature of the correlation remain the same.
Yet, the authors have recognized that, they would have made use of alternative indicators of financial outreach such as the share of households with bank account and the share of firms with bank loans if there were not a dearth of survey data. So, they recommended micro-level data collection for improvements in the analysis of the determinants of financial inclusion. Along the same line, Allen et al. (2016) have pointed out that, some aggregate measures of financial inclusion such as the number of accounts per capita used in Honohan (2008), Kendall et al. (2010) and Demirguç-Kunt et al. (2011) might have under or overestimated the level of financial inclusion in a given economy as it contains individuals with more than one account and foreigners who have an account in the local economy. Moreover, the authors argued that country-level aggregate indicators of financial inclusion do not allow for the understanding of how policy actions can be undertaken across individuals-level characteristics.
So, the authors have investigated at microeconomic level, the influence of individuals-level characteristics such as gender, age, education, employment status and income as well as country-level characteristics that shape their decision to own a formal account and use financial services and products and have attempted to understand how barriers to financial inclusion perceived by individuals are correlated with these individuals and country-level characteristics and some policy measures. Based on survey data in 123 countries of over 124 000 individuals, the authors focused on three indicators of accounts used in their analyses: ownership of an account, use of the account to save and the frequency of use (the number of withdrawals per month) arguing that, these indicators are associated with a ‘’better enabling environment for accessing financial services’’. The relationship between variables is interpreted as significant correlation rather than causation because of the cross-sectional nature of the data. In the relationship between individuals-level characteristics and the ownership of an account, the authors have found that, being in the richest income quintile, older, employed, married, living in urban areas and exceeding elementary education increases the likelihood of owning an account.
The same applies to the probability of using an account to save but the results are a little bit different from the likelihood of frequently using an account. In effect, referring to the likelihood of using an account to save, the probability of using it frequently is negatively correlated with gender while the latter does not affect the likelihood of using an account to save. For the relationship between country-level characteristics and the ownership of an account, higher level of branches or ATMs penetration, legal rights index, political stability rating and tax incentive schemes to encourage savings are positively and significantly related to the likelihood of owning an account whereas high costs of opening and using an account and greater disclosure requirements decrease the probability of owning an account. As in the case of individuals-level characteristics, factors that determine the ownership of an account and the use of an account to save are almost the same.
Results of the relationship between barriers to financial inclusion perceived by individuals and their socio-demographic characteristics indicate that, when people are poor, unemployed, less educated and live in rural areas, they are more likely to cite cost as barriers to account ownership whereas men and wealthiest are more likely to be excluded from formal financial system when they do not trust banks. Those who are less educated, rural residents and youth or single adults are more likely to cite lack of documentation as the reason why they do not have an account whereas the poor, elderly, urban residents and unemployed are more likely to report the lack of money as a barrier. Distance is more likely to be perceived by the poor, country people, married and less educated persons as the chief reason of their exclusion.
Clamara et al. (2014) have sought to identify demand-driven factors that influence households and enterprises’ likelihood to be financially included or excluded from the formal financial system and investigated how the unbanked self-reported barriers to financial inclusion are related to individuals-level characteristics in Peru.
With the 2011 Global Findex Survey data, the authors have constructed a proxy for financial inclusion which is defined as the likelihood for an individual or an enterprise to use financial services, considering that, a household or an enterprise is included in the banking system if he/it has received interest on one or more financial services, has a mortgage loan or has carried out online banking transaction. The dependent variable, proxy of financial inclusion is a binary variable that takes the value 1 if a household or an enterprise fulfills at least one of the three above mentioned conditions and 0 otherwise. Accordingly, probit models are used and estimates are provided at households and enterprises-levels. Households-level results, consistent with the findings of Allen et al. (2016) indicate that, being a rural resident, a woman or single and more people with a salary in the household (households tend to maintain constant the level of financial inclusion reached since financial products are not used in exclusivity by each household member) reduces households’ likelihood to use financial products whereas higher income and educational levels increase it.
Income, education and households’ residence appear to be the most important determinants of financial inclusion (in terms of the magnitude of their marginal effects) at households’ level in Peru. Other variables such as the ownership of a house, having a deficit increase also the likelihood of using financial services whereas living in small towns reduces it. At enterprises-level, higher literacy rate, achieved formalities for legal registration and being a formal enterprise increase enterprises’ likelihood to use financial products. Other factors, in particular; geographic factors (living in a small or big town) are not significant.
The results of the barriers to financial inclusion indicate that, excluded households with lower income and education level are more likely to report “distance to formal financial institutions branches” as a chief reason for their exclusion. The elderly on the one hand and youth on the other hand are more likely to respectively report “cost” and “document requirements” as being the barrier for their exclusion with a threshold effect at the age of 53. For the “lack of trust”, women have more trust in the banking system in Peru so that they are less likely to perceive lack of trust as a barrier than men. Finally, the results indicate that, poor individuals are more likely to report “lack of money” than the wealthy. While the results of Clamara et al. (2014) in Peru are informative, the variable proxy of financial inclusion used in the study may underestimate the use of financial services or products for households who fall in more than one of the conditions defined for the variable of interest. Along the same line, Cano et al. (2013) pointed out that, empirical studies sometimes fail to capture the extent of financial inclusion through indicators and so leading to a loss of information. In this respect, to avoid loss of information in the measurement of the level of financial inclusion, Pena et al. (2014) have constructed using multiple correspondence analyses, an indicator of financial inclusion which takes into account the ownership of both credit and savings products.
The authors through generalized non-linear method have identified factors that determine individuals-level financial inclusion in Mexico using the 2012 World Bank National Financial Inclusion Survey data. Their focus has been on the level of financial inclusion enjoyed by Mexican households and provided estimates for the joint indicator of credit and savings as well as for both credit and savings indicators separately. The results indicate that, individuals-level characteristics such as age, position in the household, education and marital status have a significant influence on the level of financial inclusion enjoyed by households with education as the most important variable explaining financial inclusion in Mexico. A threshold of 57.46 years old appears to be the age at which the level of financial inclusion begins to decline with age. Other variables such as the “ability to withstand shocks”, “savings” and “waged” have a positive and significant effect on the “aggregate” indicator of financial inclusion whereas living in municipalities influences negatively and significantly the indicator of financial inclusion. The results are almost similar to those of the credit indicator but diverge in the case of savings products indicator.
Instead of constructing an indicator of financial inclusion, as in Allen et al. (2016), Efobi et al. (2014) have considered three indicators of financial inclusion in their investigation of the determinants of access to and use of financial services in Nigeria based on the 2011 World Bank Households Survey data on financial inclusion. The authors have introduced in addition variables such as “financial discipline” and “ICT inclination” as explanatory variables. The introduction of ICT inclination is justified by the attention paid to ICT-based initiatives to promote financial inclusion in Nigeria whereas financial discipline in contrast represents to a certain extent, individuals’ innate “capability” to participate into the financial mainstream. Their results have indicated that, education, income and ICT inclination are the main determinants of financial inclusion at individuals-level in Nigeria. Indeed, higher education and income and ICT inclination increase the likelihood of owning an account and using it to save. These variables are also positively and significantly correlated with the frequency of withdrawals.
On the other hand, being a woman reduces the probability of owning an account in a formal financial institution in Nigeria. Individuals’ age is positively associated with the ownership of an account and its use to save but reaching a certain age reduces the likelihood of owning an account. Finally, financial disciple acts as a pull factor in accounts use to save and the frequency at which individuals use their accounts.The study by Rhine and Greene (2013) on the determinants of financial inclusion in the United States departs from other studies in their analysis of the dynamic process through which families bank status changes. Indeed, they attempted first to examine how changes in families’ attributes and circumstances contribute to changes in their bank status from being banked in one period to becoming unbanked in the following period.
Based on the 2004 longitudinal survey of income program participation, the authors have estimated a recursive bivariate probit model in which bank status in the later period is conditioned on the bank status in the initial period. Their findings suggest that, a family shift from the status of banked to unbanked is significantly influenced by declines in family income, by employment lost and by a loss of health insurance coverage. The results indicate also that race and ethnicity, level of education and family income, marital and housing status and geographic location play important roles in whether or not family exit the financial mainstream.
Data
The data for this study are from the World Bank Households Survey on financial inclusion (Gallup World Poll Survey, 2014). In the Gallup World Poll Survey (GWPS), up to 1000 individuals within the age of 15 and more are randomly selected in each WAEMU member country with country wide representation. For the 2014 GWPS, data are available in seven (7) WAEMU member countries namely Benin, Burkina Faso, Côte d’Ivoire, Mali, Niger, Senegal and Togo. Statistics reported in Table 1 indicate that, on average, only 22.87% of adults have reported having a bank account in WAEMU, a figure far from sub-Saharan Africa (SSA) benchmark (34% in 2014). Among these persons, only 9.05% have used their account to save in the past 12 month and 1.91% has withdrawn 3 or more times in a given month. The adults population comprise of 45.18% female and 54.52% male. Most of them have completed only primary education or less (68.88%) whereas few have completed tertiary education or more (1.90%). Across income quintiles, 28.38% are in the richest 20% income group. The rest of these adults are distributed as follows: poorest 20% (15.87%); second 20% (17.02%); middle 20% (17.71%); fourth 20% (21.02%).

In the GWPS, those who do not have an account are asked to report barriers that prevent them from accessing financial services by responding to the following question:
“Please tell me whether each of the following is the reason why you, personally do not have an account at a bank, credit union, or other financial institution”. The respondents are allowed to report multiple reasons. Among these reasons, we have: “(1) They are too far away”; “(2) They are too expensive”; “(3) You don’t trust financial institutions”; “(4) Because of religious reasons”; “(5) You don’t have enough money to use financial institutions”; “(6) You cannot get one”; ‘’ (7) You don’t need financial services’’.
The self-reported barriers (1), (2), (3) and (6) seem to stem from market failure and so can be considered as involuntary. On the other hand, the remaining barriers (4; 5 and 7) are voluntary. Table 1 shows that among the involuntary barriers, ‘’affordability’’ is the chief reason why individuals are excluded. Indeed, the most cited reasons are respectively ‘’cannot get one’’ (79.08%) and so they perceive that having an account is ‘’too expensive’’ (25.01%). Affordability is followed by the ‘’outreach’’ (24.24% have reported ‘’too far away’’ as the reason why they are excluded) and the ‘’lack of trust’’ (11.2%). For the voluntary reasons, most of people (61.29%) do not have enough money to use financial services, 13.51% do not need financial services and 6.85% are excluded because of ‘’religious reasons’’.
Identification of the determinants of financial inclusion
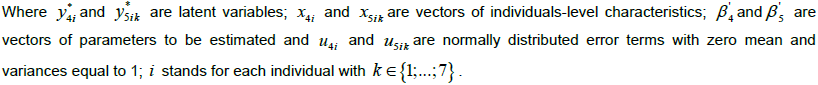
Measuring financial inclusion is made difficult because there is nounique definition of it and so there is not yet a consensual measure that captures in detail all dimensions of financial inclusion (Clamara et al., 2014; Kodan and Chikkara, 2013). In this paper, we are more concerned by the extent to which individuals-level characteristics influence the access to and use of financial services. Individuals have an access to the formal financial system if they have a bank account. But what empowers them is the effective use of their accounts. For instance, the use of a bank account to save might be associated with a better access to credit services. So, we consider three dimensions of the use of a bank account following the approach developed by Allen et al. (2016): the ownership of a bank account, the use of an account to save and the frequency of use of an account (frequency of withdrawals). The dependent variable “Have an account” is a binary variable. Therefore, we make use of a probit model to identify the determinants of ownership of a bank account:


Individuals-level characteristics include ‘’Age’’ and ‘’Age Squared’’ (which are both in years), ‘’female’’ (indicating whether the respondent is female or not), ‘’employed’’ (indicating whether the respondent is employed or not’’, ‘’Educational Status’’ which represents the highest completed level of education: primary, secondary or tertiary education (we create a dummy for each modality); ‘’Income quintiles’’ representing within-country income quintiles (we generate a dummy for each quintile). Other variables such as ‘’Individuals’ residence’’ (living in urban or rural area) and ‘’marital status’’ while relevant are not included in the analyses because of data limitation. Equation (1) will be estimated by maximum likelihood. The variable “use of account to save” is also a binary variable. So a simple probit model can also help in identifying individuals-level characteristics that acts as push or pull factors in their decisions to use their account for saving purpose:

for each individual. In contrast to variables “Have an account” and “use of account to save”, the dependent variable “frequency of use” represents the number of withdrawals per month. So, Allen et al. (2016) have defined the ‘’frequency of use’’ as a dummy variable that takes the value 1 if funds are withdrawn at least three times during a month and 0 otherwise. The model is as follows:


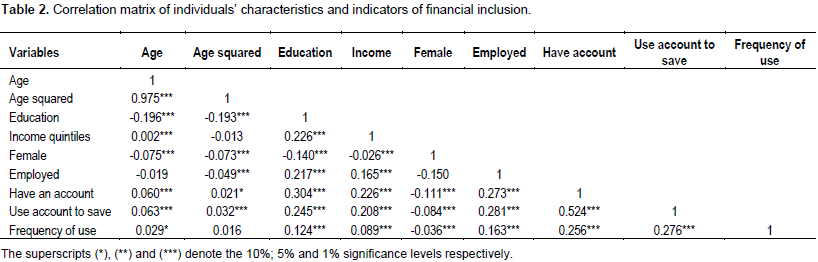
The aim of this paper is to determine the extent to which individuals’ characteristics act as push or pull factors in their decisions to use financial services and how self-reported barriers to financial inclusion are associated with these characteristics. We begin by investigating the correlation between variables. The correlation matrixes indicate that there is a significant relationship between individuals’ characteristics and the three indicators of financial inclusion on the one hand (Table 2) and between these characteristics and self-reported barriers to financial inclusion on the other hand (Table 3).

Determinants of financial inclusion
The results of the estimations of the relationship between individuals’ characteristics and the three measures of access to and use of financial services are reported in Table 4. Results reported in column 1 of Table 4 shows that the likelihood of owning an account is higher among the aged, men, employed, more educated and richest in WAEMU. Being a woman reduces the likelihood of owning an account by 3.6 percentage points compare to men whereas having completed tertiary education or more increases it by 47.6% points as compared to those who have completed primary education or less. The probabilities of owning an account for individuals who are employed and the richest are respectively 12.2 and 11.7% points higher than their counterparts (unemployed and poorest). The results of the likelihood of using account to save reported in column 2 of Table 4 are similar to those of owning an account (except for the fact that there is no a significant difference in the use of account to save between women and men) but to a lesser extent. For example, the probabilities of using an account to save for those who are unemployed and the less educated persons are respectively 7.1 and 12.7% points lower than those who are employed and the most educated persons.

The results of the likelihood of using account frequently reported in column 3 of Table 4 are also similar to those of using account to save (except for the variable ‘’income quintiles’’ where there is no a significant difference in the frequency of use of account among income groups). For example, the likelihood of using account frequently by respondents who have completed tertiary education or more is 5.2% points higher than those who report having completed primary education or less. In summary, variables such us age, sex, employment status, educational attainment and the level of income considered in this paper are all determinants of financial inclusion in WAEMU. In terms of the extent to which these variables matter for financial inclusion in WAEMU, the educational attainment matter more for financial inclusion, followed by employment status and the level of income. The variables ‘’sex of the respondents’’ and their ‘’age’’ play relatively a less important role in individuals’ participation in the financial mainstream in WAEMU. Our results are consistent with the findings of Clamara et al. (2014) in Peru and Pena et al. (2014) in Mexico while the indicators of financial inclusion used in these studies differ from one another.
Self-reported barriers to financial inclusion
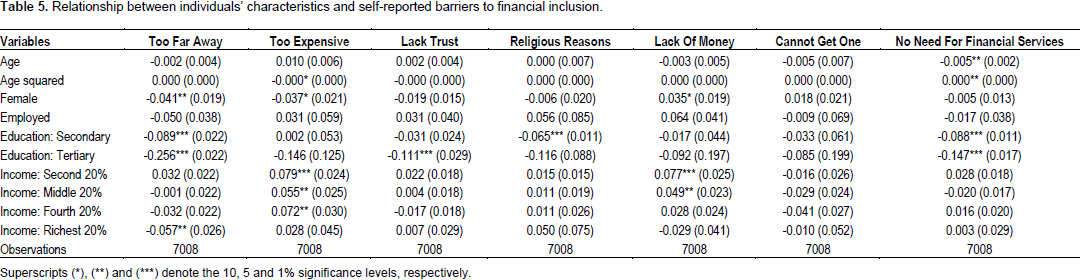
The sample of unbanked has been used to determine whether individuals’ characteristics affect the likelihood of reporting a specific barrier of account ownership. The results reported in Table 5 show that, while in Africa most of barriers are associated with Age (Zins and Weill, 2016), in WAEMU, only the likelihood of reporting ‘’no need for financial services’’ decreases significantly with Age. By contrast to the findings of Zins and Weill (2016), women are more likely to report not having enough money as the reason why they are excluded than men in WAEMU. While in the world the employment status is associated with barriers such cost and ‘’lack of money’’ (Allen et al., 2016), in WAEMU, it does not significantly affect the likelihood of reporting a specific barrier to financial inclusion. But, consistent with the findings of Zins and Weill (2016) in Africa, our results indicate that, Educational attainment is negatively associated with all barriers to financial inclusion in WAEMU and suggests that being less educated increases the likelihoods of reporting the above mentioned barriers to financial inclusion. Much in line with Allen et al. (2016), being a poor increases the probability of reporting distance, cost and ‘’lack of money’’ as barriers to account
ownership in WAEMU.

Since access to finance is crucial for economic growth and poverty reduction and remaining unbanked can irreversibly affect individuals’ financial well-being, understanding how individuals-level factors and self-reported barriers matter for financial inclusion can help in improving economic policy. In this paper, we have identified individuals’ characteristics that matter for financial inclusion and how self-reported barriers are associated with these characteristics in WAEMU where financial inclusion is set at the level of priority in the development agenda but in several dimensions of financial inclusion, countries of the union lag behind the SSA and Asian benchmark countries. The results of the determinants of financial inclusion indicate that, the variables, Age, Sex, Employment status, Educational attainment and income of the respondents are all determinants of financial inclusion in WAEMU. Globally, the educational attainment matter more for financial inclusion in WAEMU; followed by employment status and the level of income. The sex of the respondents and their age play relatively a less important role in individuals’ participation in the financial mainstream in WAEMU.
Our results, consistent with the findings of Allen et al. (2016), Clamara et al. (2014), Pena et al. (2014) and Zins and Weill (2016) suggest that, it is the most vulnerable segments of the society (youth, women, unemployed and the poorest) who are disadvantaged in the access to and use of financial services in WAEMU. The results of the relationship between self-reported barriers and individuals’ characteristics show that, among those who are excluded from the financial system in WAEMU, educational attainment and income are the main factors that significantly affect the likelihood of reporting a specific barrier to financial inclusion. The results have policy implications. In order to be possible to include financially more than 70% of adult population by 2020 in WAEMU, economic policy should put emphasis on promoting higher education and providing jobs to unemployed targeting youth, women and the poorest.
Moreover, as the “affordability’’ is the chief reason of individuals exclusion from the financial system in WAEMU, the actual implementation of the free banking services in WAEMU might be an effective policy in promoting financial inclusion in the union. But the study does not take into account country-level characteristics such as the institutional quality, legal rules, contract enforcement, political stability found by Allen et al. (2016) as determinant for individual-level financial inclusion because of data constraints. The study does not also take into account the issue of mobile banking which is now widely used in West Africa. For further research, as the mobile banking raises concern about the individuals’ characteristics using it (Zins and Weill, 2016), it will be of interest to investigating individuals-level determinants of mobile banking in WAEMU. Moreover, as the financial system in Africa is dualistic, even some people do not have an account in a formal financial institution, they can be to a certain extent included financially through informal finance. It will be important to look at alternatives sources for people’ inclusion in the overall financial system especially what determine the use of the informal finance in WAEMU.
The author has not declared any conflict of interests.
REFERENCES
|
Allen F, Demirguc-kunt A, Klapper L, Peria MM (2016). The Foundations of Financial Inclusion: Understanding Ownership and Use of Formal Accounts. J. Financ. Intermediation 27:1-30.
Crossref
|
|
|
|
Banque de France (2015). Les enjeux de l'inclusion financière en Zone franc in La Politique et les Agrégats Monétaires dans les Zones d'Emissions Africaines. Rapport Annuel de la Zone franc.
|
|
|
|
|
Beck T, de la Torre A (2006). The Basic Analytics of Access to Financial Services. World Bank Policy Res. P 4026.
Crossref
|
|
|
|
|
Beck T, Demirguc-kunt A, Peria MM (2007). Reaching out : Access to and use of banking services across countries. J. Fin. Econ. 85:234-266.
Crossref
|
|
|
|
|
Beck T, Demirguç-Kunt A, Peria MM (2008). Banking Services for Everyone ? Barriers to Bank Access and Use around the World. World Bank Econ. Rev. pp. 397-430.
Crossref
|
|
|
|
|
Bruhn M, Love I (2009). The Economic Impact of Banking the Unbanked. Evidence from Mexico. The World Bank Policy Research Working Paper. 4981 (June 2009).
|
|
|
|
|
Clamara N, Pena X, Tuesta D (2014). Factors that Matter for Financial Inclusion : Evidence from Peru. BBVA Research Working Paper, 14/09. Available at:
View
|
|
|
|
|
Demirgüç-kunt A, López E, Soledad M, Pería M, Woodruff C (2011). Remittances and Banking Sector Breadth and Depth : Evidence from Mexico. J. Dev. Econ. 95(2): 229-241.
Crossref
|
|
|
|
|
Efobi U, Beecroft I, Osabuohien E (2014). Access to and use of bank services in Nigeria : Micro-econometric evidence. Rev. Dev. Financ. 4(2):104-114.
Crossref
|
|
|
|
|
Ellis K, Lemma A, Rud J (2010). Financial inclusion, household investment and growth in Kenya and Tanzania''. ODI Project Briefings. 43:(43). Available at: www.odi.org.uk
|
|
|
|
|
Honohan P (2008). Cross-country Variation in Household Access to Financial Services. J. Bank. Financ. 32(11): 2493-2500.
Crossref
|
|
|
|
|
Kodan ASK, Chhikara KS (2013). A Theoretical and Quantitative Analysis of Financial Inclusion and Economic Growth. Manag. Labour. Stud. 38(1 & 2):103-133.
|
|
|
|
|
Kendall J, Mylenko N, Ponce A (2010). Measuring Financial Access around the World, World Bank Policy Res. pp. 5352.The World Bank.
Crossref
|
|
|
|
|
Pena X, Hoyo C, Tuesta D (2014). Determinants of financial inclusion in Mexico based on the 2012 National Financial Inclusion Survey (ENIF). BBVA Research Working Paper, 14/15 (June).
|
|
|
|
|
Rhine SLW, Greene WH (2013). Factors That Contribute to Becoming Unbanked. J. Consum. Aff. 47(1):27-45.
Crossref
|
|
|
|
|
Riquet C (2015). 20 Years of Financial Inclusion Progress in WAEMU, More to Come !, (December). Consultative Group to Assist the Poor.
|
|
|
|
|
Riquet C, Mbengue DM (2013). Deepening Financial Inclusion In West Africa, The Consultative Group to Assist the Poor (January).
|
|
|
|
|
World Bank (2014). Global Financial Development Report: Financial Inclusion. 1818 H Street NW, Washington DC 20433, the World Bank.
|
|
|
|
|
Zins A, Weill L (2016). The Determinants of Financial Inclusion in Africa. Rev. Dev. Financ. 6:46-57.
Crossref
|
|