Full Length Research Paper

ABSTRACT
Ecotourism is a recently emerged concept described as an ecologically friendly, economically and socially viable form of tourism. Its aims are to conserve the environment and local culture, and to ensure the major beneficiary and participation of local communities. This research aims to analyze the determinants of community based ecotourism and its livelihood impact in local community. 213 sample households consisting 107 program and 106 non-program groups were randomly selected from 5 program and 5 counterfactual kebeles, respectively. Primary data were collected through questionnaires, interviews, field visits and focused group discussions. Results of the impact evaluation model (PSM) after eliminating the difference between the two groups revealed significant difference between program and non-program households in terms of total net household income and tourism service revenue. It can be concluded that the impact of the program intervention among participants have much influence on their livelihood. The result of logistic model regression on the factors influencing livelihood showed that the two were affected by the same set of variables except age and family size which positively affected income and productivity separately and respectively. Whereas, ownership of land and livestock, awareness and being concerned for natural resources and access to credit were found to increase net income significantly. Therefore, ecotourism program policy interventions should consider the aforementioned factors influencing households’ tourism income to create positive impact on the livelihood of farm households. The participation and collaboration of different ecotourism stakeholders is suggested to promote community based ecotourism program and its role in the area.
Key words: Ecotourism, livelihood, propensity score matching.
INTRODUCTION
Community-based ecotourism is a way of conservation and tourism development which emerged in the 1980s through escalating protests and subsequent dialogue with local communities affected by international attempts to protect the biodiversity of the earth. This is due to older conservation movements that disregarded the interests of local inhabitants (Brockington, 2002). The essence of classical conservation was to protect wilderness and wildlife areas of pristine wilderness that were largely untouched by humans. All people inhabiting these areas were removed from the land and displaced onto marginal land surrounding or nearby the newly protected land. It is estimated that 20 million people were displaced from their land (Veit and Benson, 2004).
In 1975 the International Union for Conservation of Nature (IUCN) and the World Parks Congress recognized the rights of indigenous people and to recognize their rights to the protected areas (Cholchester, 2004). Understanding people–ecosystem interactions is important in conservation (FairHead and Leach, 1996). In different parts of the world, humans and ecosystems have co-evolved, which has led to the development and refinement of local and traditional knowledge and management strategies through constant adaptation and learning. One strategy of community-based conservation is co-management of a protected area (Child and Jones, 2006).
Local communities’ engagement is essential to have a goal and to work together in activities related to ecotourism that promote conservation as well as their benefits. While groups can contain mutual, overlapping and divergent interests and perspectives, the goal binds people together giving them a common identity despite individual differences (Forgie et al., 2001). A wide range of motivations can lead to establishment of community conserved areas; these include: concern for wildlife protection; to secure sustainable access to livelihood resources to obtain sustainable benefits from ecosystem benefits; to sustain religious, identity or cultural needs, to secure collective or community land tenure, to obtain security from threats, and to obtain financial benefits. On the other hand, these areas are critical to an ecological and social perspective in many ways. They help in conservation of threatened species, provide corridors and linkages, offer lessons in integrating customer and statutory laws, help communities in empowering themselves etc (IUCN, 2006).
Concerns over the application of community in natural resource management demonstrate the need to rigorously examine partnering communities to understand how social differentiation shapes the effectiveness of these initiatives. This is made all the more necessary with the rising critique from some sectors as to the social and ecological effectiveness of community conservation.
Public participation in scientific assessments adds local and indigenous perspectives to scientific knowledge (Funtowicz and Ravets, 1990). Assessments with local participation are able to incorporate a more pluralistic, increase public confidence in scientific findings, and ensure representativeness in scientific processes (Backstrand, 2004).
Ecotourism has become one of the fastest growing segments of the tourism industry in the world (UNWTO, 2001). The declaration of the year 2002 as International Year of Ecotourism by the World Tourism Organization reflects the importance of ecotourism in the global industry. It provides better linkages, reduces leakages of benefits out of a country, creates local employment, creates multiplier effects and fosters sustainable development and greater impact on biodiversity conservation (Khan, 1997; Belsky, 1999). However, the roles of community-based ecotourism benefits in Ethiopia are insignificant as compared to the various resources the country has. The tourism industry in Ethiopia is mainly associated with historical and cultural attractions and the contribution to employment opportunities; foreign exchange earnings and improving the welfare of local people (Gezon, 1997; Mbaiwa, 2003) are inadequate. Hence, community-based ecotourism has been given much attention in Ethiopia in general and Adaba-Dodola in particular due to its importance in conservation and local people’s livelihood improvement.
The popularity of community ecotourism is largely attributable to the impacts on local people livelihoods and the rise of sustainable development as the guiding discourse for environment and development planning. It has the potential to become a driver of sustainable tourism development providing opportunities for the development of the disadvantaged, marginalized and rural areas. It plays a vital role in poverty alleviation and generating income for local communities without destroying the environment (Ceballos, 1996). It stimulates economic development and social wellbeing of people and at the same time preserving the natural environment and cultural heritage through awareness creation (Isaac et al., 2012). Adaba-Dodola community based ecotourism is, established 1995 with the help of GTZ, one of the ecotourism sites mainly managed by involvement of local communities. Its objective was to improve the local communities’ livelihood through ecotourism in which the income was generated from tourists. There is variation in terms of local communities’ engagement in this ecotourism project by participants and non-participants.
However, there are local communities that have not yet been involved in ecotourism activities and even the level of household involvement varies from one kebele to another. Moreover, the forest coverage in different kebeles also varies. Hence, the overall perspective of this study is to determine the effect of ecotourism on livelihood of local communities in comparison between participant and non-participant and among households of different kebeles. Hence, understanding the livelihood effect of community based ecotourism between participants and non-participants as well as among different kebeles is essential for better participation and benefit of local communities. Moreover, there was no detailed investigation made to identify the effect of community-based ecotourism on livelihood of local communities. Therefore, this particular study aims to investigate the contribution and impact of community based ecotourism activities on livelihood of local communities in the Adaba-Dodola area.
THEORETICAL FRAMEWORK
One of the fundamental interests of impact studies in adoption of technologies is whether a particular intervention, as designed, is effective in accomplishing its primary objectives. However, the estimation of the impact of adoption of policies or technologies based on non-experimental observations is not an easy task. The main challenge of a credible impact evaluation is the construction of the counterfactual outcome, that is, what would have happened to participants in absence of treatment (Heinrich et al., 2010). Since this counterfactual outcome is never observed, it has to be estimated. In experimental studies, this problem is addressed by randomly assigning improved seeds to treatment and control status, which assures that the welfare outcomes observed on the control households that adopt improved technology are statistically representative of what would have occurred without adoption. However, improved technology is not randomly distributed to the two groups of the households (adopters and non-adopters), but rather the households themselves decide to adopt or not to adopt based on the information they have. Therefore, adopters and non-adopters may be systematically different.
Several methods have been used to study impact of ecological changes in different countries. In Lesotho, Kaliba and Rabele (2004) and in Philippines, Shively (1998a, b) have used linear regression to study impact of short- and long-term soil conservation measures on wheat yield and contour hedge rows on yield, respectively. Shiferaw and Holden (2001) have used cost benefit analysis on experimental trials to study the impact the Soil Conservation Research program in two high rainfall highland sites in Ethiopia. Numerous researchers have used econometric analysis and cross sectional survey data to estimate the impacts of policy measures in the different parts of Ethiopian highlands (Holden et al., 2001; Benin, 2006; Kassie and Holden, 2006; Pender and Gebremedhin, 2006).
These studies, however, suffer from a number of methodological problems, which can either under or overestimate impacts of participatory eco-tourism on livelihood. First, comparisons are not based on comparable observations, which can yield biased estimates (Heckman et al., 1998). Second, all studies assume a single equation model where resource use change has only intercept effects and the same set of variables equally affect both participants and non- participants, without testing this assumption empirically. Third, none of the studies account for unobserved heterogeneity that might impact results. For example, in addition to having the limitation of small sample size (50 households), Kaliba and Rabele (2004) did not control for social group characteristics. If there is asymmetric distribution in group change across social groups and households and correlation between livelihood improvement and group attributes, estimation of participatory eco-tourism impacts on livelihood may lead to inconsistent estimates. Other studies also do not consider the effects of important variables, such as group decision making networks and migration characteristics.
The matching approach is one possible solution to the selection problem. It originated from the statistical literature and shows a close link to the experimental context. Matching applies for all situations where one has a treatment, a group of treated individuals and a group of untreated individuals. These include; double difference or difference-in-difference (DID) reflexive comparison and propensity score matching (PSM). Propensity score matching (PSM) has become a popular approach to estimate causal treatment effects and increasingly applied in the policy evaluation community (Baumgartner and Caliendo, 2008; Heinrich et al., 2010). According to matching theory (Rosenbaum and Rubin, 1983; Jalan and Ravallion, 2003; Bryson et al., 2002), the logit model via which the propensity score is generated should include predictor variables that influence the selection procedure or participation in the program and the outcome of interest. Several factors guide selection of predictor variables. In the present study, explanatory variables of the logit model will be identified using findings of previous related empirical studies, project selection criteria, and own field observation.
We will include as many explanatory variables as possible to minimize the problem of unobservable characteristics in our evaluation of the impact of the program. Accordingly, variables that determine households’ decision to participate in the participatory Eco-tourism activities that will affect the outcome variable, that is, livelihood index/household income are included. In other word, variables which are not affected by being participant in the program or not or those explanatory variables which are fixed throughout are assumed to be used as explanatory variables. Based on economic theory and knowledge about previous research and also information about the institutional settings socioeconomic, demographic, and institutional and household and community level factors are hypothesized to determine participation. Detailed description of the variables-related hypothesis is presented in the Definition of variables and working hypothesis section.
The second stage in the PSM procedure is choosing a matching algorithm that will use the estimated propensity scores to match untreated units to treated units. There are several matching algorithms; however we will present in literature review part the most commonly used for comparison purpose. However we will select the best fitted one for our case. To estimate the impact of program intervention, following the literature of program evaluation, let Y1 be the livelihood index when the individual I is subject to treatment (C=1) and Y0 the same variable when an individual is exposed to the control(C=0). The observed outcome is

.png)
METHODOLOGY
Adaba-Dodola is found in the South east part of Ethiopia 310 km from Addis Ababa by road. Adaba-Dodola community based ecotourism development project was initiated in 1995 to develop a replicable model for the conservation and sustainable use of biodiversity in Ethiopia. The project is concerned with the unregulated access to the natural forests. In the past, all attempts to regulate access have failed. The forest priority area of Adaba-Dodola is located on the northern slopes of the Bale Mountains and its size was decreased by 3% per year due to unregulated access by wood collectors and livestock herds. Although the area is among the forest priority areas of the country, overexploitation of timber and firewood as well as increasing demand of farmland and overgrazing endanger the survival of the forest. The area was highly encroached by the surrounding communities and it was on the verge of total degradation when the project was started. With an objective of alternative source of income, five ecotourism lodges which are managed by local communities were established. The project is involved in activities which generate income through eco-tourism management. Towards the fulfillment of this, it has constructed lodges and trekking routes. It also provides camping sites, horses, tents, guides and others. These services are addressed to tourists who are interested in sightseeing, mountain trekking, hunting and looking traditional way of life. Due to the project, the proportion of the natural regeneration has been getting highest attention and the locals are starting to manage the resource properly (Sisay, 2004).
For this specific study, our target groups was the two (Adaba and Dodola) districts, culture and tourism office, Oromia forest and wildlife enterprise, and indigenous local communities. Stratified random sampling technique was employed to select the sample households from the participant and nonparticipant groups. Adaba and Dodola districts comprise 35 kebeles in which 18 of them are from Adaba and 17 of them from Dodola. From these, 6 kebeles are currently involved or they are direct participants in activities of community based ecotourism using legal system and 29 of the kebeles are not involved or non-participants in the community based ecotourism activities. From the 6 kebeles, 5 of them are in Dodola and 1 in Adaba is currently involved in the ecotourism development activity. From these 6 (4 from Dodola and 1 from Adaba) kebeles from the two districts were selected purposely based on coverage of forest area, time of establishment and total number of households involved for better comparison among different kebeles. For the comparison of CBE effect determination on the livelihood of participant with non-participant groups, 5 kebeles from 29 kebeles of non-participant groups were randomly selected.

To maintain higher representativeness of the sample the PPS technique were applied. However, the total sample size will be determined based on a Cochran (1977) formula: The total number of households found in target sample kebeles both in participant and non-participant kebeles were 3362 households (Table 1) (OFWE, 2013). The sample size for the participant and non –participant kebeles was determined based on the following equation.
Data collection
Data were gathered using interviews, household survey, and site visits and focused group discussion. Secondary data were obtained from Oromia forest and wildlife enterprise offices of Adaba-Dodola branch, culture and tourism office of Adaba and Dodola districts and other concerned organs. For the sake of getting adequate and relevant information about the impact of community based ecotourism on the livelihood of local communities, observation of people going about their daily activities for their livelihoods, an overview of the local market, shops and any commodities exchange were conducted. Moreover, observations of what people have and do not have, and who does what, local price information (e.g. price of staple foods), exploration of what local people buy and sell, when and for how much, will assessed for livelihood analysis. General interviews were carried out with communities from participants as well as non-participants of community based ecotourism activity. Accordingly, we interviewed the manager of Adaba-Dodola district forest and wild life enterprise, chairman of the tour-guide association, general manager of the farmers union and other stakeholders. General discussion about livelihoods, resources, changes; problems were discussed with these key informants of local communities in both groups. Household surveys were carried out to gain comparable data to allow for quantification, and to reach a representative sample. For this matter semi-structured questionnaire was prepared and one to one interview was used to get important details about livelihood impact from the target respondents and it was administered by 10 interviewers for 213 respondents (106 non participants and 107 Participants).
Financial data were gathered by going through project records, enterprise records, receipt books and discussing incomes or uses of income with household members. Number of members in employment of ecotourism activities was also recorded. Assessment of institutional change, in particular, will be discussed using open-ended conversations with people to identify changes and continuity over time. Subsequently, household survey was also developed for the sake of having the demographic, socio-economic characters of the households to assess the major determinant impact of ecotourism development in the livelihood. Finally, to identify the attitude and perception of participant and non-participant household’s Likert scale techniques were employed. Based on Trochim (2003)’s recommendation as a tool two FGDs were conducted on each target groups (Four FGD for the whole study) by selecting respondents from both groups. In each FGD one community leader, four elders of villages, and one officer from the community based ecotourism program, one expert from wildlife and forest enterprise of the districts, one from culture and tourism office of each district, government administrators, one from female association, were selected and discussed on changes, problems, historical perspective and the effects of the ecotourism development on their well-being.
Data analysis
The study used descriptive and inferential statistics, and econometric models to analyze the collected data and address the stated objectives. Descriptive statistics were used to describe community based ecotourism activities, practices and the institutional arrangement followed in the study area. Inferential statistics were important in defining relationships between variables considered to draw relevant conclusions about the population. This method of data analysis refers to the use of percentages, mean, standard deviations and test of significance in the process of comparing socio-economic and institutional characteristics of the participant and non-participant households in the study areas. Before running the PSM or MLR with respect to the study objective data were checked for outliers, collinearity and heteroscedasticity. Accordingly, the existence of outliers was checked using SPSS explore method (Gujarati, 2002). Then, we employed PSM approach to estimate the impact of CBECT in livelihood. In the first step the propensity score was estimated with a simple binary choice model; logit or probit. As described by Rosenbaum and Rubin (1983), matchings were performed conditioning on P(X) alone rather than on X, where P(X) = Prob(D=1|X) is the probability of participating in the program conditional on X. If outcomes without the intervention are independent of participation given X, then they are also independent of participation given P(X). This reduces a multidimensional matching problem to a single dimensional problem. A logit model will be used to estimate propensity scores using a composite of pre-intervention characteristics of the sampled households (Rosenbaum and Rubin, 1983) and matching was then performed using propensity scores of each observation. In estimating the logit model, the dependent variable was participation, which takes the value of 1 if a household participated in the program and 0 otherwise. The mathematical formulation of logit model is as follows:


Moreover, in this study we used multiple linear regression models because we were interested only in the behavior of matched participant households which results in continuous response. MLR was employed to assess the factors that determine the net effect of CBET among beneficiary groups (factors responsible for determining the variability of the impact were assessed). The outcome variable considered in this study was livelihood status in terms of household income per year.
RESULTS AND DISCUSSION
Overview of the study
The results of the descriptive and inferential analysis of 213 households consisting of 107 CBECT program and 106 non-program households show that there were statistically significant differences between program and non-program households before intervention with regard to the social-demographic characteristics. The sampled groups differ in terms of sex, age, family size and farm size (Table 2). As indicated in our sampling design, and result of the study revealed in Table 3 respondents were selected from both districts of the study area.
Table 4 indicates that there was statistically insignificant association among program and non-program households in terms sex of household head before CBECT program intervention. However, male heads dominate the program non-program group households. There was no statistically significant difference between the two groups in terms of gender. On the other hand we found statistically significant difference (p< 0.01) between the two groups in terms of respondents’ religion. The Pearson chi2 (3) value in Table 4 indicates the strong associations between respondents’ religion before matching.
Among the continuous variables shown in Table 4 the two groups differed in terms of age, family size and farm size. The CBECT program households were significantly (p<0.1) older than the non-program group. The program group had significant (p<0.01) larger family and farm size. Educational status of the household head (EDUHH): In this part educational status of the household heads in relation to household participation in the program was assessed. Accordingly, 62.5% of total sample respondents were illiterate of which program households represent 37.5%. On the other hand from the total 37.5 literate households the non-program was 25%. The t-Value value (-0.615) for this variable indicates that there is significant difference in educational status of the household head between program and non-program households (Table 5).
Farm characteristics: Land holding and tenure system
The average land cultivated by the sampled CBECT program and non- program households was found to be 2.98 ha and 2.49 ha, respectively (Table 6) and there was significant difference between the two groups in terms of all land tenure systems considered, that is cultivated own, rented and shared land. Cropping pattern has been defined as the list of crops that are produced in a given area and their sequence within a year (Sarker et al., 1997). On the other hand we found statistically significant mean difference of protected land coverage across both groups. On average around 0.05 ha land was found as a protected area in both districts.

Household income and livelihood
Table 7 shows the mean difference in outcome variables before matching. Program and non-program households have significant difference in terms of all outcome variables considered, that is, gross and net CBECT income, and gross and net household income as one of the finical component of household livelihood. However, this descriptive result cannot tell us whether the observed difference is exclusive because of the program; as comparisons are not yet restricted to households who have similar characteristics. Hence, further analyses were performed using propensity score matching techniques to address this issue.
Econometric model outputs: Propensity score matching
This section describes the results of econometric analyses. It is divided into two sub-sections. The first part deals with the impact of CBECT program using propensity score matching method. The important analytical steps followed include determination of propensity scores, matching methods, common support region and balancing test and estimation of treatment effect. The second part pertains to the result of a multiple regression model identifying factors affecting the impact of the CBECT program. Propensity score matching is a method that uses information from a pool of units that do not participate in the intervention to identify what would have happened to participating units in the absence of the intervention. The method was used to compare the two groups in terms of CBECT program outcomes. The following procedures were employed to determine the impact of CBECT program with respect to the chosen outcome variables (Livelihood in terms of its financial component, that is, household income).
The first step taken to evaluate impact of CBECT policy net household income was estimation of propensity scores based on the selected covariates. Logistic regression model was employed to estimate propensity scores for matching treatment household with control households. The dependent variable in this model was a dummy variable indicating whether the household has been in the of CBECT program which takes a value of 1 and 0 otherwise. Before and after estimation of the propensity score and the logistic model appropriate diagnostic measures were used on the data and the hypothesized variables. Accordingly the tests for outlying observations, heteroscedasticity, and mullticollinearity and post estimation for model specification, goodness of fit and omitted variables were done. Outlying observations with extreme influence (residual value of >2.5) were removed from analyses. To this effect 10 observations were discarded. Results of multi-collinearity test showed that there was no serious problem of multicollinearity detected (Appendix Table 1).
Similarly, the test for the presence of heteroscedasticity using Breusch-Pagan test showed that there was no heteroscedasticity problem at 5% probability level (p= 0.67) and a further comparison of the standard errors showed that there was no difference between the two cases.

Hence other methods were not needed to correct the problem of heteroscedasticity. Results of post estimation tests showed that the model performed well. The model in general was significant at 1% level of significance showing the appropriateness of the model for estimation. The goodness-of-fit test using Hosmer–Lemeshow also yielded 6.85 and was insignificant (p=0.55), suggesting that the model was fit to explain the relationship well. The model was also checked for model specification using link test and results indicated that there was no such problem (p=0.66).
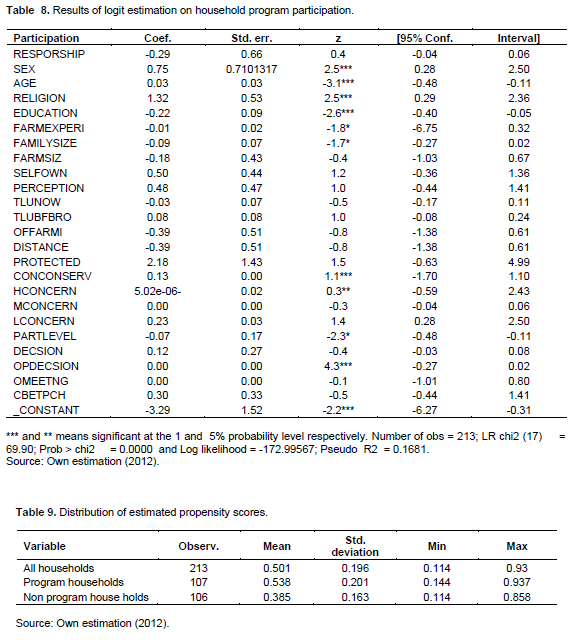
Before matching logit estimation shows that program participation status has been significantly influenced by six variables (Table 8). Sex of household head, farming experience, family size, and farm size and concern to conserve and social participation level were found to significantly affect the probability of adopting of CBECT program. Sex of household head, farming experience and family size influenced the probability of CBECT participation positively and significantly at 1%; whereas, livestock ownership, off-farm income and age determined participation negatively and significantly at p<0.01. On the other hand ownership of large farm size and livestock affected participation negatively at 5% significance level.
Matching program and non-program households
The estimated propensity scores enable us to define the common support region. Heckman (1997) point out that a violation of the common support condition is a major source of bias as conventionally measured. The basic criterion for determining the common support is to delete all observations whose propensity score is smaller than the minimum of the program and larger than the maximum in the opposite group (Caliendo and Kopeining, 2008).

The estimated propensity scores as shown in Table 9 vary between 0.144 and 0.937(mean = 0.538) for program households and between 0.114 and 0.858 (mean = 0.385) for non-program households. Therefore our common support region would then lie between 0.144 and 0.858. As a result of this restriction, 8 households (6 program and 2 control households) were dropped from the analysis in estimating the average treatment effect.
Choice of matching algorism
Nearest neighbor, Caliper and Kernel matching estimators were used in matching the treatment and control households in the common support region. The final choice of a matching estimator was guided by three criteria namely: the equal mean test (balancing test), pseudo- R2 and matched sample size (Caliendo and Kopeining, 2008). The balancing test refers to the test of equality means of covariates after matching (Dehejia and Wahba, 2002), that is before matching differences are expected; but after matching the covariates should be balanced in both groups and significant differences should be found. The pseudo- R2 indicates how well the regressors explain the participation probability. After matching there should be no systematic differences in the distribution of covariates between both groups and therefore the pseudo- R2 should be fairly low. In general, a matching estimator which balances all explanatory variables (results in insignificant mean differences between the two groups), bears a low pseudo-R2 value and also results in large matched sample size is preferable. Table 10 presents the estimated results of tests of matching quality based on the three above-mentioned performance criteria. Based on the criteria set above, caliper matching with tolerance level of 0.25 was found to be the best matching algorithm for the data we have. In what follows estimation results and discussions are the direct outcomes of the caliper radius matching algorithm with tolerance level of 0.25.
Testing the balance of propensity score and covariates
In order to compare two different groups, observations with the same propensity score must have the same distribution of observable (and unobservable) characteristics independently of the treatment status (Becker and Ichino, 2002).
Based on this theory the balancing test of propensity scores and covariates was done. The results in Table 10 show that treatment and control households had significant difference for most of the covariates before matching. However, t-tests revealed that most of the covariates became insignificant after matching.

CONCLUSION AND RECOMMENDATIONS
Descriptive and inferential statistics, propensity score matching and multiple linear regression models were used to meet the stated objectives. The results of the descriptive and inferential statistics showed that there was significant difference between program and non-program households in terms of sex and age of household head, family size and farm size. The estimation of the impact of CBECT intervention on livelihood/household income showed that sex of household head, farming experience, family size, farm size and livestock ownership have been the major factors of group difference. The result of the estimation of the impact of CBECT showed that there was statistically significant difference between program and non-program farmers in terms of the outcome variable considered, that is, gross and net household income. This result was not expected as the CBECT interventions were carried out based on the premises of reducing soil and nutrient lose and increasing productivity and income. However, considering the long-term impact of CBECT technologies, the observed positive sign may be taken as good start for the realization of the expected benefits of the CBECT technologies for promoting the livelihood of the poor smallholder farmers. Assessment of the respondents’ perception and physical conditions of the area such as participation willingness and Asset profile constitute evidence for the possible contribution of CBECT intervention.
Therefore, it was necessary to identify what other factors were governing farmers’ income and productivity. Multiple linear regression models were employed for this purpose. Results indicated that some variables were found to affect only net crop income positively and significantly; whereas ownership of land and livestock and extent of contacts with extension workers were found to increase both annual income and livelihood significantly. However, participation in CBECT activities, ceteris paribus, failed to affect net income and livelihood index. This finding was also supported by result obtained from the PSM model that showed no statistically significant difference between program and non-program in terms of household’s income and livelihood status. In general we may conclude that demographic characteristics, ownership of resources, input usage and access to credit affect the outcome variables rather than the adoption of CBECT “technologies”.
CONFLICT OF INTERESTS
The authors have not declared any conflict of interests.
REFERENCES
|
Aldrich JH, Nelson FD (1984). Linear probability, logit, and probit models (No. 45). Sage. |
|
|
Backstrand K (2004). Civic science for sustainability: Reframing the role of scientific experts, policy- makers and citizens in environmental governance. In: Proceedings of the 2002 Berlin Conference on the Human Dimensions of Global Environmental Change ''Knowledge for the Sustainability Transition. The Challenge for Social Science'' (Biermann F, Campe S, Jacob K eds.). Global Governance Project, Amsterdam, Berlin, Potsdam, and Oldenburg pp.165-174. |
|
|
Baumgartner HJ, Caliendo M (2008). Turning Unemployment into Self-Employment: Effectiveness of two start?up programmes. Oxford Bulletin of Economics and Statistics 70(3):347-373. |
|
|
Becker SO, Ichino A (2002). Estimation of Average Treatment Effects Based on Propensity Scores. Stata Journal 2(4):358-377. |
|
|
Belsky J (1999). Misrepresenting communities: The politics of community-based rural ecotourism in gales point manatee, Belize. Rural Sociology 64(4):641-666. |
|
|
Benin S (2006). Policies and programs affecting land management practices, input use and productivity in the highlands of Amhara region, Ethiopia. In: Pender J, Place F, Ehui S. (eds)., Strategies for Sustainable Land Management in the East African Highlands. International Food Policy Research Institute, Washington, D.C. |
|
|
Brockington D (2002). Fortress Conservation: The Preservation of the Mkomazi Game Reserve Tanzania International African Institute Oxford. |
|
|
Bryson A, Purdon S, Dorsett R (2002). The use of propensity score matching in the evaluation of active labour market policies. London: Policy Studies Institute and National Centre for Social Research. |
|
|
Caliendo M, Kopeinig S (2008). Some Practical Guidance for the Implementation of Propensity Score Matching. Journal of Economic Surveys 22(1):31-72. |
|
|
Ceballos-Lascurain H (1996). Tourism ecotourism and protected areas IUCN-The World Conservation Union Gland. |
|
|
Child B, Jones B (2006). Practical tools for community conservation in southern Africa Participatory Learning and Action 55:342-360. |
|
|
Cholchester M (2004). Conservation Policy and Indigenous Peoples Environmental Science and Policy 7(3):145-153. |
|
|
Cochran WG (1977). Sampling technique 3rd edition. Wiley New York. |
|
|
Dehejia RH, Sadek W (2002). Propensity score-matching methods for nonexperimental causal studies. Review of Economics and statistics, 84(1):151-161. |
|
|
Fairhead J, Leach M (1996). Enriching the landscape: Social history and the management of transition ecology in the forest-savannah mosaic of the Republic of Guinea Africa 66(1):14-36. |
|
|
Fikru A (2009). Assessment of Adoption Behavior of Soil and Water Conservation Practices in the Koga Watershed Highlands of Ethiopia An MSC Thesis presented to Cornell University. |
|
|
Forgie V, Horsley P, Johnston J (2001). Facilitating community-based conservation initiatives Science for Conservation 169:6-76. |
|
|
Franzel S, Coe R, Cooper P, Place F, Scherr SJ (2001). Assessing the adoption potential of agro forestry practices in sub-Saharan Africa Agricultural System 69(1-2):37-62. |
|
|
Funtowicz S, Ravets JR (1990). Uncertainty and Quality in Science for Policy Kluwer Academic Dordrecht. |
|
|
Gezon L (1997). Institutional structure and the effectiveness of integrated conservation and development projects: case study from Madagascar Human Organization 56:462-470. |
|
|
Gujarati DN (2002). Basic Econometrics. 2nd Edition McGraw Hill Incorporated. New York. |
|
|
Heckman J, Ichimura H, Smith J, Todd P (1998). Characterizing Selection Bias using Experimental Data Econometrica 66(5):1017-1098. |
|
|
Heckman J (1997). "Instrumental Variables A Study of Implicit Behavioral Assumptions Used in Making Program Evaluations" Journal of Human Resources 32(3):441-61. |
|
|
Heinrich C, Maffioli A, Vázquez G (2010). A Primer for Applying propensity-score matching. Impact-Evaluation Guidelines, Technical Notes No. IDB-TN-161. |
|
|
Holden ST, Shiferaw B, Pender J (2001). Market imperfections and profitability of land use in the Ethiopian Highlands: a comparison of selection models with heteroskedasticity. Journal of Agricultural Economics 52(2) 53-70. |
|
|
International Union for Conservation of Nature (IUCN) (2006). Community conserved areas IUCN Gland. |
|
|
Isaac M, Conrad J, Wuleka J (2012). Community-Based Ecotourism and Livelihood Enhancement in Sirigu Ghana International Journal of Humanities and Social Science 2(18):97-108. |
|
|
Jalan J, Ravallion M (2003). "Income Gains from Workfare: Estimates for Argentina's TRABAJAR Program Using Matching Methods" Washington DC: Development Research Group World Bank. |
|
|
Kaliba ARM, Rabele T (2004). Impact of Adopting Soil Conservation Practices on Wheat Yield in Lesotho In: Bationo A (eds) Managing Nutrient Cycles to Sustain Soil Fertility in Sub-Saharan Africa Tropical Soil Biology and Fertility Institute of CIAT. |
|
|
Kassie M, Holden TS (2006). Parametric and Non-parametric estimation of soil conservation adoption impact on yield Contributed paper prepared for presentation at the international Association of Agricultural Economists Conference Gold Coast Australia. |
|
|
Khan MM (1997). Tourism development and dependency theory: mass tourism vs ecotourism. |
|
|
Mbaiwa JE (2003). The socio-economic and environmental impacts of tourism development on the Okavango Delta northwestern Botswana Journal of arid environments 54(2):447-467. |
|
|
Pender J, Gebremedhin B (2006). Land Management Crop Production and Household Income in the Highlands of Tigray Northern Ethiopia: An Econometric Analysis In: Pender J, Place F, Ehui S (eds) Strategies for Sustainable Land Management in the East African Highlands International Food Policy Research Institute Washington DC. |
|
|
Rosenbaum P, Rubin D (1983). "The Central Role of the Propensity Score in Observational Studies for Causal Effects" Biometrika 70(1):41-55. |
|
|
Sarker RA, Talukdar S, Haque AA (1997). Determination of optimum crop mix for crop cultivation in Bangladesh. Applied Mathematical Modelling 21(1):621-632. |
|
|
Shiferaw B, Holden ST (2001). Farm-level benefits to investments for mitigating land degradation: Empirical evidence from Ethiopia. Journal of Environment and Development Economics pp. 335-358. |
|
|
Shively GE (1998a). Modeling impacts of soil conservation on productivity and yield variability: Evidence from a heteroskedastic switching regression Selected paper at annual meeting of the American Agricultural Economics Association 2-5 August 1998 Salt Lake City Utah. |
|
|
Shively GE (1998b). Impact of contour hedgerow on upland maize yields in the Philippines Agro forestry systems 39(1):59-71. |
|
|
Sisay A (2004). Adaba-Dodola community-based ecotourism development. A report paper pp. 1-14. |
|
|
Soule JM, Tegene A, Wiebe DK (2000). Land tenure and the adoption of soil conservation practices. American Journal of Agricultural Economics 82(4):993-1005. |
|
|
Tadesse M, Belay K (2004). Factors Influencing Adoption of Soil Conservation Measures in Southern Ethiopia: The Case of Gununo Area. Journal of Agriculture and Rural Development in the Tropics and Subtropics 105 (1):49-62. |
|
|
UNWTO (2001). Compendium of Tourism Statistics; UNWTO Madrid. |
|
|
Veit PG, Benson C (2004). When Parks and People Collide Carnegie Council for Ethics in International Affairs Elsevier Limited Texas. |
|
Copyright © 2024 Author(s) retain the copyright of this article.
This article is published under the terms of the Creative Commons Attribution License 4.0


