ABSTRACT
The present study was carried out in two grass land of Kumrat Dir Kohistan, North Hindukush regions of KPK Pakistan. Locally these two grass land are known as Roshi Dab and Bothore Dab. The area of these two Dabs is about 400 hectare. The elevation of these two Dabs ranges from 7665 feet to 7954 feet while the geographic location of the study site was N 35° 33.249’ and E 72° 12.258’. Stratified random sampling method was used for data collection. 18 soil samples were taken with the depth of 0-15 cm and 16-30 cm. The average soil pH was 5.3. The mean soil bulk density was 1.107 -g/cm3. In present study it was found that the undisturbed range land stored maximum amount of soil carbon (32.69 tons hac-1) as compare to range land near to the agriculture land (29.77 tons hac-1) Similarly the rangeland near to forest land stored 35.62 t ha-1 carbon, also stored more carbon as compare to range land near to agriculture land 29.77 t ha-1. The results of the present study confirmed that conversion of range land into agriculture land reduced the soil carbon in the study area.
Key words: Carbon stocks, climate change, soil bulk density, range lands, forestry.
The matter of great concern among scientific communities around the globe is the increase level of CO2 and other green house gases. This increase level of green house gases leads to global warming and climate change. The most contributing agent in global climate change is Carbon Dioxide (IPCC, 2007). The atmospheric concentrations of CO2, N2O, CH4 and other greenhouse gases prolong rise, affects the global climate. The Kyoto Protocol to the United Nations Framework Convention on Climate Change (UNFCCC) and succeeding agreements have set accurate targets in terms of levels and dates for sinking overall greenhouse gas emissions to the atmosphere (Watson et al., 2000). The current concentration of CO2 in the atmosphere is 402 ppm in 2014 (www.CO2now.com). The carbon dioxide comes from different sources like fossils fuel burning, cement industries and other anthropogenic activities. Cement industries and fossil fuel burning contributes 91% that equals to 33.4 billion metric tons and the remaining 9% or 3.3 billion metric tons comes from land use changes particularly from the conversion of forest land to other land uses. This humanity’s carbon dioxide 50% or 18.4 billion metric tons goes to atmosphere, 26% or 9.5 billion metric tons goes to land and the remaining 24% or 8.8 billion metric tons goes to oceans (www.CO2 now.com). Rangelands signify 24% of the world’s land area (FAO, 2007). Grassland Soil Organic Matter can be strongly influenced by supervision and management (Conant et al., 2001). SOC losses due to exchange of ‘native’ or freely grazed grassland (FGG) to cropland and poor grazing land management activities (Davidson and Ackerman, 1993; Guo and Gifford, 2002).
Range lands has so many importance like it support our wild life and livestock, it reduces soil erosion, and ensure clean water by reducing siltation (Milchunas, 2004). Apart from the above, range land acts as a sink of carbon and plays a noticeable role in the global climate change mitigation by catching and storing the atmospheric carbon dioxide (IPCC, 2006). Temperate grasslands contain soil organic matter (SOM) that averages 331 Mg ha−1, and grasslands contain 12% of the earth’s SOM (Schlesinger, 1997). Therefore, enhancing carbon sequestration in terrestrial ecosystems is an important approach for controlling the increase in atmospheric CO2 concentration. Grazing decreased soil carbon absorption, especially when initial soil carbon concentration was higher than 2%. Compared with no or light grazing, typical soil carbon concentration decreased in reaction to heavy grazing by 30.0% and moderate grazing by 17.0%. It decreased on average by 16.2% in response to heavy grazing and by 8.2% in response to fair grazing (Shiping et al., 2011).
Land use change can go ahead to change in a range of soil properties, including soil carbon (C), nitrogen (N) content, soil bulk density and pH (Callesen et al., 2003). There is significant alarm that land use change can lead to variation of the soil carbon (C) (Houghton et al., 1999; Schlesinger, 1990) though, Lal (2004) reported that more conventional soil properties such as total C is susceptible to land use change as complicated physical fractionation schemes. Soil is the largest organic C reservoir in the terrestrial biosphere; about two times superior than that of vegetation or the atmosphere (Schlesinger, 1997). Even an insignificant change in SOC storage could result in a major variation in atmospheric CO2 concentration (Callesen et al., 2003; Wynn et al., 2006). Rangelands stored about 30% of the world’s soil carbon (White et al., 2000; Grace, 2004; Milne et al., 2007).
In Pakistan about 60% of the total area of the country comprises rangelands. The area fairly supports 93.5 million head of livestock. Even so, there remains an insufficiency of basic ecological information that is needed to get better understanding of why, when and where rangeland ecosystems function as C sinks or sources. Pakistan is signatory to the Kyoto protocol. The protocol stress on the member countries to quantify the carbon, stored in different sinks. In Pakistan study on range land regarding forage production, carrying capacity and biomass estimation has been carried out. Study regarding carbon stocks of range land particularly on soil carbon is scarce. The present study was carried out in Kumrat valley. The study aimed to find out the total carbon stored in the soil of rangelands in Kumrat DirKohistan.
Research design
Stratified random sampling design was used. The range land of the area were divided into three strata that were undisturbed range land, range lands near to forest and range lands near to agriculture land. In all these three strata the soil sample was taken. 18 soil samples were randomly taken in each site at the depth of 0-15 cm and from 15-30 cm.
Soil samples collection
The elevation and coordinates of each unit are from where soil samples were collected and were measured by GPS. Collection of soil samples was done in two depths; 0-15 and 15-30 cm and the weight of each sample was measured in the field and was put in labeled bags and brought to the laboratory for further analysis.
Calculation of soil bulk density
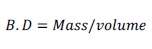
The soil samples which were collected in rangelands were brought to the laboratory and were kept in the oven for 48 h on 72°C to dry. The soil samples were put in the known volume of a cylinder (H= 5.12 cm and Cross sectional Area= 20.32 cm2). After this the samples were weighted (through digital balance) and their volumes were calculated. The volume of soil core was calculated and was 104 cm3. Soil bulk density gcm-3 was calculated by using following formula:
Soil pH estimation
For the determination of soil pH, 50 g of air- dried soil was taken into a 500 ml glass beaker, and 50 ml of distilled water were added. After titration, the contents were mixed and allowed to stand for an hour. After this, the soil pH was calculated by using soil pH meter (Mc Lean, 1982).
Soil carbon estimation in Tons ha-1
Soil carbon in tons ha-1 was calculated from the relation of soil organic carbon (SOC %), Soil bulk density (g/cm3) and thickness of horizon (cm). The following formula (Persion et al., 2008; Adnan et al., 2014) was used to find out soil carbon in tones ha-1:
SOC (tones ha-1) = SOC content %* SBD (g/cm3)* TH (cm)*100
Where, SOC = soil organic carbon; SBD = soil bulk density and TH = thickness of horizon.
Soil Organic Carbon (tons hac-1) = Soil Organic Content % × Soil Bulk Density (g/cm3) × Thickness of Horizon (cm) × 100.
Statistical analysis
For the statistical analysis different software like MS Excel, Sigma plot software, program and PAST was used. Mean Standard deviation, and CV% Standard error were calculated. Regressionmodels were developed in order to study the relationship between soil organic matter and elevation and soil organic carbon and elevation.
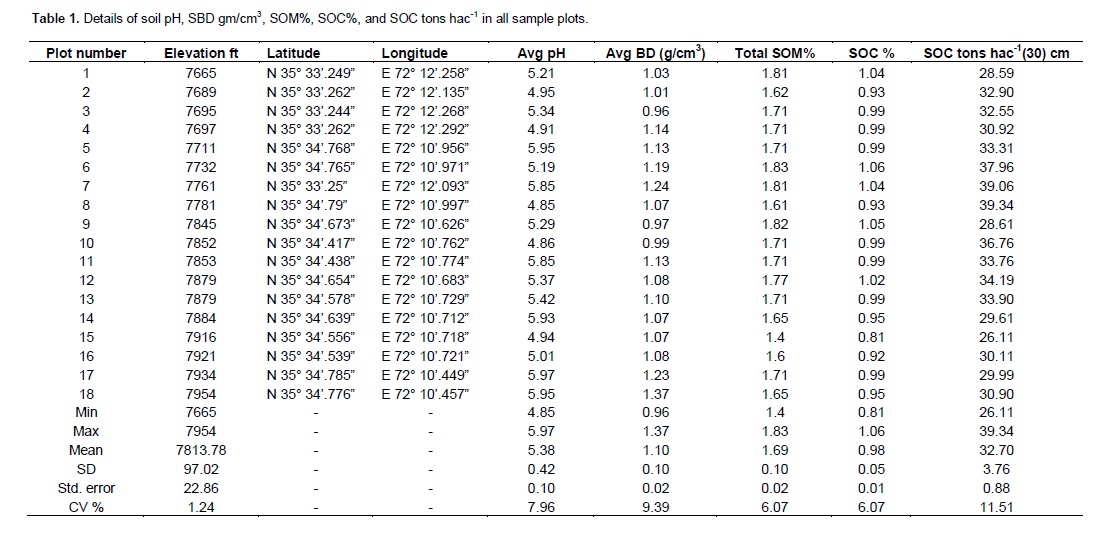
Soil pH of each sample plot
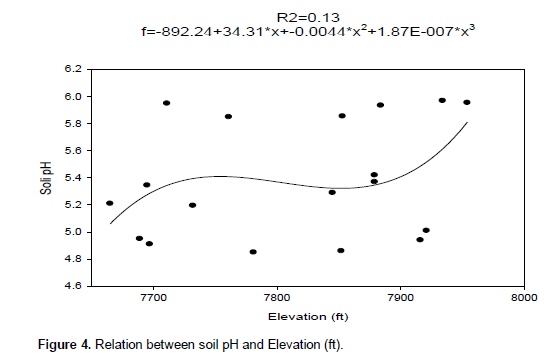
Results of soil pH are given in Table 1. Soil pH ranged from 4.5 to 5.9. The average soil pH was 5.3 which showed the acidity in nature. In order to find out the relationship between soil pH and elevation, regression model was developed (Figure 4). The relation of soil pH and elevation is polynomial cubic. The value of R2 was 0.13 and that showed that there was week relation between elevation and soil pH.
Soil pH of Range land near to agriculture land
These range lands were the disturbed range land.
Majority of these range lands were converted to agriculture lands. Soil samples were collected in these range land from those area which are not still converted to agriculture fields. These unconverted areas are mostly located at relatively high altitude and sloppy area. Soil samples were taken from those areas and there pH was calculated. The results of soil samples are given in Table 2. The average soil pH in this site was calculated as 5.91. These soils are less acidic in nature then those of undisturbed range land and range lands near to forest lands.
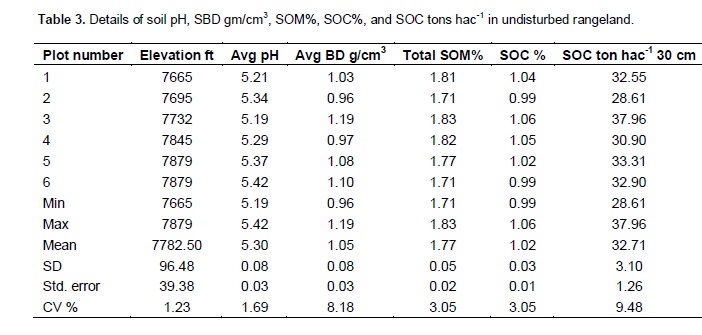
Soil pH in undisturbed range land
The result of soil pH in undisturbed range lands is presented in Table 3. In the present study, it was found that soil pH in undisturbed range land ranges from 5.19 to 5.42 while the mean soil pH was 5.30.
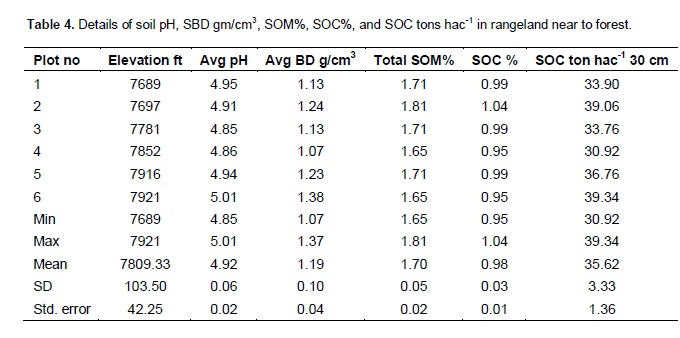
Soil pH of range land near to forest land
The results of soils pH of range land near to the forest land is given in Table 4. The minimum soil pH of range land near the forest land was 4.85 while the maximum soil pH was 5.01. The Mean soil pH was 4.92.
Soil bulk density (g/cm3)
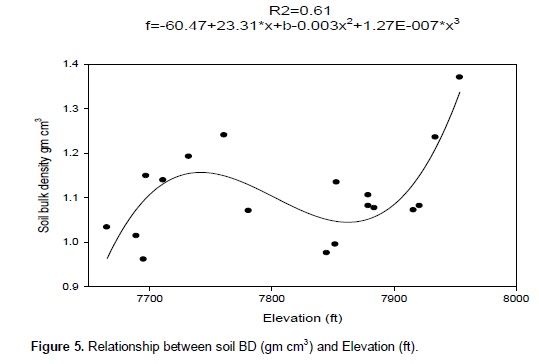
In the present study the soil particles were examined and soil bulk density was find in each study site. Soil bulk density ranged from 0.96 to 1.37 g/cm3. The mean soil bulk density was 1.107 g/cm3. Details of soil is given in Table 3 and Figure 7. In order to find out relationship between soil bulk density and elevation, regression model was developed. The relationship between soil bulk density and elevation is polynomial cubic. The value of R2 was 0.61. This value of R2 indicated that there is a positive relation between soil bulk density and elevation. The relation of soil bulk density and elevation is best represented in Figure 5.
Soil bulk density (g/cm3) in undisturbed range land
Soil SBD (g/cm3) in UDRL ranged from is 0.96 to 1.19g/cm3. Mean soil bulk density was 1.058 g/cm3. Details are given in Table 3.
Soil bulk density (g/cm3) of range land near to forest land
Table 4 showed that among all three study site Soil bulk density (g/cm3) of RLNFL was maximum and was 1.199 g/cm3. The minimum and maximum Soil bulk density in this site was 1.07 and 1.37 g/cm3 respectively. Mean soil bulk density was 1.199 g/cm3.
Soil bulk density (g/cm3) of each sample plot of range land near to agriculture land
The soil bulk density near to agriculture land is expressed in Table 2. In this study site BD ranges from 0.99 to 1.14 g/cm3. Mean soil bulk density was 1.06 g/cm3.
Soil organic matter (%)
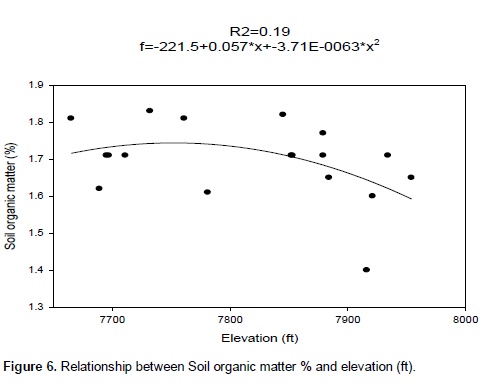
The results showed that the sample plots which were taken in undisturbed range land has maximum amount of soil organic matter than the sample plots taken in the range land near to forest land and agriculture land Table 1. The soil organic matter was calculated by Walkley and Black method in the laboratory. Minimum soil organic matter was recorded in range land near to agriculture land and maximum soil organic carbon of 1.83% was found in undisturbed range land. Mean soil organic matter was 1.69%. In order to study the relation of soil organic matter and elevation, regression model was developed. The relation between soil organic matter and elevation was negative the value of R2 was 0.19 (Figure 6).The results of the present study shows great variation in soil organic matter in each study site. Undisturbed range lands has more SOM%, range lands near to forest has moderate SOM% while the range lands near to agriculture lands has in SOM%. The results show that the sample plots which were taken in undisturbed range land has maximum amount of SOM% than the sample plots taken in the range land near to forest land and agriculture land. SOM% of all these sample units ranged from 1.4 to 1.83%. Mean SOM% was 1.69%. In undisturbed range lands SOM% ranged from 1.71 to 1.83% while the mean soil organic matter was 1.775%. Range lands near to forest land SOM ranged from 1.65 to 1.81% while the mean SOM% was 1.70%. SOM% in range lands near to agriculture land ranged from 1.4 to 1.71% while the mean SOM% was 1.60%. These statistics shows that SOM% is more in undisturbed range land while less in range land near to forest land and lesser in range land near to agriculture lands.
Soil organic matter% of sample plots taken in undisturbed range land
Table 3 shows the soil organic matter (SOM %) in undisturbed range lands. Minimum SOM% was 1.71% and maximum was 1.83% while the mean SOM% was 1.775%.
Soil organic matter% of sample plots taken in range land near to forest
Details of soil organic matter in this site are presented inTable 4. Soil organic matter% in this site ranged from 1.65 to 1.81% while the mean soil organic matter % was 1.70%.
organic matter% of sample plots taken in range land near to agriculture land
Table 2 showed that minimum of SOM% was 1.4% and maximum was 1.71% while the mean SOM% was 1.60%.
Soil organic carbon SOC%
The SOC% was calculated from the SOM% by using the following formulae:
SOC% = SOM% / 1.724 (Walkeley and Black, Ahmad et al., 2014).
Where, SOC = soil organic carbon; SOM = soil organic matter; 1.72= constant.
Soil organic carbon concentration (SOC%) of each plot taken in undisturbed range land
Table 3 shows the total soil organic carbon concentration of SOC%% in undisturbed range lands. Minimum of SOC% was 0.99% and maximum was 1.05%. Mean SOC% in these range lands were 1.02%.
Soil organic carbon concentration (SOC%) of each plot taken in range land near to forest land
Table 4 shows the SOC% in each sample unit taken in range land near to forest land. Minimum of SOC% was 0.95% and maximum was 1.04%. Mean SOC% was 0.989%.
Soil organic carbon concentration (SOC%) of each plot taken in range land near to agriculture land
Table 2 shows the SOC% in those range lands which are near to agriculture lands. Minimum SOC% was 0.92% and maximum was 0.99% the mean SOC% was 0.93%.
Soil organic carbon concentration in tons hac-1 of each sample plot
Table 1 shows that in each study site the soil organic carbon in t ha-1 was calculated. For the calculation of soil organic carbon, the following formula was used (Walkley and Black, 1934):
SOC (tons hac-1) = SOC% × SOM × TH × 100. Where, SOC = soil organic carbon; SOM = soil organic matter; TH = thickness of the horizon of the soil.
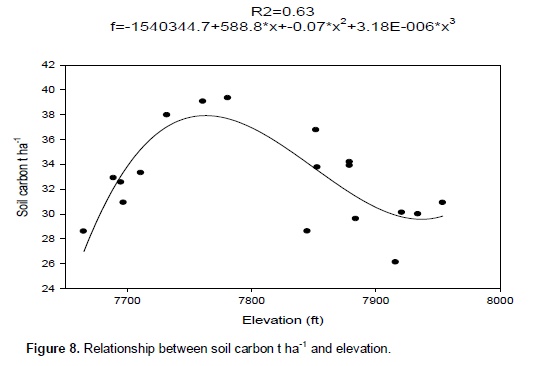
In the present study, soil organic carbon ranged from 26.11 to 39.34 t ha-1. The average soil organic carbon was 32.70 t ha-1. The results of the present study reveals that the soil of undisturbed range land stored maximum soil carbon while the soil of the range land near to the agriculture land hold minimum soil carbon. In the present study, relation of soil organic carbon and elevation was determined through regression model (Figure 8). The relation is poly nominal cubic. The value of R2 was 0.63. In Undisturbed range land, SOC (tons hac-1) ranged from 28.61 tons to 37.96 tons hac-1. The Mean SOC was 32.69 tons hac-1. Range lands near to forests stored an average soil carbon of 35.62 t ha-1. Range lands near to agriculture lands stored an average soil carbon of 29.77 tons hac-1. These results show that the undisturbed range lands soils stored maximum amount of SOC while soils of range lands near to forest lands stored less soil carbon t ha-1.
Soil organic carbon t hac-1 in undisturbed range lands
Table 3 shows the total SOC in tons hac-1 stored by the undisturbed range lands. Minimum amount of SOC stored by these soils was 28.61 tons hac-1 and maximum amount of SOC stored by these soils was 37.96 tons hac-1. Mean SOC which was stored by these soils was 32.69 tons hac-1.
Soil organic carbon in tons hac-1 in range land near to forest land
Table 4 shows the total SOC tons hac-1 stored by range land near the forest lands. Minimum SOC was 30.92 tons hac-1 and maximum SOC was 39.34 tons hac-1 while mean SOC was 35.62 tons hac-1.
Soil organic carbon in t ha-1 in range land near to agriculture land
Table 2 shows the soil organic carbon in t ha-1 in range land near the agriculture land. Minimum SOC was26.11 t ha-1 and maximum SOC was 34.19 t ha-1 while mean SOC was 29.77 t ha-1. The results of the present study confirms that in undisturbed range land the soil organic carbon was more as compared to range land near the agriculture land. Soil disturbance occulted due to various agriculture practices that lead to soil erosion and loss of soil organic carbon.
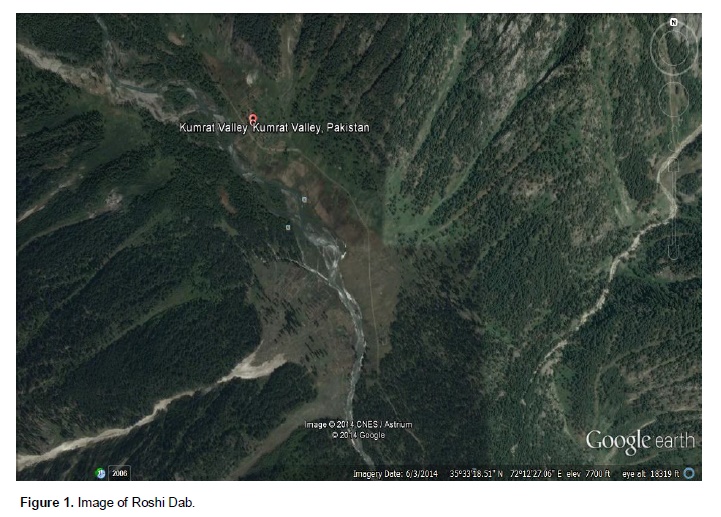
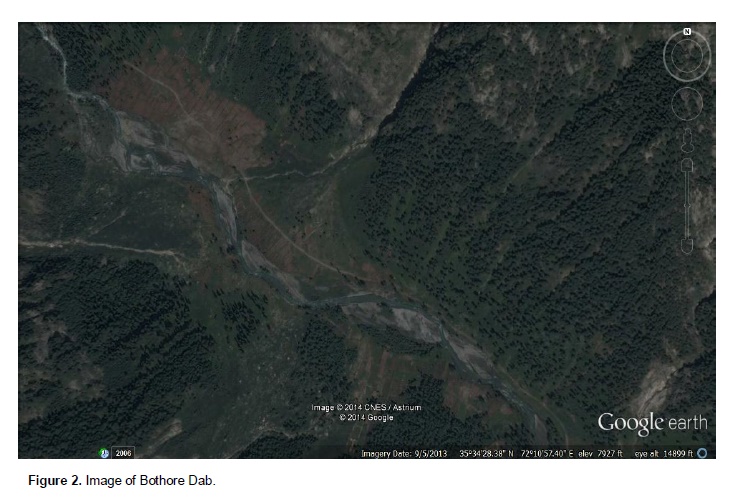
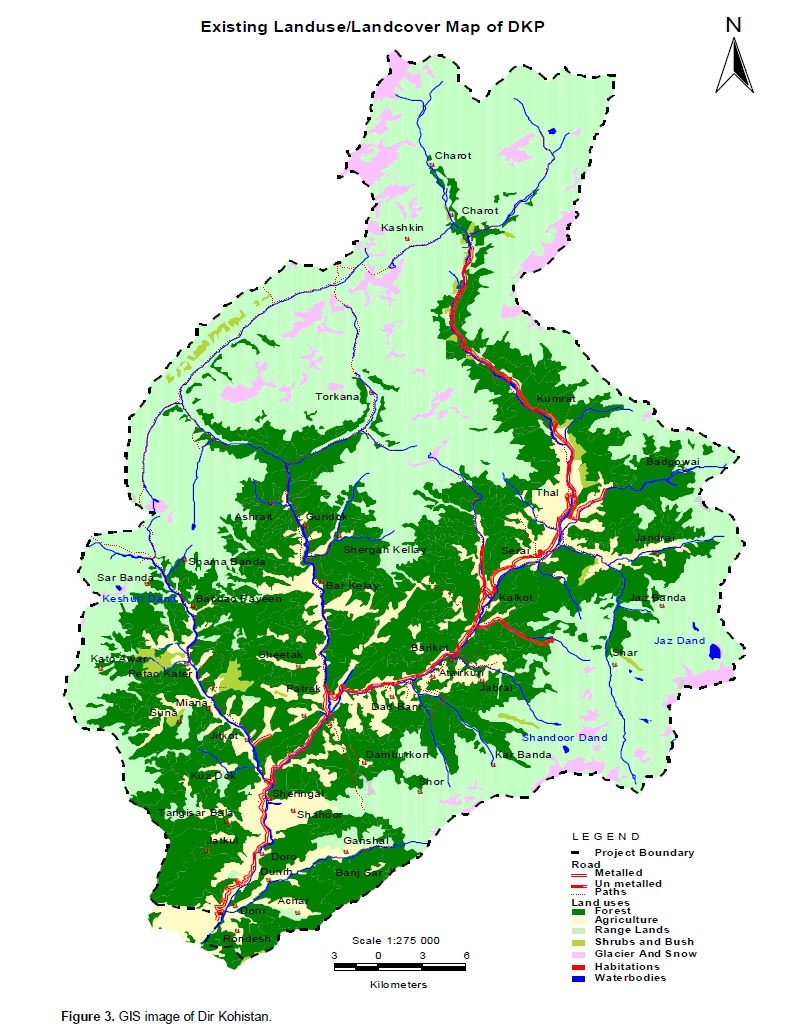
The study was conducted in Kumrat valley Dir Kohistan. Elevation of the study site ranged from 7665 to 7954 ft, while the geographic location is N 35° 33’.25 to 34’.785’ and E 72° 12’.135’ to 12’.997’(Figure 1 and 2). GIS image showed location and description of Kumrat Dir Kohistan (Figure 3). The minimum average soil weight was 103.5 g while the maximum soil sample weight was 142.5 g. The average soil sample weight was 116.77 g. Soil pH ranged from 4.5 to 5.9. The average soil pH was 5.3 which showed the acidity in nature. A regression model between soil pH and Elevation (ft) was developed (Figure 4).
Soil bulk density in all sample unit ranged from 0.96 to 1.37 g/cm3. The mean soil bulk density was 1.107 g/cm3. Soil SBD (g/cm3) in UDRL ranges from was 0.96 to 1.19 g/cm3. Mean soil bulk density was 1.058 g/cm3. RLNFL have the minimum and maximum SD in this site was 1.07 g/cm3 and 1.37 g/cm3 respectively. Mean soil bulk density is 1.199 g/cm3. The soil near to agriculture land BD ranges from 0.99 g/cm3 to 1.14 g/cm3. Mean soil bulk density was 1.06 g/cm3. A regression model was developed between SBD and Elevation (Figure 5).
SOM% of all these sample units is ranges from 1.4% to 1.83%. Mean SOM% is 1.69%. Undisturbed range lands have SOM% ranges from 1.71% to maximum of 1.83% while the mean soil organic matter % is 1.775. Range lands near to forest land have SOM ranges from 1.65% to maximum of 1.81% while the mean SOM% is 1.70%. SOM% in range lands near to agriculture land is ranges from 1.4% to maximum of 1.71% while the mean SOM% is 1.60%. These statistics shows that SOM% is more in undisturbed range land while less in range land near to forest land and lesser in range land near to agriculture lands. It is due to the severe disturbance of land soil surface which leads to prevent the soil from carbon storage. A regression model was developed between SOM% and elevation (Figure 6).
SOC% ranged from 0.92 to 1.05%. Mean SOC% was 0.98%. SOC% in undisturbed range lands ranged from 0.99to of 1.05%. Mean SOC% 1.02%. SOC in range lands near to forest lands ranges from 0.95 to 1.04%. Mean SOC% was 0.989%. SOC in range lands near to agriculture lands ranged from 0.92 0.99% while mean SOC% was 0.93%. A regression model was developed between SOC% and elevation (Figure 7). Land use change can go ahead to change in a range of soil properties, including soil carbon (C), nitrogen (N) content, soil bulk density and pH (Callesen et al., 2003). Though, Lal (2004) reported that more conventional soil properties such as total C, it is susceptible to land use change as complicated physical fractionation schemes. Soil is the largest organic C reservoir in the terrestrial biosphere, about two times superior than that of vegetation or the atmosphere (Schlesinger, 1997). These results showed that the undisturbed range land has more carbon stored while range lands near to agriculture lands stored less in their soils. In Undisturbed range land SOC (tons hac-1) ranges from 28.61 tons hac-1 to 37.96 tons hac-1. The Mean SOC was 32.69 tons hac-1. Range lands near to forests stored an average soil carbon of 35.62 t ha-1. Range lands near to agriculture lands stored an average soil carbon of 29.77 tons hac-1. These results showed that the undisturbed range lands soils stored maximum amount of SOC while soils of range lands near to forest lands stored less soil carbon t ha-1. A regression model was developed between SOC tons hac-1 and elevation (Figure 8).
The present study stated that if the range lands were not disturbed, it will bring a lot of rest in global climate change. As shown in Tables 1, 2, 3 and 4 the maximum organic carbon was stored by the range lands near to forest land and range lands which are not disturbed yet. While in other hand the range lands which are disturbed or will be disturbed in near future will lose the ability of storing organic carbon concentration.
The areas were remote and due to raising human and livestock population, the area was affected harshly. So the forest department is directed to raise awareness in local people and give special attention to this new raising problem.
The author(s) did not declare any conflict of interest.
REFERENCES
|
Ahmad A, Mirza SN, Nizami SM (2014). Assessment of biomass and carbon stocks in coniferous forest of Dir Kohistan, KPK. Pak. J. Agric. Sci. 51(2):335-340. |
|
|
Callesen I, Liski J, Raulund-Rasmussen K, Olsson M, Tau-Strand L, Vesterdal L, Westman C (2003). Soil carbon stores in Nordic well-drained forest soils—relationships with climate and texture class. Glob. Change Biol. 9:358-370.
Crossref |
|
|
Davidson E, Ackerman I (1993). Changes in soil carbon inventories following cultivation of previously untilled soils. Biogeochemistry 20: 161-193.
Crossref |
|
|
Milne E, Sessay MF, Easter M, Paustian K, Killian K (2007). Sustainable Land Management Through Soil Organic Carbon Management and Sequestration The GEFSOC Modelling System pp. 359-371.
Crossref |
|
|
|
FAO (2007). FAO Newspaper Rangelands and Climate Change: Mitigation, 2007 |
|
|
Grace J (2004). Understanding and managing the global carbon cycle. J. Ecol. 92(2):189-202.
Crossref |
|
|
Guo L, Gifford R (2002). Soil carbon stocks and land use change: a meta-analysis. Glob. Change Biol. 8:345-360.
Crossref |
|
|
Houghton R, Hackler J, Lawrence K (1999). The US carbon budget: contributions from land-use change. Science 285:574
Crossref |
|
|
|
IPCC (2007) Guidelines for National Greenhouse Inventories. Volume 4. Agriculture, Forestry and Other Land Use. Intergovernmental Panel on Climate Change (IPCC), IPCC/IGES, Hayama, Japan pp. 48-49. |
|
|
|
IPCC (2006). Guidelines for National Greenhouse Gas Inventories. Available online with updates. Available at: www.ipccnggip.iges.or.jp/public/2006gl/index.html |
|
|
Lal R (2004). Offsetting China's CO2 Emissions by Soil Carbon Sequestration. Clim. Change 65(3):263-275.
Crossref |
|
|
|
Schlesinger WH (1997). Biogeochemistry: An Analysis of Global Change (Second Edition). Academic Press, San Diego, California. |
|
|
Schlesinger WH (1990). Evidence from chronosequence studies for a low carbon-storage potential of soils. Nature 348:232-234.
Crossref |
|
|
Shiping W, Andreas W, Zhicai Z, Xiaofeng C, Rong L, Yanfen W, Haishan N (2011). Management and land use change effects on soil carbon in northern China's grasslands. Agric. Ecosyst. Environ. 142 (3-4):329-340.
Crossref |
|
|
Walkley A, Black IA (1934). An Examination of Degtjareff Method for Determining Soil Organic Matter and a Proposed Modification of the Chromic Acid Titration Method. Soil Sci. 37:29-37.
Crossref |
|
|
White A, Cannell MGR, Friend AD (2000). The high-latitude terrestrial carbon sink: a model analysis. Glob. Change Biol. 6(2):227-245.
Crossref |
|
|
Wynn J, Bird M, Vellen L, Grand-Clement E, Carter J, Berry S (2006). Continental-scale measurement of the soil organic carbon pool with climatic, edaphic, and biotic controls. Glob. Biogeochem. Cycles 20, GB1007.
Crossref |
.jpg)
.jpg)