ABSTRACT
The overall objective of the study was to map trees outside forest (TOF) in croplands, and their contribution to the supply of ecosystem services for local and national beneficiaries using participatory research, Google Earth and ArcMap in Ghana, as the case study area. A satellite image available from Google Earth was used to map croplands, and ArcMap was used to calculate the local and national ecosystem service hot spot areas based on the values assigned to each TOF individuals. The research identified and mapped a total of 786 TOF individuals and 50 TOF species in 147 ha of croplands in the study area. Ficus exasperate, Morinda lucida, Ceiba pentandra, Spathodea campanulata, Mangifera indica, Sterculia tragacantha, Funtumia elastic, Ficus carpensis, Vernonia amygdalina and Trilipisium madagascariense were the top ten most dominant species in terms of species occurrence. Fifteen different local ecosystem services supplied by TOF species, and the hotspot areas were identified and mapped. The total carbon stored by all 786 TOF in 147 ha of the study area was 759 tons of carbon. The most important TOF species and hotspot locations that require special planning, conservation, and management focus were identified and mapped. There was a poor correlation between the importance and location of the key species for local and national beneficiaries which might lead to a conflict of interest and illegal tree felling.
Key words: Trees in croplands, geographic information system (GIS), ecosystem benefits, beneficiaries, tree management.
Trees outside forest (TOF) are defined as all trees excluded from the definition of forest and other wooded lands. TOF are frequently located on farmlands and built-up areas of rural and urban landscapes. It includes planted and naturally grown trees including trees in agroforestry systems, orchards, and small woodlots. TOF can raise in croplands, pastoral areas, along rivers, canals, and roadsides, or in towns, gardens and parks (De Foresta, 2013).
TOF have several varying tree formations of various types, functions and spatial arrangements and are often noticed differently by different stakeholders (Schnell et al., 2015a). Therefore, defining TOF is important to make sure the consistency and comparability of different data sets and to simplify communication. Tree resources ranging from single trees to systematically managed trees in agroforestry practices and trees in agricultural lands, fruit trees, and rubber plantations are considered as TOF (Herrera-Fernández, 2003). The Food and Agriculture Organization of the United Nations defines TOF as "trees on land not defined as forest and another wooded land"(De Foresta, 2013). In this research, TOF are defined as naturally grown or planted trees in croplands which are retained by local beneficiaries except for commercial plantation trees such as oil palm, cacao, and teak plantations.
In recent years, TOF has begun to draw attention with increasing considerations of their potential economic roles and political interest due to their contribution to human well-being through ecosystem services. Mapping and assessing the ecosystem services provided by TOF are becoming an important way of understanding the benefits of trees to people.
Ecosystem services are the benefits people get from ecosystems. Assessment aims to estimate the value of and contribution from TOF to the beneficiaries. Understanding the value of ecosystem services can help policy makers to take better decisions which can result in better management and use of natural resources (Daily et al., 2009).
To carry out such assessment, the use of satellite imagery and image analysis techniques is crucial to collect data about the cover and density of trees (Bonham, 2013). Satellite images available from Google Earth and using mobile geographic information system (GIS) are promising resources to map the quantity and distribution of trees in croplands (Zahidi, 2015). This can help researchers and policy makers to conduct a study on TOF and their ecosystem services for better management and conservation (Sinare and Gordon, 2015).
Apart from mapping, knowledge of local beneficiaries on TOF are vital for collecting relevant information about ecosystem services provided by TOF. The local beneficiaries have knowledge and experience about the types of trees and their benefits provided to them especially in the provisioning services such as wood, food, and fruits (Hein et al., 2006; Hapsari, 2010). They provide insight in which services are provided to them because they are regarded as one of the managers, beneficiaries, and stakeholders of the TOF. This can help in developing a better understanding of the relationship between tree based ecosystems and as a source of valuing ecosystem services.
The role of TOF in the supply of ecosystem service is missing from forest assessments and policies. Although some studies exist about the importance of TOF, knowledge is still limited on the role of TOF at local and national levels (Schnell et al., 2015b). TOF provide different ecosystem benefits at different spatial levels. A better understanding of who profits from what trees and about the spatial level and location can help to fine-tune protection and management of TOF.
In Ghana, trees are owned/managed by the Forest Commission and the right to tree tenure determines who benefits from Reducing Emissions from Deforestation and Forest Degradation (REDD) activities. REDD provide incentives to landowners for improvement in national carbon stock and tree cover including TOF (Corbera, 2012). The National Forest Commission plays a significant role in tree management, land use plan allocation, and policy implementation. Due to solid formal systems of tree ownership, it can be difficult to obtain a certificate of tree ownership (World Agroforestry Centre, 2011).
Therefore, landholders typically do not have ownership of trees on their lands. However, they have the right to protect and manage the trees on their lands. Both local and national level institutes play a role in tree conservation and management. When their interests align, conflicts regarding trees resources will resolve and trees are at low risk of illegal felling. The local beneficiaries have the obligation to manage the trees on their farm lands but they have no rights to cut the trees. However, if farmers are not benefiting from the trees, conflicts will arise and trees are at risk of illegal cutting.
Quantifying and mapping ecosystem services and their values are not straightforward. Though there are various valuation methods that addresses ecological, economic and social values (Felipe-Lucia et al., 2015), there are no standardized methods for valuing ecosystem services (Crossman et al., 2013).
Identifying and describing TOF species and their ecosystem services based on local beneficiary’s knowledge can reveal the value of the ecosystem services and understandind the role of TOF to local livelihood benefits. Process-based methods can be used to quantify and map ecosystem services that are strongly linked to the biophysical processes, such as carbon storage for climate regulation. The aim of this research is to: (1) To carry out the location and species inventory of TOF; (2) To map the value and contribution of TOF to local livelihood and national climate change regulation benefits based on the use of process models within the croplands of Nkaseim village in Goaso, Ghana.
The objectives are aimed towards looking out at the location, type, and benefit of trees in croplands to the beneficiaries and management risks of trees in croplands.
Study area
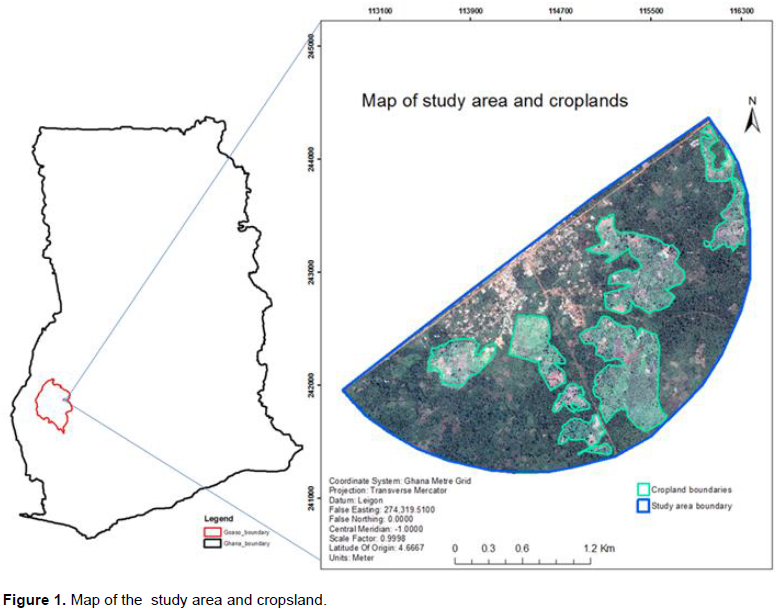
The research was conducted in croplands around Nkasiem village, in the Goaso district which is part of Brong Ahafo region in Ghana, West Africa. The study area covers a total area of 621 ha and a perimeter of 10.3 km. Of this total study area, 147 ha of croplands were used to conduct an inventory of TOF. Croplands are areas used for growing and cultivation of various crops. The major crops in the study area include planting, cassava, ginger and cacao and some maize, pepper, and rice. In addition to the cultivated crops, there are a number of trees inside and at the boundaries of croplands retained by local beneficiaries. The location and map of the study area within Ghana and Goaso, and location of croplands within the study area are shown in Figure 1.
Spatial TOF inventory
Mapping TOF
The locations of croplands within the study area were identified visually from satellite images of Google Earth. The visual image analysis was done based on tree cover to identify croplands. Croplands in the study area have relatively less tree cover in a scattered form than other land uses which makes it easy for identification using satellite image providers.
Croplands of the study area were mapped using Google Earth imagery of date 4/2/2015 from the satellite imagery provider of CNES/ Astrium 2016 and with a resolution of 2.6 x 2.6 m. The image available from Google Earth was downloaded and saved as rectified images using Elshyal Smart software (downloaded from http://elshayal-smart.en.lo4d.com/) to get higher resolution and georeferenced image. The rectified georeferenced image was uploaded to a smartphone and tablet using Locus map free software for offline navigation within the study area (Locus Map - knowledge Base, 2016). Printed and laminated maps were used to navigate to the study area.
The boundaries of croplands where TOF inventory was carried out were digitized manually on Google Earth based on visual image interpretation of land cover. The croplands where the TOF inventory was conducted were masked based on the digitized boundary of croplands. Based on field observations and TOF inventory, the manually digitized boundaries of croplands were improved in ArcMap 10.4.1 to develop the final map of croplands.
Each TOF within the croplands were recorded using Garmin-60 Global Positioning System (GPS). The GPS points were overlaid on the masked cropland images in ArcGIS to map TOF locations. TOF at the boundary of croplands with their crowns inside the croplands were included during the inventory. Trees that were outside digitized croplands were excluded from the inventory. All trees within the digitized croplands were recorded as well as the location of each tree except trees with diameter at breast height of fewer than 10 centimeters and plantations trees such as oil palm, teak, and cocoa trees.
TOF species inventory
The species inventory was conducted during field observations of every TOF by interviewing the local farmers or villagers and through a fieldwork assistant from Kwame Nkrumah University of Science and Technology with good knowledge of tree species. The local names of each TOF species were identified by the local farmers and a field assistant. The scientific name of each TOF species was identified through the help of the field assistant and Goaso forest district office experts, and by searching the internet (Ghana Forestry Commission, 2017).
Local level ecosystem services of TOF
Identification of local ecosystem services
A questionnaire containing both close-ended and open-ended questions were designed. The purpose of the questionnaire was to collect information about the ecosystem services supplied by each TOF species, their values, and frequency of each ecosystem service used in croplands according to local farmers. Ecosystem service provided by each TOF species in croplands of the study area were identified through an interview to the local beneficiaries during the field work.
The interviewees who are local farmers and reside in and around the croplands were selected purposely to get better information about the ecosystem services of TOF species. Most of the interviewees were asked during TOF inventory in the field on a random basis. Some respondents who retain trees in their own croplands were asked at the village purposively and randomly. Photos of TOF in croplands were used to interviewees who cannot join in the field to collect data about local ecosystem services of TOF and their values.
The number of diverse ecosystem services supplied by each TOF species was analyzed in excel (Microsoft) based on the list of ecosystem services identified by local beneficiaries for each TOF species. The analysis was conducted to identify the diversity and prevalence of ecosystem services, and to define the level of multi-functionality TOF species to local beneficiaries in the study area.
Valuation of local ecosystem services
After identifying the ecosystem services of each TOF species according to the local beneficiaries, different categories of farmers/interviewees were asked to score the ecosystem services based on their importance to local beneficiaries. Each ecosystem service provided by each TOF species is scored on basis of 1, 2 and 3 meaning; 1=fairly important, 2=important, 3=Very important.
Based on the score values, the average value of each ecosystem service of TOF species is calculated. However, the average value does not consider the multifunctionality of ecosystem services provided by each TOF species. For instance, a single TOF species providing a single ecosystem service might get a score of 3 and therefore the average score will be 3/1 =3, where 1 is the number of ecosystem service provided by a specific TOF species and 3 is the score value of the ecosystem service.
On the other hand, a single TOF species providing 3 ecosystem services might get scores of 3, 1, and 2, therefore, the average will be (3+1+2)/3=2. This means that a single TOF species providing only one ecosystem service is valued high or very important, and the second TOF species providing 3 different ecosystem services is scored less or important. This does not show good valuation and does not consider the multifunctionality of ecosystem services.
Therefore, for better evaluation and comparison among TOF total values, considering the multifunctionality of TOF, the average score of ecosystem services is multiplied by the number of ecosystem services provided by each TOF to get the total value of TOF species local ecosystem services. The total value was assigned to each TOF of the same species in the study area. The data analysis was done using a pivot table in Excel 2013.
National level ecosystem services of TOF
Quantification of carbon stock as national level ecosystem services
During field inventory, the diameter at breast height (DBH) and height of each TOF were measured. Diameter tape and haga clinometer were used to measure DBH and tree height of each TOF. Tape meter was used to measure the distance from each TOF to the point the tree height is to be measured using haga clinometer.
TOF with DBH of less than 10 cm were excluded from measurement. Allometric equations were applied to calculate above-ground biomass and carbon stock of each TOF in croplands based on the field measurements. The average amount of carbon stored in each TOF species was calculated to compare the results among all the TOF species. The total amount of carbon stock for each TOF species was also calculated. The total amount is according to the species occurrence (number of trees per species). The carbon content of each tree was therefore added to calculate the total carbon stored by a particular TOF species.
The following allometric equations that were developed for Ghana and Sub-Sharan Africa were used to calculate the amount of carbon stock stored in each TOF in kilograms per tree. (Henry et al., 2010). The equation uses DBH and height parameters to calculate above-ground biomass.
Above-ground biomass (kg/tree) = 0.17 × dbh (1.97) × H (0.55) (1)
Where, dbh= diameter at breast height and H = height.
The carbon stock is about 45 to 50% of the total above-ground biomass of a tree (Vashum et al., 2012). Therefore, the carbon stock of each individual trees was calculated by multiplying by 0.47.
Above-ground carbon stock (kg/tree) = 47/100 × Above-ground biomass (kg/tree) (2)
Valuation of carbon stock as national level ecosystem services
The carbon stock in TOF was valued based on the amount of carbon stored per individual TOF. The average amount of carbon stock per TOF species were calculated by dividing the total carbon of each species to the number of trees of that particular species. The total amount of carbon stock in the study area was calculated by adding carbon amounts of all TOF in croplands. The total carbon stock was divided by the total area of croplands to calculate the average amount of carbon per hectare. The carbon stock can be valued using carbon trading and price. Carbon stock is the ecosystem service quantity stored in trees in tons of carbon per tree or per hectare of land which can be valued in monetary terms (Rashid, 2012). The price (value) of carbon per ton of carbon ranges from 10 to 150 US dollars (Richards and Stokes, 2004; Cornelis Van Kooten et al., 2004). The average market carbon price is USD 7.50 per ton of CO2 emission (Scharlemann et al., 2010). The value of carbon as a national level ecosystem service was normalized to 3 classes to allow relative comparison with the values of local scale ecosystem services. The following formula was applied to normalize the values of carbon stock into 3 classes according to the study of Crossman and Bryan (2009):
X'= (X-X min) x 2/(X max-X min) +1 (3)
Where, X' = transformed value for x; X min = minimum value for x; X max = maximum value for x
The values were calculated to each TOF based on the carbon stock amount to result in a map of TOF and values of carbon stock to each TOF in croplands.
Identifying key TOF species and locations for ecosystem services
Key TOF species and locations
Based on all the aforementioned procedures of the species names and locations, the ecosystem services and their normalized values at local and national levels, the most important locations (hotspots) and TOF species were identified.
The normalized total local ecosystem service values and the normalized average carbon stock values were used to calculate the total value of each TOF species to local and national beneficiaries. The local ecosystem services were normalized based on the total score given by local beneficiaries to each ecosystem service supplied by each TOF species.
Each normalized total local ecosystem service score value of a particular TOF species was assigned to all TOF individuals in the study area. This means that the same total score was assigned to each TOF of the same species. The national ecosystem services were normalized based on the amount of carbon stock of each TOF. The normalized values of the local and national ecosystem services are assigned to each TOF individuals. The highest normalized values of local and national ecosystem services and their locations were selected as key species and locations (hotspots). The values were normalized into three classes using the formula in Equation 3.
Hot spot analysis was done in ArcGIS. The hotspot analysis tool identifies statistically significant spatial clusters of high values (hot-spots) and low values (cold spots) of the local and national ecosystem service normalized values. It produces a new output feature class with a z-score, p-value, and confidence level bin (Gi_Bin) for each feature in the input feature class (Giner, 2016).
The hot-spot analysis does not consider the species types. It only considers the local and national ecosystem service values of each TOF.
Comparison between key species for local and national ecosystem services
The local scores of TOF were compared to the value of national level ecosystem services if there are differences and similarities among TOF species according to the normalized values of national and local ecosystem services. Differences and similarities among TOF species with top highest and lowest values of ecosystem services both for local and national level beneficiaries were also compared.
Spatial TOF inventory
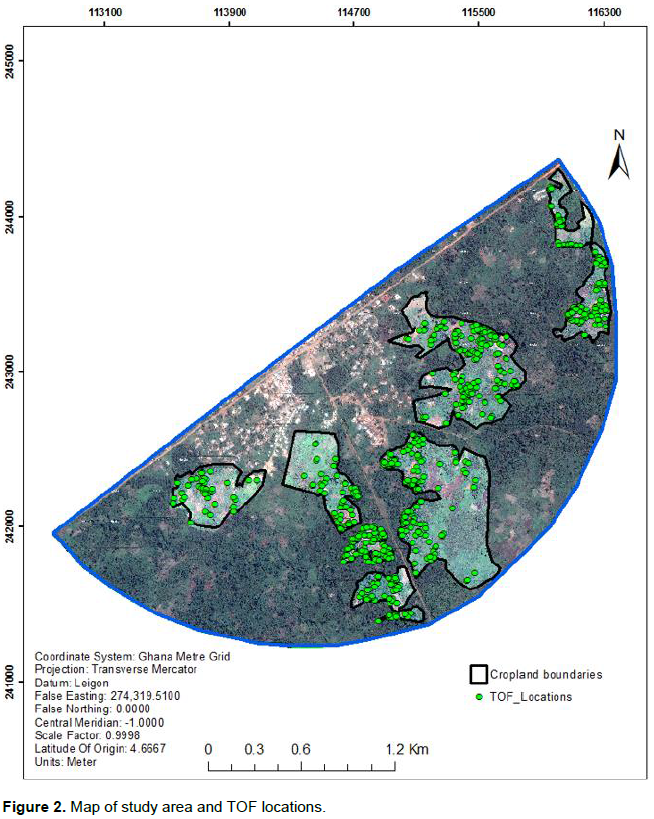
A total of 786 TOF individual observations and 50 different TOF species were identified and recorded in 147 ha of croplands in the study area. The average number of TOF individuals per hectare is approximately 5 trees. The location of each inventoried TOF individuals in the croplands of the study area are shown in Figure 2.
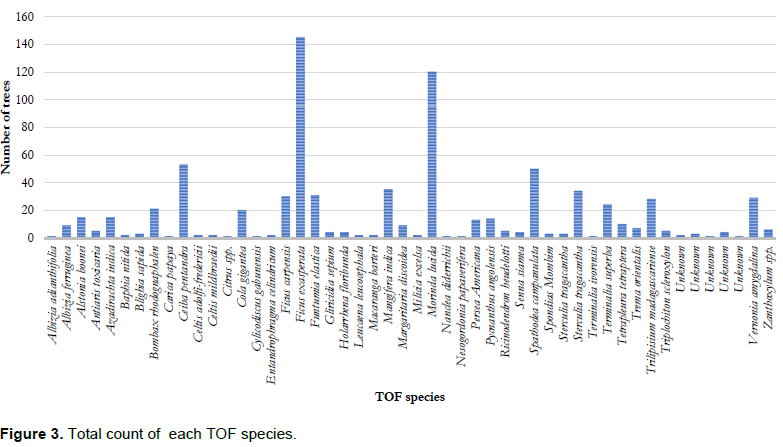
Ficus exasperate, Morinda lucida, Ceiba pentandra, Spathodea campanulata, Mangifera indica, Sterculia tragacantha, Funtumia elastic, Ficus carpensis, Vernonia amygdalina and Trilipisium madagascariense are the top ten most dominant species. These TOF species constitute 70.61% of the total number of TOF found in the study area. Citrus spp., Nesogordonia papaverifera, Cylicodiscus gabunensis, Terminalia ivorensis, Nanclea diderrichii, Albizia adianthifolia and Carica papaya rarely occur in croplands of the study area accounting only 0.91% of the total number of TOF trees (Figure 3).
Local level ecosystem services of TOF
Type and number of TOF ecosystem services
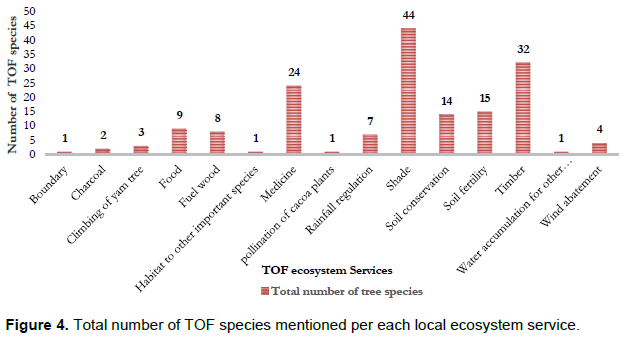
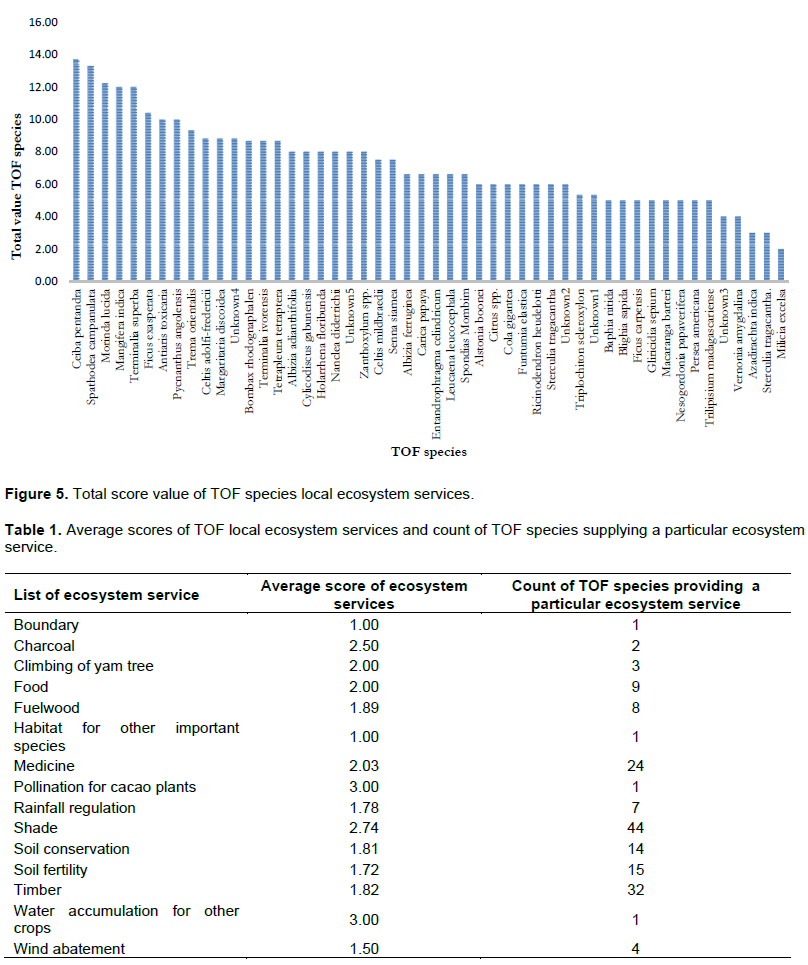
Thirty-seven local beneficiaries were interviewed to gather information about the supply of local ecosystem service by each TOF species, the value (score) of each ecosystem service and frequency of each ecosystem service were used. A total of 15 different ecosystem services supplied by different TOF species were identified by the interviewees. Out of them, the provision of shade (by 44 TOF species), timber (32 species), medicine (24 species), soil fertility (15 species) and soil conservation (14 species) are the ecosystem services provided by most of the different TOF species. A single TOF species can supply one or more ecosystem services. Only 6% of the TOF species provide a single ecosystem service, the rest 94% supply more than one ecosystem service according to the respondents. The list of ecosystem services supplied by TOF and the number of TOF species which provide a specific ecosystem service are shown in Figure 4.
Valuation of TOF local ecosystem services
The local ecosystem services of TOF are valued based on their importance for local beneficiaries. C. pentandra, S. campanulata, M. lucida, Terminalia superba, M. indica, F. exasperate, Pycnanthus angolensis, A. toxicaria and T. orientalis are the top TOF species scored with highest score values. Milicia excelsa, Azadirachta indica, S. tragacantha, Unknown3 (Local name: Asusumaasa), V. amygdalina, Baphia nitida, Blighia sapida, F. carpensis, Gliricidia sepium and Macaranga barteri are the top ten lowest scored TOF species. The total score value of each TOF species is shown in Figure 5. The value of the 15 ecosystem services supplied by TOF species is calculated based on the average score values. Shade (supplied by 44 TOF species), charcoal (2 species) and pollination of cacao plants (1 species) are the highest scored ecosystem services. Boundary and habitat to other important species are the least scored ecosystem services each supplied by one TOF species. However, the average score does not consider the multifunctionality of TOF species because the score value for each ecosystem services of multifunctional species is relative. The average score of each ecosystem service and count of TOF species for each ecosystem service provision are shown in Table 1.
National level ecosystem service and valuation
The amount of carbon stock is calculated using an allometric equation based on field measurements of DBH and height of each TOF in croplands. The total amount of carbon stored by TOF in the study area of 147 ha is 759 ton of carbon.
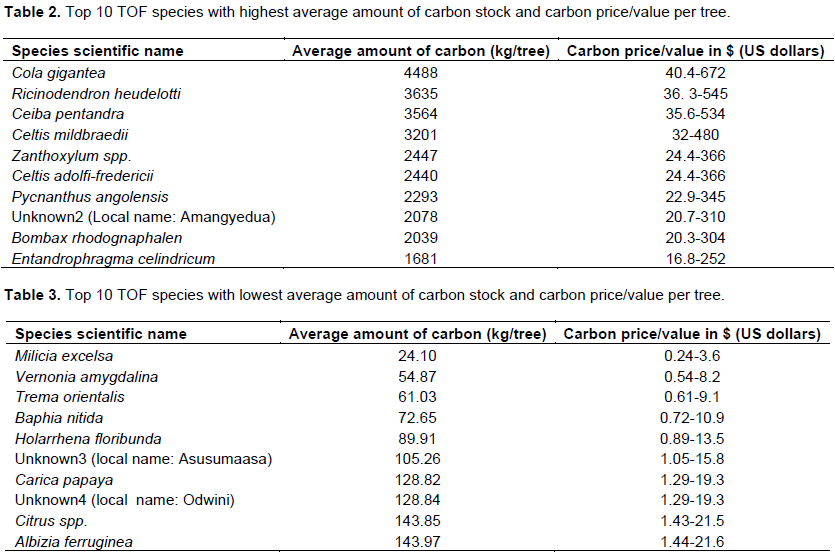
On average, 5.15 tons of carbon is stored per ha of croplands in the study area. The national ecosystem service of climate change is valued based on carbon market price per ton of carbon. The top and the least ten species based on the average amount of carbon stock stored per each TOF species and the carbon stock price/value is listed in Tables 2 and 3.
Key TOF species and locations
Comparison of local and national TOF species and ecosystem services
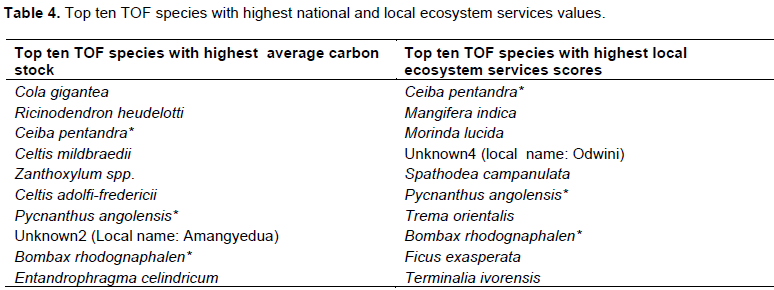
Based on the total score value of local ecosystem services and price/value of carbon stock for national ecosystem services, 30% of the top 10 TOF species with highest scores and values are the same for local and national beneficiaries. The rest 70% are different. 30% of the least 10 TOF species with lowest scores and values are also the same. The list of TOF species with highest and lowest score value local ecosystem services and price/values of national ecosystem service are presented in Table 4.
Local and national ecosystem service hotspot areas
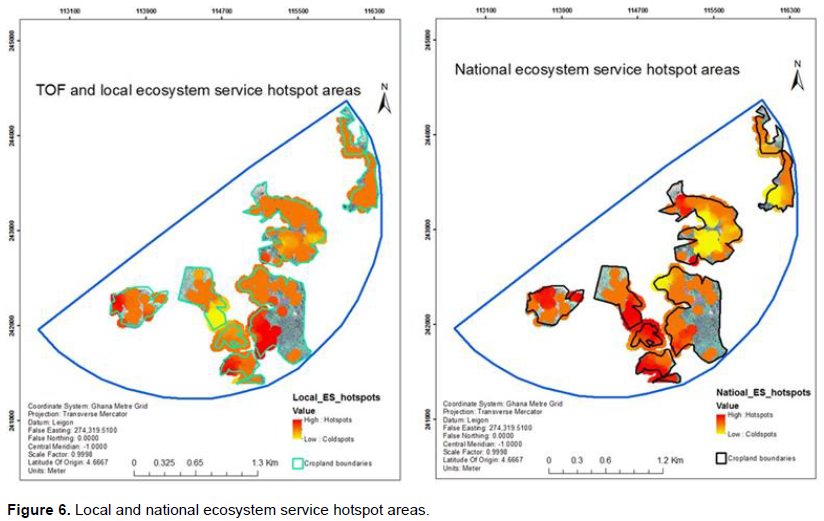
The key TOF locations are identified based on the total score values of local ecosystem services and the amount of carbon stock of each TOF using hotspot analysis in ArcGIS. The total local ecosystem service score values are calculated for each TOF species and assigned to each corresponding TOF individuals based on the particular species value in the study area. The map and location of local and national ecosystem service hotspot areas are shown in Figure 6. The places depicted in red are TOF individuals with high local ecosystem service values and national carbon stock ecosystem service values compared with the surrounding other TOF whereas the areas displayed with light brown/yellow color are TOF individuals with lowest local and national ecosystem service values. The pattern shows that some hotspot areas are the same for local and national ecosystem service beneficiaries. However, most of the hotspot areas for national beneficiaries are not hotspots for local beneficiaries as seen in the pattern of the map in Figure 6.
Mapping and assessing ecosystem services of TOF
Spatial TOF inventory and key ecosystem service findings and challenges
The first step to conducting a species and spatial inventory of TOF were visiting the croplands of the study area to record the local names and GPS locations of each individual tree using navigation tools such as maps of the study area.
The local names of all TOF individuals were identified by the local farmers, and the locations of each TOF individuals was recorded. Based on the local names, the field assistant from Kwame Nkrumah University of Science and technology with good knowledge of tree species, and searching the internet for the scientific names of each species except five species were identified. The exceptions can be because of the local names that are not recognized scientifically.
Identifying TOF species names was the key step to conduct species based ecosystem service mapping and assessment. Recording the local names and the locations of each TOF individuals in some of the croplands was difficult and time-consuming due to patchy roads and croplands.
However, on the satellite image available from Google Earth some of the patchy croplands were not clearly visible. This can be clearly linked to the difference between the field work time and time of image acquisition, a shift in land use/cover such as from cropland to fallow and vice versa, and to some extent the resolution of the available image. The time of image acquisition was dated 4/2/2015 whereas, the time of field work was from 27/09/2016 to 14/10/2016. Knowledge of the study area through different sources and if possible the actual study area prior to the actual field work visit can be important to get impressions of the challenges and solutions instead of solely depending on satellite images (Meneguzzo et al., 2013).
Fifty different TOF species and 786 TOF individuals were found in croplands of the study area as shown in Figure 3. This shows how diverse the croplands are in terms of species diversity. The locally diverse species can play important roles in surviving and adapting to climate variabilities (Dawson, 2014). The percentage occurrence of these TOF species varies from one species to another. Some species in the study area are very dominant while others are scarce in terms of a number of occurrences. The top ten most dominant species constitute 70. 61 % of the total TOF individuals found in the study area. The difference in occurrence is related to the ecosystem services (importance) and multi-functionality of the species to local farmers.
Ecosystem services are the benefits people obtain from ecosystem service provider/s which are referred to as TOF. Different TOF species in croplands provide various types of ecosystem services. The local ecosystem services of each TOF species were identified through participatory research using the interview. For this research, the ecosystem services are grouped into local ecosystem services and national ecosystem services. The local ecosystem services are services provided directly or indirectly by TOF to the local beneficiaries which can be identified by themselves whereas national ecosystem services are climate change regulation services of carbon stock that cannot be identified by local beneficiaries.
The study showed that a total of 15 different local ecosystem services were identified from all the TOF species based on local beneficiaries’ knowledge of TOF ecosystem services. All the local ecosystem services are direct and indirect services such as provisioning and regulating services respectively (Hein et al., 2006; TEEB, 2010). Cultural ecosystem services were not identified by local people. However, a study conducted in forest reserves of a different region in western part of Ghana revealed that cultural ecosystem services such as spiritual and religious, and recreational ecosystem services values were identified by local farmers (Boon and Ahenkan, 2013). This can be related to the fact that local farmers should get a service from the trees directly or indirectly unless their existence for spiritual and recreation values is not considered as an ecosystem service. Shade, timber, medicine, soil fertility and soil conservation are the top ecosystem services supplied by most of the TOF species in the study area respectively. Timber, fuel wood, and medicine have been identified as ecosystem services of tree resources (a forest reserve and surrounding off-reserve areas) in a different district in Ghana (Hapsari, 2010).
The multi-functionality of TOF species differs from one TOF species to another. However, some TOF species provide one or more of the same local ecosystem services as other TOF species. Most of the dominant top ten TOF species are multifunctional species which provide highest diversity and number of local ecosystem services. This shows that the most multifunctional TOF species are kept in croplands of the study area. All the least occurring TOF species provide less diversity and number of local ecosystem services compared to the dominant ones, but they are not the least multifunctional TOF species. This implies that the least occurring TOF species are supplying more diverse types and a number of ecosystem services than TOF species with the medium occurrence.
The national ecosystem service in this study is the amount of above ground carbon stock of TOF. Carbon stock was not mentioned by local beneficiaries. However, some of the local beneficiaries have listed shade, rainfall regulation, timber, soil fertility and soil conservation which can have national level benefits. The amount of carbon stock for each tree was calculated using allometric equations developed for Ghana and Sub-Sharan Africa according to field measurements of height and DBH.
Using both height and DBH of trees in allometric equations to calculate above-ground biomass yields better estimate compared to using DBH only (Brown et al., 1989). DBH and height of each TOF individuals were collected in the field, and the equation is selected because it yields a good result. The inclusion of DBH, height and wood density in allometric equations improves the accuracy of above ground biomass estimation and results in the best estimate (Henry et al., 2010). However, wood densities of most of the TOF species could not be found. As a result, the wood density was not applied in the calculation of carbon stock.
On average, the total amount of above ground carbon stored per hectare of land in croplands of the study area is 5.15 tons of carbon (tC ha−1). This amount of carbon stock is lower than what is found in different land uses of tropical regions. Average carbon stored by agroforestry practices in tropics has been estimated as 9, 21, 50 and 63 tC ha−1 for semi-arid, subhumid, humid and temperate regions (Montagnini and Nair, 2004). The above ground carbon in tropical dry forests has been estimated from 22.97 to 33.27 tC ha−1 (Bijalwan et al., 2010). The differences result from the land use/cover types, study area locations and the biomass estimation methods.
Key ecosystem service valuation findings and challenges
Based on the local beneficiaries’ valuation, the most dominantly occurred top ten TOF species and the most multifunctional TOF species are scored highest. Shade, charcoal, pollination to cacao plants, timber, medicine, soil fertility and soil conservation are scored the highest average values as the top most important ecosystem services according to local beneficiaries. This implies how important these particular ecosystem services are to local beneficiaries and why local beneficiaries are retaining TOF species in their croplands. For example; the beneficiaries are retaining TOF to get an ecosystem service of shade mainly to their cacao plantations and future plan of cacao farming.
This indicates that local beneficiaries are obtaining more benefits from the TOF species mainly because of these dominant local ecosystem services. The values of the key ecosystem services in this study is to some extent related to a study carried out in Sui-Forest Reserves in western Ghana which identified food production, cacao production, climate regulation and protection of river sources, timber was the most highly ranked ecosystem services supplied by forest reserves respectively (Boon and Ahenkan, 2013).
A study conducted in a forest reserve and surrounding off-reserve areas in another region of Ghana revealed fuel wood as the most important ecosystem services (Hapsari, 2010). However in this study, charcoal is one of the most important ecosystem services than fuel wood. TOF can be valued using carbon market prices (Richards and Stokes, 2004; Rashid, 2012). The price of one ton of carbon ranges from 10 to 150 US dollars (Richards and Stokes, 2004, 2003). This means that, the TOF species with highest carbon stock are valued as the highest, and the lowest are valued the lowest based on the carbon price/value. The top and least ten TOF species are therefore valued as most important and key species for climate change regulation service of carbon stock for national beneficiaries. These TOF species play vital roles in mitigating climate change by storing more carbon compared to other species in the study area.
Three of the top ten most important TOF species are important for both local and national beneficiaries. There is a poor correlation between the key species of the national and local beneficiaries. As a result, the key TOF species that have great importance to national beneficiaries but not for local beneficiaries could be under threat of illegal cutting and deforestation. In another hand, the key TOF species that are very crucial to local beneficiaries but not for national beneficiaries (carbon stock as a climate change regulation benefit) might cause conflicts of interest between both beneficiaries.
Therefore, the key TOF species for local farmers/ beneficiaries should be communicated well with the Forest Commission of Ghana to ensure a government protection. The local and national ecosystem service of key hotspots locations were mapped based on the total local ecosystem scores of each TOF species which were assigned to each tree in the study area and the value of carbon stock of each TOF in the study area. The pattern of the key TOF locations implies that most of the hotspot areas for local beneficiaries are different from hotspots of national beneficiaries.
Transferability of the methods
The study was conducted in a small study area. The method for mapping the ecosystem services of TOF species and measuring field data for each and every TOF individuals was time-consuming and costly. This makes the method challenging to work on large areas. Sampling for validation and using remote sensing with high-resolution satellite images from satellite image providers to estimate above ground carbon could be a solution to carry out TOF studies in large areas.
Implications for tree management
Maps are believed to be an important communication tool to easily communicate and discuss ecosystem services with beneficiaries of a particular ecosystem service provider/s. In this study, the supply of provisioning and regulating ecosystem services for local and national beneficiaries by TOF was identified, mapped and assessed. TOF provide different ecosystem services for their beneficiaries. The most important TOF species and locations (hotspots) based on their importance to local and national beneficiaries were identified.
The information about the location and ecosystem service values of TOF are important to national beneficiaries to understand the most important TOF locations that need special attention and monitoring. For example TOF species; such as C. pentandra*, M. indica, M. lucida, Unknown4 (local name: Odwini), S. campanulata, P. angolensis*, T. orientalis, Bombax rhodognaphalen*, F. exasperate, and T. ivorensis are the most important key species for local beneficiaries whereas Cola gigantean, Ricinodendron heudelotti, C. pentandra*, Celtis mildbraedii, Zanthoxylum spp., Celtis adolfi-fredericii, Pycnanthus angolensis, Unknown2 (Local name: Amangyedua), B. rhodognaphalen*, and Entandrophragma celindricum are the top ten most valuable trees for national beneficiaries. The tree species with a ‘*’ sign refers to the common key important TOF species both for local and national beneficiaries. Identification of the key species can help for policy and decision makers aware of local and national interests, and the ecosystem service values of TOF and their location for proper conservation and utilization of TOF.
TOF in croplands of the study area are common and diverse. They provide various ecosystem services such as provisioning and regulating ecosystem services to local and national beneficiaries. The ecosystem services of some TOF species were scored very high while others are scored low based on local beneficiaries score to local ecosystem services and carbon stock of the national ecosystem services. Significant amount of carbon is stored by TOF in croplands of the study area. The key TOF species that have great importance to national beneficiaries but not for local beneficiaries could be under treat of illegal cutting and deforestation whereas the key TOF species that are very crucial to local beneficiaries but not for national beneficiaries might cause conflicts of interest between both beneficiaries. The key TOF species for local farmers/ beneficiaries should be communicated well with the Forest Commission of Ghana to ensure government and local beneficiaries protection. In general, TOF in croplands play a great role to the beneficiaries by providing ecosystem services especially provisioning and regulating ecosystem services. Therefore, integrating TOF ecosystem services into planning and decision making requires a better understanding of the spatial location, type of TOF species and the ecosystem services, and their values to local and national beneficiaries.
The author has not declared any conflict of interests.
REFERENCES
|
Bijalwan A, Swamy SL, Sharma CM, Sharma NK, Tiwari AK (2010). Land-use, biomass and carbon estimation in dry tropical forest of Chhattisgarh region in India using satellite remote sensing and GIS. J. For. Res. 21(2):161-170.
Crossref
|
|
|
|
Bonham CD (2013). Measurements for Terrestrial Vegetation (2nd ed.). Oxford, UK: John Wiley & Sons, Ltd.
Crossref
|
|
|
|
|
Boon E, Ahenkan A (2013). Assessing Climate Change Impacts on Ecosystem Services and Livelihoods in Ghana: Case Study of Communities around Sui Forest Reserve. J. Ecosyst. Ecogr. S3:001. doi:10.4172/2157-7625.S3-001
Crossref
|
|
|
|
|
Cornelis Van Kooten G, Eagle AJ, Manley J, Smolak TM (2004). How Costly are Carbon Offsets? A Meta-Analysis of Forest Carbon Sinks. Environ. Sci. Policy 7(4):239-251.
Crossref
|
|
|
|
|
Crossman ND, Bryan BA (2009). Identifying cost-effective hotspots for restoring natural capital and enhancing landscape multifunctionality. Ecol. Econ. 68(3):654-668.
Crossref
|
|
|
|
|
Crossman ND, Burkhard B, Nedkov S, Willemen L, Petz K, Palomo I, Maes J (2013). A blueprint for mapping and modelling ecosystem services. Ecosystem Services (4):4-14.
Crossref
|
|
|
|
|
Daily GC, Polasky S, Goldstein J, Kareiva PM, Mooney HA, Pejchar L, Shallenberger R (2009). Ecosystem services in decision making: time to deliver.
|
|
|
|
|
Dawson IK (2014). Seeing the trees as well as the forest: The importance of managing forest genetic resources. Forest Ecology and Management., pp. 1-8.
|
|
|
|
|
De Foresta (2013). Towards the assessment of trees outside forests. David Taylor, Ed., Rome, Italy.
|
|
|
|
|
Felipe-Lucia MR, Comín FA, Escalera-Reyes J (2015). A framework for the social valuation of ecosystem services. Ambio 44(4):308-18.
Crossref
|
|
|
|
|
Ghana Forestry Commission. (2017). Ghana timber and wood products and applications.
|
|
|
|
|
Giner MSH (2016). Finding Hot Spots Using ArcGIS Online: Minimizing the Subjectivity of Visual Analysis. Washington DC.
|
|
|
|
|
Hapsari A (2010). Assessing and Mapping Ecosystem Services in Offinso. University of Twente Faculty of Geo-Information and Earth Observation (ITC), MSc thesis, Enschede, The Netherlands.
|
|
|
|
|
Henry M, Besnard A, Asante WA, Eshun J, Adu-Bredu S, Valentini R, Saint-Andre L (2010). Wood density, phytomass variations within and among trees, and allometric equations in a tropical rainforest of Africa. For. Ecol. Manag. 260(8):1375-1388.
Crossref
|
|
|
|
|
Hein L, van Koppen K, de Groot RS, van Ierland EC (2006). Spatial scales, stakeholders and the valuation of ecosystem services. In Ecological Economics 57:209-228.
Crossref
|
|
|
|
|
Herrera-Fernández B (2003). Classification and modeling of trees outside forest in central American landscapes by combining remotely sensed data and GIS.
|
|
|
|
|
Locus Map - knowledge base (2016). Locus Map Basics.
View
|
|
|
|
|
Meneguzzo DM, Liknes GC, Nelson MD (2013). Mapping trees outside forests using high-resolution aerial imagery: a comparison of pixel- and object-based classification approaches. Environ. Monit. Asses. 185(8):6261–6275.
Crossref
|
|
|
|
|
Montagnini F, Nair PKR (2004). Carbon sequestration: An underexploited environmental benefit of agroforestry systems. Agrofor. Syst. 61: 281-295.
Crossref
|
|
|
|
|
Rashid RPS (2012). Assessment of cArbon stocks as an ecosystem service at Rusenski Lom nature park.
View
|
|
|
|
|
Richards KR, Stokes C (2003). A review of forest carbon sequestration cost studies: A dozen years of research. Climatic Change 63(1):1-48.
|
|
|
|
|
Scharlemann JPW, Kapos V, Campbell A, Lysenko I, Burgess ND, Hansen MC, Miles L (2010). Securing tropical forest carbon: the contribution of protected areas to REDD. Oryx 44(3):352-357.
Crossref
|
|
|
|
|
Schnell S, Kleinn C, Ståhl G (2015a). Monitoring trees outside forests: a review. Environ. Monit. Assess 187(9):600.
Crossref
|
|
|
|
|
Schnell S, Kleinn C, Ståhl G (2015b). Monitoring trees outside forests: a review. Environ. Monit. Assess 187(9):600.
Crossref
|
|
|
|
|
Sinare H, Gordon LJ. (2015). Ecosystem services from woody vegetation on agricultural lands in Sudano-Sahelian West Africa. Agric. Ecosyst. Environ. 200:186-199.
Crossref
|
|
|
|
|
TEEB (2010). The Economics of Ecosystems and Biodiversity: Mainstreaming the Economics of Nature: A synthesis of the approach, conclusions and recommendations of TEEB.
|
|
|
|
|
Vashum KT, Jayakumar S,T, Vashum K (2012). Methods to Estimate Above-Ground Biomass and Carbon Stock in Natural Forests - A Review. J. Ecosyst. Ecogr. 2(4):1000116.
Crossref
|
|
|
|
|
World Agroforestry Centre (2011). Retrieved January 25, 2017, from
View
|
|
|
|
|
Zahidi I (2015). Object-based classification of QuickBird image and low point density LIDAR for tropical trees and shrubs mapping. Eur. J. Remote Sens. 48:423.
Crossref
|
|