ABSTRACT
A study on the population status, feeding ecology and activity pattern of common bushbuck (Tragelaphus scriptus decula) was carried out in the Sekele Mariam Forest from December 2016 to August 2017 including wet and dry seasons. Data were collected using total count and direct observation method. The collected data was analyzed using descriptive statistics and compared with Chi-square test and one way ANOVA. Average number of bushbuck in the study area was 47 and 30 during the wet and dry season, respectively. There was no significant difference between the wet and dry season in the population size (c2 = 0.17, df = 2, P > 0.05). Of the total individuals observed, 70.1% constituted adults, 22.1% sub-adults and 7.8% were young. The maximum group size was 4 and 3 observed during wet and dry seasons, respectively. The minimum group size recorded was 1 during both wet and dry seasons. The sex ratio of adult males to adult females was 1:1.58 and 1:1.87, sub adult males to sub adult female 1:1.40 and 1:1.50 during wet and dry seasons, respectively. Bushbucks were mostly browser than grazer during both seasons. They consumed a total of 20 plant species in the study area. Most preferred food item was Maytenus arbutifolia (16%) followed by Maytenus gracilipes (15.2%). Young leaves and mature leaves comprised the largest proportion of the food items consumed. There was significant difference between plant part consumed by bushbuck during wet and dry seasons (c2 = 88.22, df = 4, P ≤ 0.05). Feeding was the major activity (45.1%), followed by resting (22.3%), whereas fighting (1.3%) was the least activity conducted by the animal. There was significant difference (F 8, 974 = 6.95, P< 0.05) between daily activity patterns within time of the day. In order to increase the number of bushbucks’ and to create a suitable habitat different conservation measures like avoiding agricultural encroachment and fragmentation should be taken.
Key words: Activity pattern, bushbuck, feeding ecology, population status.
Common bushbuck (Traglaphus scriptus decula) is a widely distributed antelope in the sub-Saharan Africa except for the extreme desert regions (East, 1999; Moodley and Bruford, 2007). It is a medium sized and an-even toed ungulate (Artiodactyla) belonging to the family Bovidae and subfamily Tragelaphini (Moodly
and Wronski, 2009). The animals mostly occur up to 4000 m on the East African mountains and they live in various habitats, including rain forests, forest-savanna mosaics, and bush savannas (Wronski et al., 2009). The main habitats of bushbucks are woodlands and dense forests (Apio and Wronski, 2005).
The bushbuck is an extremely flexible species surviving in numerous anthropogenically influenced habitats andadaptability in habitat use may be a key to its survival, even in densely settled areas and urban surroundings with severe hunting pressure (Wronski, 2005). Bushbucks are primarily browsers and also known to graze occasionally. Grazing is reported to be more frequent during the night than the daytime. Their diet includes leaves and fine twigs as well as flowers, fruits and grass (Dankwa-Wiredu and Euler, 2002).
Over the last decades, the bushbuck has received little attention by animal biologists and conservationists since it is found in almost all habitats of sub-Saharan Africa and occurring in approximately 73% of the total land area (Moodly and Wronski, 2009). The bushbuck formerly occurred widely in sub-Saharan Africa wherever there was adequate cover and access to permanent water. But it is absent in the primary lowland forest of the Congo basin, in the Somali-arid area (Horn of Africa) and in the South and South West African arid and semi-arid habitats (Moodley and Bruford, 2007).
Limited research has been conducted on common bushbuck in Ethiopia. Specifically, there was no documented information and research on population status, feeding ecology and activity pattern of common bushbuck in Sekele Mariam Forest. It is an initial to set a baseline study. In addition, studying about population size, feeding ecology and activity pattern was an important topic to give information to responsible bodies in the conservation of bushbucks. For effective conservation practice of the wildlife species, it needs assessing of the current population status, feeding ecology and activity pattern of the mammals. This helps to design appropriate management strategies for that specific population. Therefore, the present study was crucial to study the population status, feeding ecology and activity patterns of bushbuck in Sekele Mariam Forests, West Gojjam.
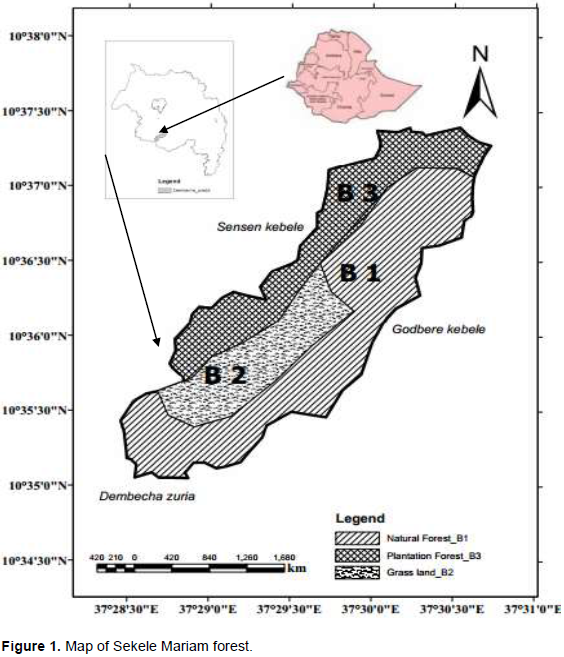
Sekele Mariam Forest is found in Amhara region, West Gojjam zone about 52 km West of Debre Markos and 352 km North of Addis Ababa. The forest is geographically located between 37° 28' 30''and 37° 31' east longitude, and 10° 34' 30'' and 10° 36' latitude north (Yitayal, 2016) (Figure 1). The study area covered about 723 ha (DWARDO, 2012).

The topography of Sekele Mariam forest is mountainous with cliffs and accompanied by rocks. The altitudinal variation ranges from 1530 to 2999 m above sea level. Various soil types are found in the study area, red (loam) soil (65%), black (silt loam) soil (10%) and brown (25%) (DWARDO, 2012). The average annual rainfall of the study area is 1502.01 mm ranging from 1283.1 mm minimum in 2010 to maximum of 1639.4 mm in 2017. The average temperature of the surrounding area is about 18.74°C with a maximum of 27.04°C and minimum of 9.65°C recorded from 2010 to 2017 (Yitayal, 2016).
Sekele Mariam forest has three major habitat types. These are natural forest, plantation and grassland. In the natural forest dominant woody plants species are like large-leaved cordial (Cordia africana), fig tree (Ficus vasta), flat-top acacia (Acacia abyssinica), peacock flower (Albizia gummifera), silky oak (Gravilia robusta), African juniper (Juniperus procera), Ficus sur (Coroton macrostachvus) and shrub species such as Ethiopian rose (Rosa abysinica), Mubondo (Combertum molle), wild sage (Maytenus senegale), simple-spined num-num (Carissa spinarium), Maytenus arbutifolia, bitter leaf (Vernonia amygadalina) and Rubus steudneri. In the grassland habitat also different grass species like Chloris spice, Cyanodon dactaylon, Curdus ellenbeckii, and Cyperus rigidifolius Steud are mentioned. In plantation forest such species as Cupressus Lusitania, Eucalyptus cammaldunesis, Eucalyptus citrodora, Eucalyptus globules, and Acacia decurens are found (DWARDO, 2012).
There are also different wild animal species found in the studied area. Some of them are spotted hyena (Crocuta crocuta), Anubis baboon (Papio anubis), White-tailed mongoose (Ichneunia albicauda) Abyssinian Genet (Genetta abyssinica) Colobus monkey (Colobus guereza), Grivet monkey (Cercopethicus aethiops), Common bushbuck (Tragelaphus scriptus), Common jackal (Canis aureus), Bush duiker (Sylvicarpra grimmia) and Wood chuck (Marmota monax). Some bird species such as White collared pigeon (Cilumba albitoreques), White-rumped babber (Turdoides leucopygia) and Vulture (Gypaetus barbatus) are found in the area (DWARDO, 2012).
During the studied period, bushbuck population counting was done using total counting method (Rabira, 2015) by counting the whole individuals of the population through direct observation during both dry and wet seasons. The studied area was classified to three different conditions (blocks), natural forest (B-1), grasslands (B-2) and plantation (B-3) based on vegetation types and visibility of animals lives in each habitat type (Tewoderos and Afework, 2008). Then, trained people were assigned in each habitat type based on the area size of the habitat. To reduce the problem of double counting, the counting was designed based on natural and artificial boundaries, like small gorges and main roads which act as a barrier (Wodmagegnehu and Afework, 2011).
Data collection
Total count method was used to record the population size and direct observation was used to record feeding ecology and activity pattern of the bushbuck, respectively (Mesele and Afework, 2012). The data was collected by dividing the study period into seasons, dry and wet season (Dereje et al., 2011), that is, December 2016 and January 2017 to accommodate dry season and from July and August 2017 to accommodate wet season. Data were collected two times a day, in the early morning and late afternoon when the animals were active (Reta and Solomon, 2013).
Population census
Population status of bushbuck was assessed by using total counting method (Rabira, 2015). During counting, information like date, time, altitude, habitat type, GPS location, total number of animals, group size, and age group (adult male, adult female, young and sex) were recorded (Rabira, 2015). Identification of male and female individuals was done based on the presence or absence of horn. The approximate age structure was identified by body size, horn size and shape of the animal. Individuals which are small in size were recorded as young and individuals which are large in size were recorded as adult (Abebayehu and Tilaye, 2012).
Feeding ecology
Data on feeding ecology was recorded by direct observation (using focal sampling method) from appropriate vantage points. This includes watching an individual for a fixed period of 10 min within naked eye or binocular according to the size and the distance of the animal from the observer and recording the activities such as the type of food items consumed and amount of time spent for foraging (Mesele and Afework, 2012). When the study animal was observed during feeding time, the plant type (tree, shrub or herb), plant species, and part of the plant consumed like leaf, twig, shoot, bark, flower, seed or fruit was recorded (Dereje et al., 2011). Furthermore, foraging types including browsing and grazing were also recorded during both dry and wet seasons. Each record was counted when individual bushbucks were observed feeding continuously from a single plant species or plant group (Smits, 1986). Immediately after the animal moved away from the site, freshly cut plants were carefully examined (Brnesh et al., 2015). From the plant species consumed by the observed animal, samples were collected and taken to Debre Markos University for identification purpose.
Activity pattern
Data on activity patterns of bushbucks was collected using scan sampling method (Altman, 1974). Individual animal was randomly selected by stratifying based on age and sex. When the animal was in a group, the dominant activity of the group was recorded at the beginning of the observation and observation carried out at 15 min intervals for 3 min from 06:00 to 18:00 h. All activities like feeding, walking, resting/lying, standing, running, playing, grooming, fighting and other activities (courting, defecating, sniffing of genitalia, antagonism towards other bushbuck and other social interactions) were recorded. Identification of the scanned individual was recorded and assigned to one of the following age/sex classes: adult male, adult female, sub-adult male, sub-adult female and unidentified sex/young (Wondimagegnehu and Afework, 2015).
Data analysis
All data collected were computed using Statistical Package for Social Science (SPSS) version 16 software program and analyzed by descriptive statistics. Differences between age and sex, groups and population size across seasons in each block were statistically analyzed using Chi-square test. The activity pattern in seasonal and hourly time budget among age sex group were tested using one way ANOVA.
Population status
The maximum number of bushbuck recorded was 47 during the wet season and 30 during the dry season. The average number of individuals during wet and dry season was 38.5. The maximum average numbers of bushbuck were recorded in Block 1 and minimum average numbers of bushbuck were recorded in Block 2. There was no statistical significant difference (c2 = 0.17, df = 2, P>0.05) between wet and dry season population size among each blocks. However, there was a slight increment of population size in the wet season as compared to the dry season (Table 1).
Age and sex structure
The age structure of total population was dominated by adults (Table 2). Out of 47 counted individuals of bushbucks, 31 adults, 12 sub adults and 4 young individuals were recorded during the wet season. During the dry season, 30 individuals of bushbucks were recorded, 23 were adults, 5 sub adults and 2 young. Adult individual were the first largest proportion in terms of their number and sub adults were the second largest proportion.
Young showed the least proportion in terms of their number counted during wet and dry seasons. Even though the population was characterized by more adult individuals, there was no significant difference (c2 = 1.03, df = 2, P > 0.05) between the number of individuals and in each age category during both wet and dry seasons.
Of the total individuals observed in the study area, 26% were adult males, 44.2% adult females, 9.1% sub adult males, 13% sub adult females and 7.8% young (Table 3). The number of adult females was relatively higher than the other age groups in both seasons. There was no significant difference during wet and dry season (c2 = 1.12, df = 4, P > 0.05).
In both seasons, the sex ratio of adult individuals biased towards females, the number of sub adult male individuals was also low relative to the number of adult females (Table 4). The sex and age ratio of sub adult females and adult females were greater during both the wet (1:5.00) and dry (1:2.75) seasons. Therefore, the population was characterized by more adult and more adult female individuals.
The group size also differed in each habitat type. The maximum group size recorded was 4 and 3 observed during wet and dry season in the natural forest. On the other hand, the minimum group size recorded was 1 during both wet and dry seasons. There were no significant differences in the group size across season (c2 = 2.25, df = 2, P<0.05). Mean group size was 1.89 ± 0.8 and 1.53 ± 0.7 during the wet and dry seasons, respectively. The average group size was 1.71±0.76 during wet and dry seasons.
Habitat association
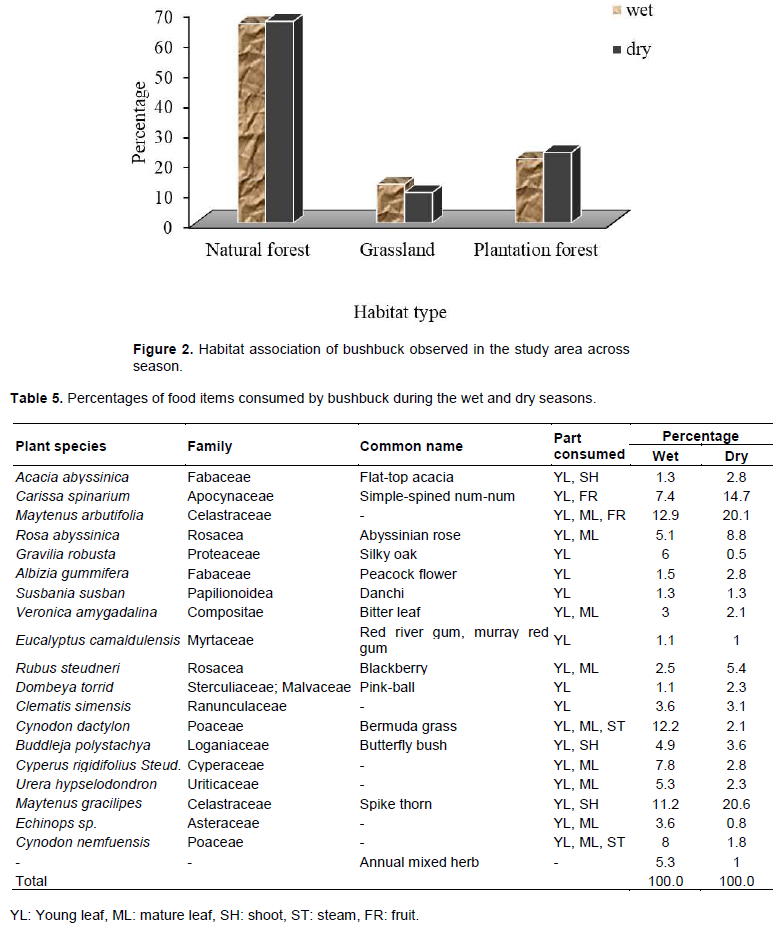
Bushbucks’ populations were distributed into the three habitat types. The number of bushbuck counted varied per habitat type. The highest (66.2%) number was recorded in natural forest during both seasons and the lowest (11.7%) number was recorded in grassland area during both seasons. The bushbuck distribution showed a very high utilization in natural forest. The comparative use of different habitat types by bushbuck in the study areas was indicated by the number of individuals observed in each habitat type. The natural forest was the highly utilized habitat during both seasons and plantation forest habitat was the second habitat type utilized during wet and dry season. However, bushbucks mostly did not spend their time in grassland habitat during dry season. The variation in the number of bushbucks observed in different habitats types was not statistically significant (c2 = 0.15, df = 4, P > 0.05) (Figure 2).
Feeding ecology
A total of 914 feeding activity observations were recorded in the studied area. A total of 20 plant species belonging to 16 families were recorded serving as food for bushbuck in Sekele Mariam Forest. These were: A. abyssinica (2.0), C. spinarium (10.5), M. arbutifolia (16.0%), Rosa abyssinica (6.7%), G. robusta (1.8%), A. gummifera (2.1%), Susbania susban (1.3%), Veronica amygadalina (2.6%), Eucalyptus camaldulensis (1.1%), R. steudneri (3.7%), Cynodon dactaylon (7.9%), Dombeya torrid (1.6%), Clematis hirsute (3.4%), Buddleja polystachya (4.4%), C. rigidifolius Steud (5.7%), Chiliocephalum schimperi (4.0%), Maytenus gracilipus (15.2%), Echinops species (2.4%), Cynodon nlemfuensis (5.4%) and annual mixed herb (3.5%). From these plant species, 9.7% were tree, 17.8% were herb, 6.8% were climber, and 65.6% were shrub. There was statically significant difference (c2 = 1.29, df = 19, P < 0.05) in the percentage of plant species consumed between the wet and dry seasons (Table 5).

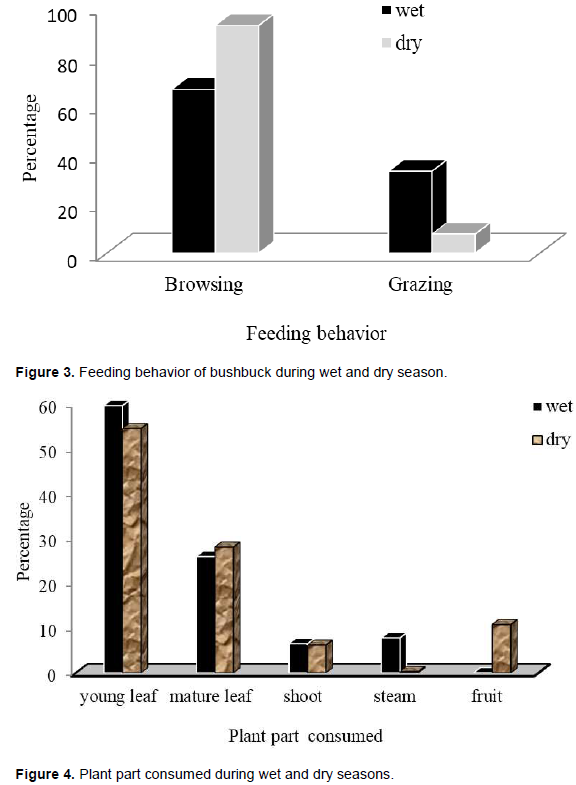
According to the study, bushbucks were more browser than grazers. Bushbucks browsed 92.3% of their time during the dry season and 66.7% during the wet season and grazed 33.5% of their time during the wet season and 7.7% during the dry season. Browsing was more frequent than grazing in both wet and dry seasons. Therefore, there was a statistical significant variation (c2 = 83.7, df = 1, P < 0.05) in the proportions of grazing and browsing in both wet and dry seasons (Figure 3).
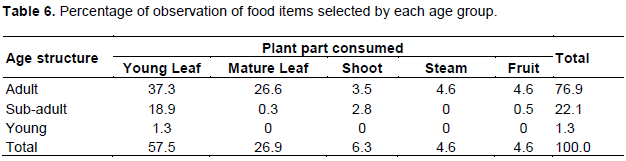
Most of the time bushbucks feed on young leaves during both wet and dry seasons. Mature leaves were the second favored food items. Steam, shoot and fruits were consumed rarely. There was a statically significant difference in plant part consumed during wet and dry seasons (c2 = 88.22, df = 4, P< 0.05) (Figure 4)
Among different plant species bushbucks feed on different plant parts in the studied area. Adults were frequently fed on young leaves and mature leaves and sub adults were also frequently fed on young leaves. There was a statistically significant difference (F 2, 911 = 21.73, df = 2, P< 0.05) in plant part consumed between age group (Table 6).
Activity pattern
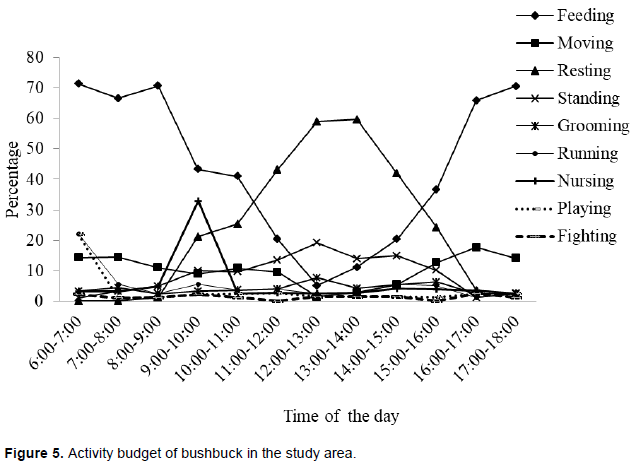
A total of 2643 observation on activities were recorded.
Feeding comprised the major activity (45.1%), followed by resting (22.3%), moving (10.5%), standing (8.3%), running (3.6%), grooming (4.1%), nursing (3.3%), playing (1.8%), and fighting (1.3%). The highest and peak activities were observed early morning and late afternoon with feeding and during the mid-day with resting. Therefore, there was statically significant difference (F 8, 974 = 6.95, P< 0.05) between diurnal activity patterns of bushbuck within time of the day (Figure 5).
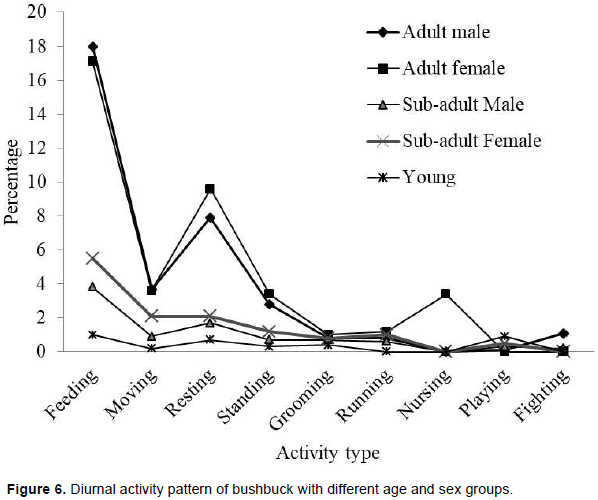
Adult males spend most of their time on feeding (18%), while 7.8 and 3.7% of the time was spent resting and moving, respectively. Only 0.1% of the time was used for playing. Adult females spend most of their time feeding (17.1%), followed by resting (9.6%), and moving (3.6%) and of the time (3.4%) was used for both standing and nursing. Sub-adult males spent about 3.8% of their time feeding, while 1.7%and 0.9% of the time was spent resting and moving, respectively. Sub adult females spent 5.5, 2.1 and 2.1% of their time feeding, moving and standing, respectively. Young adult spent 1, 0.9 and 0.7% of their time feeding, playing and moving, respectively. The afternoon peaks were greater than the morning peaks, during wet and dry seasons for both age and sexes. There was significant difference (F 4, 978 = 7.36, P < 0.05) between diurnal activity within age and sex groups during both wet and dry seasons (Figure 6).
The average number of bushbuck was decreased from 47 (wet season) to 30 (dry season) in the studied area. This might be due to the presence of enough food during the wet season but less in the dry season which is similar with Brnesh et al. (2015). The average number of Menelik’s Bushbuck (Tragelaphus scriptus meneliki) was decreased from 72 to 64 in Wof-Washa Forest. When food resource availability gets low, bushbucks often leave their original habitat in order to search for sufficient food resources. So, moving or traveling a long distance to find their food decreases the population size in the studied area. Nevertheless, they will not spend much time in foraging by traveling a long distance to other areas in order to search their food if there is high food availability.
Though there was slight seasonal difference in their population size but, the seasonal variation of their status was not statically significant.
The age structure of total population was dominated by more adults (Table 2). But the number of sub-adults and young individuals counted during both seasons varies slightly which does go in line with the findings of Dereje et al. (2011) which indicate that bushbucks are seasonal in their reproductive behavior. Hence, there was no significant difference between each age category during both wet and dry seasons.
The sex ratio and age distribution of individual mammals is necessary for the evaluation of the viability of the animal species. These showed the structure and dynamics of the population (Allsopp, 1978). Based on this understanding, the population dynamics allow for the protection and eventual survival of an animal species (Dereje et al., 2011). The result of the present study revealed that the male to female sex ratio was 1:1.80 and 1:1.52 during the wet and dry seasons, respectively. Females were dominant in the bushbuck population which indicates that bushbucks have a potential to increase in their number. The possible reason for variation in sex ratio may be largely due to increase in mortality of males because they are more prone to predation than females and less vigilant when engaged in social interactions or because their condition is poor due to permanent agonistic interactions with other males (Wronski et al., 2006a). Their solitary nature towards forming small groups also enhances the vulnerability of males towards predators (Jacobsen, 1974). This is because males leave their mother after maturity, while females remain there to form a mother clan (Wronski et al., 2006b). The explanation for male mortality is that sub-adult males are distributed often in less favorable habitat as the central core area is inhabited by territorial males (Wronski, 2005). Moreover, illegal hunting by poachers mostly affects males which reduce the sex ratio. Additionally, the small number of young in the present study may show a declining trend of the animal as a result of low percentage of breeding females or higher percentage of young predation. The presence of lower number of young might be due to a tendency to be kept hidden under thickets or shrubs for the first four months since their born. Hence, they could have been less in number during the survey (Dereje et al., 2011). Consequently, they may be susceptible to predators at this stage as they are unable to escape.
The minimum and maximum group size ranges from 1 to 2 and 3 to 4 individuals during wet and dry season, respectively. The variation in group size during the wet and dry seasons could be a result of changes in the availability of resources required in different habitat types and the surrounding weather conditions. The present study confirmed that bushbuck is known to be solitary (Wronski et al., 2009). 57 and 36% of the population observed solitary during the dry and wet seasons, respectively. Male-to-female pair was observed frequently during the wet season. Such pairings were common during the breeding season. The other common form of pairing known in bushbucks was that of mother and young. The observed proportion of such pairing in the present study was low. It is known that the young bushbucks hide themselves to avoid predation risk. Therefore, they tend to have less detection probability by observers and this could explain the low proportion of female-to-young pairs observed by Abebayehu and Tilaye (2012).
Based on the result, the aggregation of group of bushbuck population in the dry season in a limited area and splitting into smaller groups and dispersal to a wider area may be due to their selective feeding behavior to get more preferable forage and they are mostly solitary. This supports the findings of Wronski et al. (2009), which observed that bushbucks are indeed a solitary species, as one individual peer group was the most frequent group size in both adults and sub adult groups in all populations they examined. During the wet season, the solar radiation is reduced by the cloud cover; hence, the animals leave dense forest and congregate in the open for feeding. But during dry season, they prefer thicket clumps to be protected from the intensive solar radiation. The other possible reason may also be their tendency to avoid predation in small group size as there is less cover during the dry season due to defoliation. This is because bushbucks mostly defend themselves by hiding in thickets rather than combating, although males defend themselves when they are exposed.
The dominant habitat type in Sekele Mariam forest is the natural forest. The average number of individuals recorded per habitat was relatively higher in the natural forest, however, significantly less in the grassland habitat. This habitat has scarce food and little cover to be frequent by the animals especially during the dry season. Similarly, open vegetation was reported not favored by the species (Okiria, 1980; Brnesh et al., 2015). The quality and quantity of food vary in between seasons and habitats. In the present study, the variation of food items forced bushbucks to utilize some food items in a relatively lower quantity during the dry season than the amount they took during the wet season and vice versa. Several authors have shown that it is important to assess the quantity and quality of the most and the least eaten plant species that makes the bulk of the diet of a herbivore (Odendaal, 1983; Macleod et al., 1996; Apio and Wronski, 2005). The availability of data on feeding behavior is used to specify the proportion of the diet containing different food items.
During the present study, 20 plant species were observed as a food source of the study animal. This study showed that the number of plant species found in the diet of bushbuck in each season varied slightly. The diet observed during the study period comprised mainly shrubs. This is in accordance with previous studies of Brnesh et al. (2015) and Dankwa-Wiredu and Euler (2002), for the common bushbucks. The bushbuck is a selective feeder with shrubs and herbs forming the basic food. Shrubs were eaten throughout the year but herbs were slightly favored during the wet seasons. The present observation shows that bushbucks are mixed feeders, which rely on browsing herbs, shrubs and ground level bushes and grazing on a grass species. This is related to the findings of Dereje et al. (2011), for bushbuck and other ungulate species. However, during the dry season, the amount of time spent for feeding on shrubs and trees increased as the availability of grasses and annual herbs decreased. In the study carried out by Okiria (1980), common bushbucks exhibited a similar strategy by concentrating to feed on the available shrub species during the dry season. During the rainy season they consumed herb species. This adaptive feeding style most probably contributed to the pronounced seasonality in foraging behavior. This corresponds with the bushbucks’ ability to utilize a wide range of plant species as already reported by other researchers (Okiria, 1980; MacLeod et al., 1996; Bernesh et al., 2015). They consumed all plant parts, however, young leaves constituted the largest proportion (57%) of their diet followed by mature leaves, while shoots and stems were used least. Fruits are available only on seasonal basis. Dereje et al. (2011) also reported similar observations.
Diurnal feeding behavior indicates that bushbucks were mostly active during early morning (between 06:00-09:00 h) and late afternoon (between 16:00-18:00 h). They devoted more time for feeding in the early morning and late afternoon during both the wet and dry seasons. Similarly, Reta (2014), Wondmagegnehu and Afework (2011) and Dereje et al. (2011) concluded that feeding is the most important activity for all organisms in which they devoted most of their time. Feeding was observed to be the lowest at midday. The possible reason may be the influence of temperature (30°C) which affects the turgidity of plants and in turn affect the plants’ palatability (Dankwa-Wiredu and Euler, 2002; Reta, 2014). However, when the temperature exceeded 31°C, the plants became flaccid due to loss of water and probably less palatable. Feeding may take place at all hours of the day until dusk but drastic reduction in feeding activity was seen between 11:00 and 14:00 h.
Bushbucks also spent most of their time with feeding followed by resting relative to other activities conducted during both seasons. But during the dry season, feeding is decreased when compared with wet season due to high diurnal temperatures and consequently, the need for shelter to overcome
heat stress and water loss. Therefore, resting is more frequent during dry season than wet season. Resting is high during the midday as the activities are affected by temperature. Most animals remain inactive during the noon hours, the hottest period.
The amount of time spent in open area decreases as the day becomes warm, with a corresponding increase in resting the shade. During resting period, they lie in grass with their heads erect, keeping a watchful eye around them in all directions. When they feel there is no danger, they continue their usual activities. If suddenly disturbed, they produce a sound that helps keep the group in vocal contact and run away. After running for a few distances, they stop and look back at the source of disturbance. Other activities such as sniffing of genitalia, urination, defecation, drinking and other social activities were mainly observed during the warm resting periods between 1100 and 1400 h. Adult females spend longer time for feeding and moving than adult males. All the age-sex categories spent more time for feeding and moving during the wet season than the dry season. Dereje et al. (2011) also obtained similar results on activity time budget.
The overall status of the current population of bushbuck appears to be in immediate threat in the study area; there are many conservation problems that could affect the species in this area. The threats include human-induced habitat loss and degradation through deforestation, livestock grazing, encroachment and environmental degradation. Especially, the artificial plantation is deforested from time to time and accelerates loss of biodiversity in the study area. The scarcity of food in the degraded habitat will have profound negative impact on the study animal and other wildlife. Therefore, effective conservation measures should be done in the area.
The authors are thankful to Debre Markos University for helping them to conduct this study.
REFERENCES
|
Abebayehu D, Tilaye W (2012). Population density, structure and grouping pattern of Menelik's bushbuck in the Menagesha-Suba State Forest, Ethiopia. SINET: Ethiopian Journal of Science 35(2):129-134.
|
|
|
|
Allsop R (1978). Social biology of bushbuck (Tragelaphus scriptus Pallas 1776) in the Nairobi National Park, Kenya. African Journal of Ecology 16(3):153-165.
Crossref
|
|
|
|
|
Altman J (1974). Observational study of behavior: sampling methods. Behaviour 49(3):227-266.
Crossref
|
|
|
|
|
Apio A, Wronski T (2005). Foraging behaviour and diet composition of bushbuck (Tragelaphus scriptus Pallas, 1766) in Queen Elizabeth National Park, western Uganda. African Journal of Ecology 43(3):225-232.
Crossref
|
|
|
|
|
Brnesh H, Tsegaye G, Tadese H, Gelaye G (2015). The Status and Feeding Ecology of Menelik's Bushbuck (Tragelaphus scriptus meneliki) in Wof-Washa Forest, North Shoa, Ethiopia. International Journal Current Research 7(5):16366-16370.
|
|
|
|
|
Dankwa-Wirdu B, Euler D (2002). Bushbuck (Tragelaphus scriptus Pallas) habitat in mole national park, northern Ghana. African Journal of Ecology 40(1):35-41.
Crossref
|
|
|
|
|
Dereje Y, Yosef M, Afework B (2011). Population Ecology of Menelik's Bushbuck (Tragelaphus scriptus meneliki, Neumann 1902) from Denkoro Forest Proposed National Park, Northern Ethiopia. International Journal of Ecology and Environmental Sciences 37(1):1-13.
|
|
|
|
|
DWARDO (2012). Environmental Management plan of Denbecha Woreda., Unpublished document Ethiopia P 77.
|
|
|
|
|
East R (1999). African Antelope Database IUCN, Gland, Switzerland and Cambridge UK, Antelope Specialist Group.
View
|
|
|
|
|
Macleod S, Kerley G, Gayland A (1996). Habitat and diet of bush buck Tragelaphus scriptus in the Woody Cape Nature Reserve: observations from faecal analysis. South African Journal of Wildlife Research 26(1):19-25.
|
|
|
|
|
Mesele Y, Afework B (2012). Population Status, Feeding Ecology and Activity Patterns of Grant's Gazelle (Gazella granti) in Abijata-Shalla Lakes National Park, Ethiopia. Journal of Biological Sciences 5:20-29.
|
|
|
|
|
Moodley Y, Bruford M (2007). Molecular biogeography: towards an integrated framework for conserving pan-African biodiversity. PloS one 2(5):e454.
Crossref
|
|
|
|
|
Moodly Y, Wronski T (2009). Bushbuck harnessed antelopes or both. Gunsttler 28(1):17-18.
View
|
|
|
|
|
Odendaal P (1983). Feeding habits and nutrition of bush buck in the Knysna forests during winter. South African Journal of Wildlife Research 13(2):27-31.
|
|
|
|
|
Okiria R (1980). Habitat exploitation by the bushbuck in Rwenzori National Park. African Journal of Ecology 18(1):11-17.
Crossref
|
|
|
|
|
Rabira G, Tsegaye G, Tadesse H (2015). The diversity, abundance and habitat association of medium and large-sized mammals of Dati Wolel National Park, Western Ethiopia. International Journal of Biodiversity and Conservation 7(2):112-118.
Crossref
|
|
|
|
|
Reta R (2014). Diurnal activity patterns of Burchells zebra (Equus quagga, Gray 1824) in Yabello Wildlife Sanctuary, Southern Ethiopia. International Journal of Biodiversity and Conservation 6(8):616-623.
Crossref
|
|
|
|
|
Reta R, Solomon Y (2013). Distribution, abundance and population status of Burchells zebra (Equus quagga) in Yabello Wildlife Sanctuary, Southern Ethiopia. Journal of Ecology and Natural Environment 5(3):40-49.
Crossref
|
|
|
|
|
Smits CMM (1986). Diet composition and habitat use of the West African bushbuck Tragelaphus scriptus scriptus (Pallas, 1776) during the first half of the dry season. African Zoology 21(1):89-94.
|
|
|
|
|
Wondimagegnehu T, Afework B (2015). Diurnal activity pattern of oribi (Ourebia ourebi) in Maze National Park, Ethiopia. International Journal of Ecology and Ecosolution 2(3):31-35.
|
|
|
|
|
Wondmagegnehu T, Afework B (2011). Population Status, Foraging and Diurnal Activity Patterns of Oribi (Ourebia ourebi) in Senkele Swayne's Hartebeest Sanctuary, Ethiopia. SINET: Ethiopian Journal of Science 34(1):29-38.
|
|
|
|
|
Wronski T (2005). Home-range overlap and spatial organization as indicators for territoriality among male bushbuck (Tragelaphus scriptus). Journal of Zoology 266(3):227-235.
Crossref
|
|
|
|
|
Wronski T, Apio A, Baranga J, Plath M (2006a). Scent marking and territorial defence in male bushbuck (Tragelaphus scriptus). Journal
Crossref
|
|
|
|
|
Wronski T, Apio A, Plath M, Averbeck C (2009). Do ecotypes of bushbuck differ in grouping patterns?. Acta Ethologica 12(2):71-78.
Crossref
|
|
|
|
|
Wronski T, Tiedemann R, Apio A, Plath M (2006b). Cover, food, competitors and individual densities within bushbuck Tragelaphus scriptus female clan home ranges. Acta theriologica 51(3):319-326.
Crossref
|
|
|
|
|
Yitayal T (2015). Carbon stock estimation of Sekle Mariam state forest: Implication for climate change mitigation in West Gojjam Ethiopia. LAP LAMBERT Academic publishing Germany. pp. 1-67.
View
|
|