ABSTRACT
We investigated the effect of cocoa farming on biodiversity and ecosystem services under different cocoa management systems. The study was carried out in three cocoa producing districts in southwestern Ghana using Y-frame sampling scheme. Five 25 m × 25 m size plots were demarcated at 100 m intervals along in the cocoa farms and the natural forest reserves. Fifteen plots were demarcated in the cocoa farms per community giving a total of 90 plots. Significant decrease in tree species diversity and soil microfungi diversity were recorded in the intensive cocoa farmland compared traditional cocoa and natural forest. Soil invertebrate species diversity was high in traditional cocoa farms than in natural forest. Shaded litter fall production declined in the different cocoa management systems. Total nitrogen content and phosphorus were high in intensive cocoa farms and low in the natural forest. Soil organic carbon was high in the natural forest and low in the intensive cocoa farms. Total litter mass was high in the traditional cocoa farms and low in natural forests. The magnitude of carbon stocks decrease in the cocoa farms compared to the natural forest. For a successful cocoa production, shaded cocoa agroforest system must be encouraged in order to ensure biodiversity conservation, ecosystem services and a sustainable management of cocoa farmlands to check global climate change.
Key words: Agricultural intensification, biodiversity conservation, ecosystem services, deforestation.
Tropical rainforests cover only about 7% of the earth’s land surface and they are estimated to contain at least one-third of global biodiversity (Kammesheidt, 2002). They also maintain and support ecosystem services that are essential for human wellbeing (MEA, 2005). Unfortunately, over the years, human population growth and the need for agricultural expansion has led to increasing deforestation rates especially in the tropics (Dobson et al., 1997). The consequences of these agricultural expansions are not only reduced soil fertility but also include significant loss of biodiversity (Primack
and Corlett, 2005) and associated ecosystem services or properties. In Ghana and other West African countries, majority of the rural population depend on agriculture as a source of livelihood (Dobson et al., 1997). However, some farming practices such as slash and burn, shifting cultivation and monoculture methods have been found to be unsustainable and harmful to the environment (Quansah et al., 2001). The persistent adoption of these farming practices coupled with the rapidly growing population has resulted in high demands for extra land for agricultural production.
Traditionally, cocoa is grown under diversified native tree shade, increasingly viewed as a means of contributing to biodiversity conservation within agricultural landscapes (Rice and Greenberg, 2000; Schroth et al., 2004) and complementing conservation in protected areas. These traditional plantations are enriched by non-timber forest products (Duguma et al., 2001) and maintain many of the ecological characteristics of natural forests.
Today, the traditional polyculture cocoa production system is giving way to full sun cocoa production. Full sun cocoa production is the thinning or complete removal of shade trees from cocoa farms. According to Tondoh et al. (2015), full-sun cocoa farming is currently the most widespread cocoa cultivation system in humid and sub-humid regions of the world. In recent times, full-sun cocoa farming have resulted in a drastic loss of forest plant species that are replaced by pioneer and exotic species (Asase et al., 2009; Oke and Odebiyi, 2007; Zapfack et al., 2002; Dumont et al., 2014). The attraction of full-sun cocoa production is clearly the ability to increase yields and therefore increase the economic benefits of cocoa production in the short-term. Yet full-sun cocoa provides very little benefit in terms of biodiversity conservation and produce for a shorter amount of time than shaded cocoa farms (Schroth and Harvey, 2007).
In southern Cameroon, where much pristine forest remains, cocoa production has contributed immensely to deforestation at the forest agriculture interface because cocoa acreage is increasing due to the international market price recovery (ICCO, 2006). However, despite the fact that some studies have focus on the impact of cocoa farming on vegetation structure in Ghana (Asase et al., 2009), (
Zapfack et al., 2002) in Cameroon and (Tondoh et al., 2015) in Cote D’Ivoire, yet not much has been investigated on the conversion of forest to cocoa farmlands on different biodiversity groups and ecosystem services in South western Ghana. Particularly, data on potential tradeoffs between biodiversity loss and agricultural intensification including habitat conversion are lacking. This information is important in making strategic management plans toward conserving biodiversity and ensuring ecosystem services whiles increasing the profitability of cocoa farmers. We examined the consequences of the conversion of natural forest to cocoa farmlands on biodiversity and ecosystem services in southwestern Ghana. We hypothesized that all cocoa farms were derived from adjacent natural forests and that biodiversity and ecosystem properties are deteriorated as a result of cocoa farming. Specifically, the study was designed to address the following questions: (1) How does cocoa farming affect biodiversity and ecosystem properties? (2) Which biodiversity groups and ecosystem properties are mostly affected by cocoa farming intensification?.
Study area
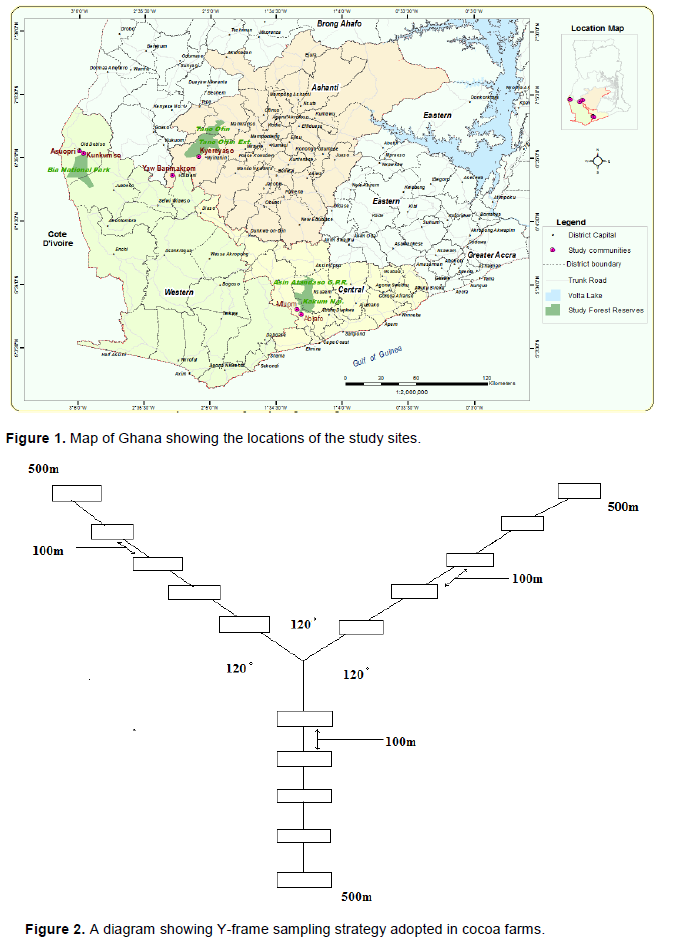
The present study was carried out in three cocoa producing districts in southwestern Ghana, namely; Twifo-Heman Lower Denkyira district, Bia district and Atwima-Mponua district (Figure 1). Mean monthly temperature in the study sites is between 24 and 30°C. There are two major rainfall seasons within the year. Annual rainfall for the major season is about 1200-1850 mm while rainfall for minor season is 1000-1250 mm per year. The natural vegetation in the study sites varies from wet semi equatorial to moist semi deciduous forest (Forestry Commission, 2010). However, natural vegetation in the study sites has been extensively cleared to form a strongly agricultural area populated largely by communities of smallholder cocoa farmers (Forestry Commission, 2010). The geology comprises of the sites consist of Lower Birrimian rock series- a pre-Cambrian formation that dominates Ghanaian forest zone (Forestry Commission, 2010).
Sampling procedure
Sampling of cocoa farms was carried out in two randomly selected communities in the three cocoa growing districts. To take into account soil and landscape variability in cocoa farms, we adopted a Y-frame sampling scheme (Henry et al., 2009). We randomly chose a geo-referenced point in each community to locate the centre of the Y-frame and with the aid of a Global Positioning System (Gramin eTrex 20) and a compass, the three arms of the Y-frame diverting at 120° were located (Figure 2). The length of each 3 arms of Y-frame was 500 m. We demarcated 5 plots each of size 25 m × 25 m at 100 m intervals along each of the three arms of the Y-frame. Thus 15 plots were demarcated in cocoa farms in each of the 6 communities giving a total of 90 plots.
In order to compare cocoa farms with the natural forest from which they were derived, we sampled adjacent forests reserves to the community. The selected adjacent forest reserves were Kakum National Park, Bia Conservation Area and Tano Offin Forest Reserve. Within each of the three selected forest reserves, we demarcated three parallel transects of length 500 m and separated at least 200 m from each other. We also demarcated 5 plots each of size 25 m × 25 m along each transect at 100 m intervals. Thus a total of 45 plots were demarcated in the natural forest- 15 plots in each forest reserve.
Biodiversity
We sampled trees following the protocol used in the recent study of Asase and Tetteh (2010). All trees with diameter- breast-height (DBH) ≥ 5 cm (1.3 m above ground level) within the 25 m × 25 m plots were enumerated. The trees with the specified DBH range were individually identified to species level and their DBH measured. We identified forest trees species encountered using the field guide of Hawthorne and Jongkind (2006). For soil biodiversity, we studied invertebrates and microfungi biodiversity. We randomly selected 20 plots in cocoa farms in each community and 10 plots in each forest reserve for the study of soil invertebrates. Thus a total of 90 plots were used; 60 in cocoa farms and 30 in natural forest. Two pitfall traps (diameter = 9 cm, height = 12 cm) were sunk 5 cm deep inside each 25 m × 25 m plot and traps were separated at least 5 m apart. Captures were preserved in 70% alcohol and subsequently counted and identified under a binocular microscope with assistance of experts at Department of Animal Biology and Conservation Sciences, University of Ghana. Species identification was confirmed (Blair et al., 1996). Sampling of soil microflora biodiversity involved collection of two core samples in each plot from the first 0-10 cm soil depth. The microflora in the core soil samples were studied using the modified Cook’s medium (Cooke, 1954) following the using the pour plate method (Alexopoulos and Beneke, 1962). Species of microflora were identified and counted with the aid of mycologists from the Department of Plant and Environmental Biology at the University of Ghana.
Litter mass production
We monitored the amount of litter mass production over a period of one year from May, 2012 to April, 2013 in cocoa farms and natural forest using litter trap (1.0 × 1.0 × 0.2 m raised 50 cm above the ground). We randomly selected 10 plots in one of the two studied communities per district and 10 plots in each forest reserve. In total, 60 L traps were studied; 30 in cocoa farms and 30 in natural forest. We randomly placed one litter trap per plot but making sure that the traps were not placed not directly under trees. Litter intercepted by the traps was emptied monthly and sorted out into shaded tree leaf litter, cocoa leaf litter, flowers and twigs, and subsequently oven-dried at 73.5°C until constant weight.
Soil physical and chemical properties
Soil samples were collected from the first 0 -15 cm depth from two randomly selected spots in each plot. The minimum distance of collection between the two spots within plots was 5 m. The soil samples collected from the same plot were bulked together, air-dried, ground and sieved through a 2 mm mesh size sieve before determination of physical and chemical properties. Soil bulk density was determined using the core method (Blake, 1965) as detailed in Asase et al. (2009). The Boyoucous hydrometer method using calgon as dispersant (Boyoucous, 1965) was used to determine soil texture. Soil pH was determined using the distilled water procedure (McLean, 1982). Total nitrogen was quantified using the Kjeldahl method (Bremner, 1965) and available phosphorus content determined following Bray 1 method (Bray and Kurtz, 1945 cited in Ofori-Frimpong et al., 2010) while exchangeable potassium was determined using flame emission photometry (FEP) as described in studies by Dorgbetor et al. (2012).
Estimation of tree biomass and carbon stocks
To estimate above ground tree biomass, four allometric equations were used. For native forest trees, biomass was estimated using the allometric model of Henry et al. (2010) which estimates tree biomass as Y= 0.30 × DBH 2.31,where Y is tree biomass and DBH is diameter at breast height. This model was specifically developed based on Ghanaian forest trees. Cocoa tree biomass was estimated using the model ρi - exp(-1.499 + 2.148 ln(DBH) + 0.207(ln(DBH))2 - 0.0281(ln(DBH))3 of Chave et al. (2005). Mean biomass of palm from a previous study (Thenkabail et al., 2004) was used as the biomass value of all individual palm species encountered as a result of the lower DBH to biomass ratio of palm compared with other tree species (Wade et al., 2010). Aboveground biomass of banana and plantain (Musa species.) was estimated using the following empirical model 0.03 × d2.13 (Arifin, 2001). The DBH values of trees measured during the enumeration of trees were used for the calculations. Roots biomass was estimated indirectly from the above-ground carbon biomass following the method of Cairns et al. (1997) which estimates root as 24% of above-ground tree biomass. Finally carbon stock of trees was calculated by multiplying tree biomass estimated by 0.5 (Glenday, 2006).
For calculation of soil organic carbon stock (SOC), percentage carbon content and bulk density of soil was determined for each plot. Collection of soil samples and initial preparation was as described above. The percentage carbon content of soil was determined using a modification of the wet-combustion method as detailed in Asase et al. (2009) and bulk density using the core method as described above. SOC was calculated as, SOC = % C x bulk density x soil depth (Kirby and Potvin, 2007). In order to account for differences in soil bulk densities between the natural forest and cocoa farms, the thickness of soil layer beneath the cocoa farms was adjusted as described in Tondoh et al. (2015).
Classification of cocoa farms
Cocoa farms were classified into intensive and traditional cocoa based on percentage shade cover. Shade intensity was measured with a hand held concave spherical densitometer. Following Wade et al. (2010), an arbitrary classification of < 25% shade cover was considered to be ‘intensive’ and ≥ 25% shade was considered ‘traditional’.
Species richness and similarity index
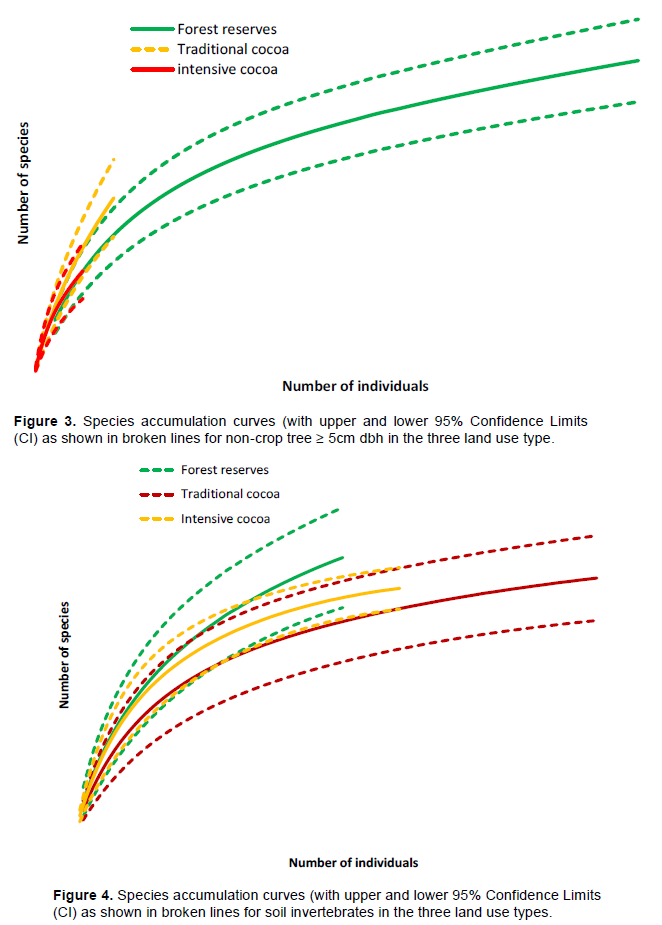
The rarefaction method (Gotelli and Colewell, 2001) was used to generate the expected number of species (trees, soil invertebrate and soil microfungi) in the traditional cocoa farm, intensive cocoa farm and the natural forest. The free software Estimates 8.0 (Gotelli, 2006) was used to generate data for the construction of sample based rarefaction curves and 95% confidence limits for species richness. Species diversity was evaluated using the Shannon –Wiener index (H1=∑Si = In pi), where s is the total number of species and p is the relative abundances of the I species. In contrast to direct measures of species richness, this index takes into account the relative abundances of species (Legendre and Legendre, 1998). Species compositional similarity between land use types was estimated using the Jaccard similarity index. The Jaccard similarity index uses species presence/absence data for two sample sets (in this case land-use types) and is calculated as J = M/(M + N) , where M is the number of species that occur in both land-uses and N is the number of species that occur in only one of the land-use types.
Statistical analysis
Statistical differences in means of stem density, carbon stocks, litter mass, soil physical and chemical properties were analyzed using analysis of variance (ANOVA). Normality test for homogeneity of variance was determined using Shapiro-Wilk test (Crawley, 2007). Where the test indicated significant difference, means were contrasted with post hoc Tukey HSD test. The R software version 3.1.1 was used.
Biodiversity
In total, 909 individual non-cocoa trees belonging to 100 species in 26 families were identified. Individual-based rarefaction curve showed that tree species richness was significantly higher in natural forest and least in intensive cocoa at 95% confidence limit (Figure 2). Mean Shannon–Weiner diversity index differed among the land use types (p < 0.001) with the largest diversity recorded in the natural forest (3.5±0.02) but comparable level of diversity between traditional cocoa farms (0.76± 0.008) and intensive cocoa farms (0.63±0.005). The β-diversity statistics showed that non-crop tree species community in the intensive and traditional cocoa farms are most similar (Jaccard index = 0.54) followed by that between the natural forest and traditional cocoa farms (Jaccard index = 0.32). The least non-crop tree species composition similarity was found between the natural forest and intensive cocoa farms (Jaccard index = 0.012). Density of non-cocoa trees decreased significantly (p < 0.001) from natural forest (22.9 ± 1.69 ha-1) through traditional cocoa (3.8 ± 1.69 ha-1) to intensive cocoa (2.4 ± 0.89 ha-1). Post hoc Tukey HSD test showed significant difference in mean density of native forest trees between the forest reserves and intensive cocoa farms (Tukey HSD, p < 0.0001) and between the forest reserves and traditional cocoa farms (Tukey HSD, p < 0.001). Basal area of forest trees was highest in the forest reserves (29.3 ± 6.9 m2ha-1) and lowest in the intensive cocoa farms (6.6 ± 5.3 m2ha-1) (Tables 1 and 2). Basal area of forest trees differed significantly in the different land use types (p < 0.001). There were however, significant differences in tree basal area between forest reserves and intensive cocoa farms (Tukey HSD, p < 0.001), and between forest reserves and traditional cocoa farms (Tukey HSD, p < 0.001). The basal area of trees between intensive cocoa farms and traditional cocoa farms was, however, not significant (Tukey HSD, p > 0.05).
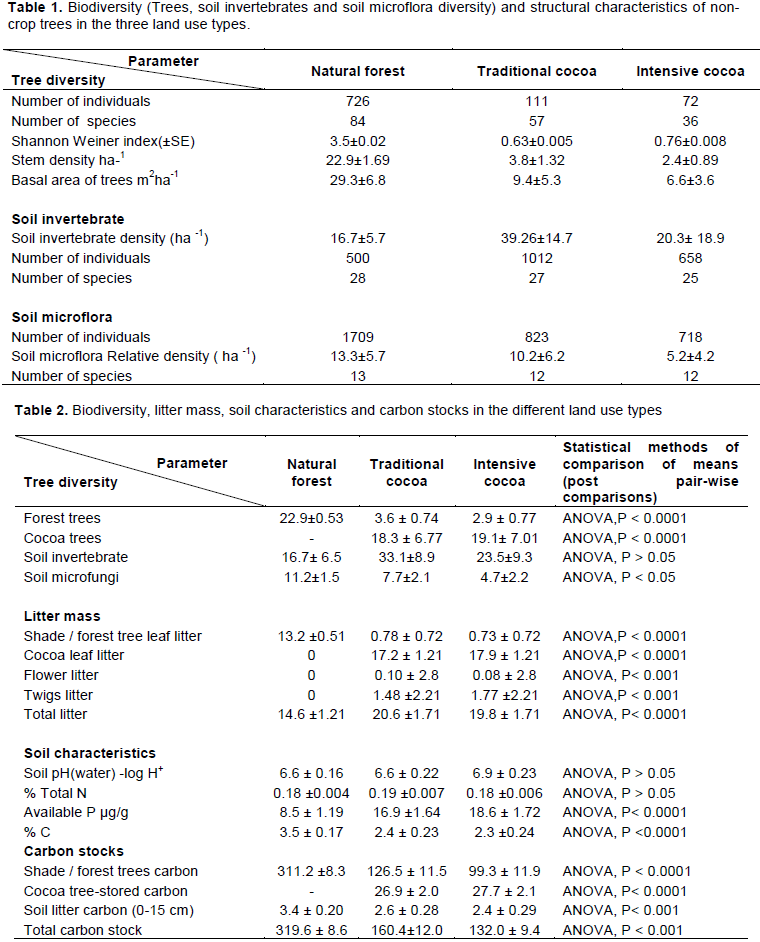
For soil invertebrates 2,168 individuals belonging to 39 species were identified. Of the species identified, the most common were Camponotus chrysursus Apellis Wheeler Camponotus sp, Canthon pilularis L., Oncopeltus fasciatus Bonhag, Palthothrus sp, Peridontopygne sp and Gryllus lucens Wlk. Sixteen of the species were identified in both dry season and wet season although about 75% of the species were detected in only dry season. Mean Shannon–Weiner diversity index varied among the land use types (p < 0.001) with the largest diversity recorded in traditional cocoa farms (2.21± 0.004) followed by (2.02±0.003) in the intensive cocoa farms. The least mean Shannon –Weiner index (1.74±0.02) was found in the natural forest reserves. The soil invertebrate species community in the traditional cocoa farms and intensive cocoa farms were most similar (Jaccard index =0.79), followed by that between traditional and natural forest reserves (Jaccard index= 0.68).The least similar in terms of tree species composition was the natural forest and intensive cocoa farms (Jaccard index = 0.65). Soil invertebrate species richness was significantly higher in the traditional cocoa farms compared to the intensive cocoa farms and natural forest at 95% confidence limits (Figure 3 and 4). The density of soil invertebrate varied significantly among the land use types (p < 0.001) and was highest in 39.2 ± 14.7 ha-1 traditional cocoa farms and lowest in 9.5 ± 5.2 ha-1 natural forest reserves.

A total of 3,250 individual colonies of soil microflora belonging to 13 species in 8 families were identified. The familes Trichocomaceae (6 species) and Loculoas-mycetes (2 species) contained the largest number of species. Twelve of species encountered, namely, Aspergillus flavus Link, Aspergillus niger Van Tieghem, Aspergillus fumigatus Stammberger, Aspergillus sulpherous, Aspergillus wentii Schuster, Candida albican Hoyer, Cladosporium herbarum Pers, Mycelia sterilia, Neurospora sitophilia Shear, Penicillium oxalicum Currie and Thom, Rhizopus stolonifer (Ehrenb)Vuill and Trichoderma viride Bonn were found in all the three land use types. Mean Shannon–Weiner diversity index differ among the land use types with largest diversity found in the natural forest reserves (2.63±0.008) while the least was recorded in the intensive cocoa farms (2.15±0.007). Soil microflora community in the intensive and traditional cocoa farms were most similar (Jaccard index = 0.95) followed by that between traditional cocoa farms and natural forest reserves (Jaccard index = 0.92) whiles the least was found between the intensive cocoa farms and natural forest reserves (Jaccard= 0.85). Relative density of soil microflora was highest (9.3± 3.3 m2 ha-1) in forest reserves and lowest (1.8 ± 0.4 m2 ha-1) in intensive cocoa farms and did not differ significantly among the land use types (p > 0.05).
Litter mass production
Total annual litter mass was highest (14.6± 1.21 kg/ha) in natural forest and lowest (19.8 kg/ha) in intensive cocoa. Total litter mass varied significantly across the different land use types (p > 0.05). Significant difference in litter mass was detected between natural forest and intensive cocoa (Tukey HSD, p < 0.01), and between natural forest and traditional cocoa (Tukey HSD, p < 0.01) but no significant difference was detected between intensive and traditional cocoa farmlands (Tukey HSD, p = 0.87). Shade tree litter mass was highest (13.2±2.3 kg/ha) in the natural forest and lowest (0.99± 0.9 kg/ha) in intensive cocoa farms but varied significantly (p < 0.001) in the three land-use types. Conversely, cocoa leaf litter was highest (29.1 ± 6.5 kg/ ha) in intensive cocoa farms and lowest (26.2 ± 3.2 kg/ ha) in traditional cocoa farms. The quantity of cocoa leaf litter mass produced showed significant difference (p < 0.001) among the different land use types.
Soil physical and chemical characteristics
Soil pH levels were highest in intensive cocoa farms (6.9±0.23) and lowest in the natural forest reserves (6.6±0.16). Total N content were highest (0.19 ± 0.01) in intensive cocoa farms and lowest (0.18±0.00) in the forest reserves. Soil organic carbon was highest (3.5 ± 0.17) in forest reserves and lowest (2.3 ± 0.24) in intensive cocoa farms but varied significantly (p < 0.001) across the different land use types. Available P content was highest (20.0 ± 3.8 µg/g) in intensive cocoa farms and lowest (8.5 ± 2.8 µg/g) in forest reserves. Available P content was however, significant among the different land use types (p < 0.001). Mean exchangeable K content found in the traditional cocoa farms was about twice that found in intensive cocoa farms.
Carbon stocks
Total carbon stocks was highest (319.6 ±8.6 Mg / ha) in the natural forest and lowest (132.0 ± 12.4 Mg / ha) in the intensive cocoa farms but varied significantly among the land use types (ANOVA, p < 0.001). Post hoc TukeyHSD test showed significant difference in the mean total carbon stock of trees between intensive cocoa farms and forest reserves (Tukey HSD, p < 0.001) and between traditional cocoa farms and forest reserves (Tukey HSD, p < 0.001). Forest trees carbon stock was highest (311.2 ± 8.3 Mg/ha) in forest reserves and lowest (99.3 ± 11.9 Mg/ha) in intensive cocoa farms and varied significantly among the different land use types (ANOVA, p < 0.001). Cocoa trees carbon stock was highest (27.7 ± 2.8 Mg/ha) in intensive cocoa farms and lowest (26.9 ± 2.7 Mg/ha) in traditional cocoa farms. Cocoa trees carbon stock showed significant difference among the land use types (ANOVA, p < 0.001). Mean palm tree carbon stock found in the forest reserves was about twice that found in the intensive cocoa farms. Plantain and banana tree crop carbon decrease significantly (ANOVA, p > 0.05) in the traditional cocoa (1.8 ±3.9 Mg/ha) and intensive cocoa farms (0.86± 4.0 Mg/ha).
Mean soil organic carbon stock per plot varied significantly among the different land use types (ANOVA, p< 0.001). Natural forest contained the largest average carbon stock per unit area with a mean value of (3.4 ± 0.4 Mg/ha) and lowest (2.5 ± 0.2 Mg /ha) in intensive cocoa farms. Post hoc TukeyHSD test showed that soil organic carbon between forest reserves and intensive cocoa farms was significant (TukeyHSD, p < 0.01) and between forest reserves and traditional cocoa farms (TukeyHSD, p < 0.01). However, between intensive and traditional cocoa farms, there was no significant difference observed (TukeyHSD, p= 0.97).
Biodiversity
The results of the study showed that the conversion of natural forest to cocoa farmlands and subsequent intensification has impacted negatively on forest tree species diversity. Similar trends have been observed in other studies in Ghana (Asase and Tetteh, 2010; Asase et al., 2009) and elsewhere (Tondoh et al., 2015; Bobo et al., 2006; Zapfack et al., 2002 and Sonwa et al., 2007). The Shannon Wienner index found in this study was not similar to what was reported by Tetteh (2009) in cocoa dominated and mixed food crop agroforest in Ghana. The loss of tree species within the cocoa farmlands may affect the conservation of other biodiversity such as birds, insects and rodents to a greater extent. This may also lead to the migration of certain important fauna species to other ecosystems for safety and thus a decrease in general biodiversity within the cocoa farmlands. Average density of non-cocoa trees in intensive cocoa farmland was low compared to the traditional cocoa farm. This observation is in line with previous study conducted by Wade et al. (2010) who reported higher density of non-cocoa tree species in traditional cocoa farms than in intensive cocoa farms. Basal area of forest tree species clearly decreases from the traditional cocoa farms to the intensive cocoa farms. The basal area of tree species recorded in this study was lower than what was found in Southern Cameroon (Zapfack et al., 2002). This is evident of how cocoa management intensity has contributed to the drastic loss of forest tree species over time.
The results of the study showed variations in soil invertebrate species diversity in the different study areas. The diversity of soil invertebrate generally increased with habitat complexity, the lowest being in natural forest and the highest in traditional cocoa farms. Similarly, studies of Hill et al. (1995) demonstrated a reduction in diversity following more extreme forms of forest disturbance. The lower diversity in the intensively managed cocoa farms could be due to lack of habitat heterogeneity and food resources compared to the traditional cocoa farms. The higher diversity of species observed in the traditional cocoa farms reinforce the idea that cocoa agroforestry systems may be considered as a conservative land use system (Moco et al., 2009; Rahman et al., 2011). The presence of these soil invertebrates in the cocoa farms probably might be due to certain factors favourable to the insect species through microhabitat conditions. Decaying matter-wood, banana stems, cocoa leaf litter, and cocoa pod husks (at the pod-breaking points) on the farms might have provided a variety of microhabitats which accommodated the different insect species.
Soil microflora species diversity declined drastically in the intensive cocoa farms than in the forest reserves. This observation is in line with previous report by Tetteh (2009) who found higher diversity of soil microflora in natural forest than in cocoa and mixed food crop agroforest. This implies that soil microflora diversity is a requirement for the decomposition of litter essential for the release of organic compounds necessary for plant growth.
Litter mass and characteristics
Total litter mass decreased significantly in the cocoa farmlands than in the forest reserves. This observation is in line with studies conducted by Ofori-Frimpong et al. (2010) and Owusu-Sekyere et al. (2006). In the cocoa farmlands, shaded litter was very low due to the destruction of the shaded trees by farmers and cocoa merchants purposely for timber. The conversion of shaded cocoa farmlands to cocoa monoculture mostly affects species diversity and the nutrient cycling process. Cocoa litter production contributed to the highest proportion of total litter mass in the cocoa farmlands.
Soil characteristics
Generally, the soils were slightly acidic to neutral in nature supporting the cultivation of crops such as cocoa (Theobroma cacao), plantain (Musa paradisca), banana (Musa sapientum) and palm oil (Elaies guinenesis). Soil organic carbon showed a decreasing pattern in the cocoa farmlands compared to the forest reserves. This assertion is similar to recent study conducted by Ofori-Frimpong et al. (2010) who observed high organic carbon content in forest reserves than in cocoa farmlands. In the cocoa farmlands total nitrogen and available phosphorus contents were high due to the continuous application of chemical fertilizers to the cocoa trees as recommended by the Cocoa Research Institute of Ghana. The low levels of total nitrogen and available phosphorus contents found in the forest reserves could be attributed to leaching of nutrients from the forest floor.
From the study it can be concluded that tree species diversity in the cocoa farmlands decreased with increasing management intensity affecting, stem density, basal area, litter fall production and subsequent reduction in above and below carbon stocks. Soil microfungi species diversity also decreased in the cocoa farmlands compared to the natural forest. However, soil invertebrate species diversity was high in the traditional cocoa farms than in the forest reserves. To ensure a sound ecosystem, biodiversity conservation and higher productivity, shaded cocoa agroforest system should be encouraged in order to ensure sustainable management of cocoa farms to check global climate change.
The authors have not declared any conflict of interests.
The authors gratefully appreciate the financial support of Carnegie Cooperation for partially sponsoring the lead author PhD thesis. We are also thankful to the people of Abrafo, Mfuom, Yawbarimakrom, Kyereyaso, Kunkumso and Asuopri for their hospitality during the study.
REFERENCES
|
Alexopoulos CJ, Beneke ES (1962). Laboratory manual for introductory mycology.Burgess publishing Co, Minneapolis.
|
|
|
|
Arifin J (2001). Estimasi cadangan C pada berbagai sistem penggunaan lahan di Kecamatan Ngantang, Malang.Skripsi-S1. Unibraw, Malang.
|
|
|
|
|
Asase A, Ofori-Frimpong K, Ekpe KP (2009). Impact of cocoa farming on vegetation in an agricultural landscape in Ghana. Journal of African Ecology 48:338-346.
Crossref
|
|
|
|
|
Asase A, Tetteh DA (2010). The role of complex agroforestry systems in the conservation of forest tree diversity and structure in southeastern Ghana. Agroforestry Systems 79:355-368.
Crossref
|
|
|
|
|
Bray RH, Kurtz LT (1945).Determination of total organic and available forms of phosphorus in soils. Soil Science 59:39-45.
Crossref
|
|
|
|
|
Blair JM, Bohlen PJ, Freckman DW (1996). Soil invertebrates as indicators of soil quality. Soil Science Society of America 5:273-291.
|
|
|
|
|
Bremner JM (1965). Total nitrogen. In: Methods of Soil Analysis part 2. Chemical and microbiological properties.Agronomy monograph pp. 1149-1178.
|
|
|
|
|
Bobo K Waltert NM, Njokagbo N, Fermon H, Mu¨ Hlenberg M (2006) .From forest to farmland: Species richness patterns of trees and understorey plants along a gradient of forest conversion in southwestern Cameroon. Biodiversity and Conservation 15(13):4097-4117.
Crossref
|
|
|
|
|
Cairns MA, Brown S, Helmer, EH, Baumgardener, GA (1997). Root biomass allocation in the world's upland forests. Oecologia 111:1-11.
Crossref
|
|
|
|
|
Chave J, Andalo C, Brown S, Cairns MA, Chambers JQ, Eamus D, Folster H, Fromard F, Higuchi N, Kira T, Lescure JP, Nelson BW, Ogawa H, Puig H, Riera B, Yamakura T (2005). Tree allometry and improved estimation of carbon stocks and balance in tropical forests. Oecologia 145:87-99.
Crossref
|
|
|
|
|
Crawley MJ (2007). The R book.Wiley, New York 942 p.
Crossref
|
|
|
|
|
Dobson AP, Bradshaw AD, Baker AJM (1997). Hopes for the future: restoration ecology and conservation biology. Science 277:515-522.
Crossref
|
|
|
|
|
Dorgbetor WHK, Dowuna GNN, Danso SKA, Amatekpor JK, Ogunkunle AO, Boateng E (2012). Evaluation of quality of some Rehabilitated Mined soils within the AngloGold- Ashanti concession in Ghana. International Journal of Geosciences 3:50-61.
Crossref
|
|
|
|
|
Forestry commission (2010). Bia Conservational Area Management Plan, Wildlife Division, Forestry Commission. Republic of Ghana.
|
|
|
|
|
Glenday J (2006). Carbon storage and emissions offset potential in an East African tropical rainforest. Forest Ecology and Management 235:72-83.
Crossref
|
|
|
|
|
Gotelli NJ (2006). Estimates statistical estimation of species richness and shared species from samples. http://viceroy.eeb.uconn.edu/EstimateS Page/EstimateS.flx.
|
|
|
|
|
Gotelli NJ, Colwell RK (2001). Quantifying biodiversity: procedures and pitfalls in the measurement and comparison of species richness. Ecology Letters 4:379-391.
Crossref
|
|
|
|
|
Hawthorne WD, Jongkind C (2006).Woody Plants of Western African Forests.A Guide to the Forest Trees, Shrubs and Lianes from Senegal to Ghana.KewPublishing, Royal Botanic Gardens, Kew, UK.
|
|
|
|
|
Henry M, Besnard A, Asante WA, Eshun J, Adu-Bredu S, Valentini R, Bernoux M, Saint-Andre L (2010). Wood density, phytomass variations within and among trees, and allometric equations in a tropical rainforest of Africa. Forest Ecology and Management 2060:1375-1388.
Crossref
|
|
|
|
|
Henry M, Tittonell P, Manlay RJ, Bernoux M, Albrecht A, Vanlauwe B (2009).Biodiversity, carbon stocks and sequestration potential in aboveground biomass in smallholder farming systems of western Kenya. Agriculture, Ecosystem and Environment 129:238-252.
Crossref
|
|
|
|
|
Hill JK, Harmer KC, Lace LA, Banham WMT (1995). Effect of selective logging on tropical forest butterflies onBuru, Indonesia. Journal of Applied Ecology 32:754-760.
Crossref
|
|
|
|
|
International Cocoa Organization (ICCO) (2006). Fine and flavour cocoa.
|
|
|
|
|
Kammesheidt L (2002). Perspectives on secondary forest management in tropical humid lowland America. Ambio 31:243-250.
Crossref
|
|
|
|
|
Kirby KR, Potvin C (2007). Variation in carbon storage among tree species: implications for the management of a small-scale carbon sink project. Forest, Ecology and Management 246:208-221.
Crossref
|
|
|
|
|
Lavelle P (1996). Diversity of soil fauna and ecosystem function. Biological International 33:3-16.
|
|
|
|
|
McLean EO (1982). Soil pH and lime requirement. In page, A.L, R., Miller and D. R. Keeney (ed.) 1982.Methods of soil analysis. Part 2 (2nd edition). Chemical and microbiological properties-Agronomy monograph number.
|
|
|
|
|
Millenium Ecosystem Assesment (MEA) (2005). Ecosystems and human well-being: SynthesisIsland Press, Washington, DC. 155.
|
|
|
|
|
Moco MKS, Gama-Rodrigues EF, Gama-Rodrigues AC, Machado CR, Baligar VC (2009).Soil and litter fauna of cacao agroforestry systems in Bahia, Brazil.Agroforestry Systems 76:127-138.
Crossref
|
|
|
|
|
Norris K, Asase A, Collen B, Gockowski J, Mason J, Phalan B, Wade A (2010).Biodiversity in a forest-agriculture mosaic- Thechanging face of West African rainforests. Biology and Conservation 143:2341-2350.
Crossref
|
|
|
|
|
Ofori-Frimpong K, Afrifa AA, Acquaye A (2010). Impact of shade and cocoa plant densities on soil organic carbon sequestration rates in a cocoa growing soil of Ghana. African Journal of Environmental Science and Technology 4:621-624.
|
|
|
|
|
Owusu-Sekyere E, Cobbina J, Wakatsuki T (2006). Decomposition, nutrient release patterns and fluxes from leaf litter of secondary forests in Ghana. West African Journal of Applied Ecology 9:1-10.
|
|
|
|
|
Primack R,Corlett R (2005). Tropical rainforest- an ecological and biogeographical comparison, 319. Oxford, UK: Blackwell Science.
|
|
|
|
|
Quansah C, Drechsel P, Yirenkyi BB, Asante-Mensah S (2001). Farmers' perception and management of soil organic matter -a case study from West Africa. Nutrient Cycling in Agroforestry Systems 61:205-213.
Crossref
|
|
|
|
|
Rahman PA, Varma RV, & Silesh GW (2011).Abundance and diversity of soil invertebrates in annual crops, agroforestry and forest ecosystems in the Nilgiri biosphere reserve of Western Ghats, India. Agroforestry Systems 4:11-18.
|
|
|
|
|
Rice RA, Greenberg R (2000).Cacao cultivation and the conservation of biological diversity. Royal Swedish Academy of Sciences pp. 167173.
|
|
|
|
|
Schroth G, Fonseca da GAB, Harvey CA, Gascon C, Vasconcelos HL, Izac AMN (2004) Agroforestry and Biodiversity Conservation in Tropical Landscapes. Island Press, Washington.
|
|
|
|
|
Schroth G, Harvey C (2007). Biodiversity conservation in cocoa production landscapes: an overview. Biodiversity Conservation 16:2237-2244.
Crossref
|
|
|
|
|
Tetteh DA (2009). Agroforestry, ecosystem, biodiversity conservation: A case study in the Eastern Region of Ghana. Unpublished Mphil Thesis Dissertation.
|
|
|
|
|
Thenkabail PS, Stucky N, Griscom BW, Ashton MS, Diel J, Van der Meer B, Enclona E (2004). Biomass estimations and carbon stocks calculations in the oil palm plantations of African derived savannah using IKONOS data. International Journal of Remote Sensing 25:5447-5472.
Crossref
|
|
|
|
|
Tondoh JE, Kouame FN, Guei AMG, Sey B, Kone AW, Guessougou N (2015). Ecological changes induced by full-sun cocoa farming in Cote d'Ivoire. Global Ecology and Conservation 95:1-21.
Crossref
|
|
|
|
|
Wade ASI, Asase A, Mason J, Ofori-Frimpong K, Preece D, Spring N, Norris K (2010). Management strategies for maximizing carbon storage and tree species diversity in cocoa growing landscapes. Agriculture, Ecosystems and Environment 138:324-334.
Crossref
|
|
|
|
|
Zapfack L, Engwald S, Sonke B, Achoundong G, Birang M (2002).The impact of land conversion on plant biodiversity in the forest zone of Cameroon. Biodiversity and Conservation11:2047-2061.
Crossref
|
|