ABSTRACT
This study derived eco-climatic indices; a moisture quality index, onset and cessation dates, hydrologic growing season and Aridity Index all for the period (1950-2006), in addition to using National Oceanographic and Atmospheric Administration an Advanced Very High Resolution Radiometer images to derive a Soil Adjusted Vegetation Index map. These derived eco-climatic parameters were integrated using Geographic Information System (GIS) techniques. The overlay was hinged on a theoretical basis which holds that the variations of the Aridity index, cessation dates, length of the hydrologic growing season and vegetation index are directly proportional to eco-climatic zone changes while those for onset and MQI are inversely proportional. The quantitatively derived eco-climatic index and related maps identified five eco-climatic zones; wet, humid, sub-humid, dry sub-humid and semi-arid as against the three classic regional climatic zones. The eco-climatic map further unveils progressive transformation or southwards shifts in the boundaries of the regional climatic zones. Thus, the accurate delineation of the current eco-climatic zones would be essential for providing adequate information needed to achieve food security and sustainability of the physical environment that is fundamental to disaster risk reduction in sub-Saharan Africa.
Key words: Northern Nigeria, climate change, rainfall variability, southwards shifts, eco-climatic zones, food security.
The potential impact of climate change, rainfall variability patterns and the dynamic hydrologic regimes have continue to escalate land degradation and make it imperative that the broad eco-climatic zones could have changed. Brian and Ed (1992) revealed that not only there are major shift in the ecological boundaries but also the character of the broadly distributed ecosystem and Abdulkadir et al (2013a) confirmed rapid advancement of desert condition in the region. Similarly, Claire et al. (2008) concluded that climate change is inducing range shifts for many species as they follow their suitable climate space and further shifts are projected. Land degradation and it impacts on relevant socio-economic activities are typical phenomenon across northern Nigeria. The risks associated with these changes are real but highly uncertain (Ann et al., 2013). Specifically, the wide spread crop failure, hunger, famine and poverty, typical of region in recent times have necessitated identification of proactive measures for Disaster Risk Reduction (DRR) and disaster preparedness. Climatic and ecological changes threaten human health globally (Colin and David, 2010). Moreover, the existing climatic and eco-climatic parameter maps have been mapped on the basis of vegetation and annual rainfall totals using traditional vector maps overlay. It has been evident for a while that these parameters alone cannot explain conditions pertinent to environmental sustainability in dry and dry sub-humid environments (Muhammad et al., 2005).
These existing climatic and eco-climatic parameter maps have been mapped long ago. There is large consensus that in West Africa one of the major climate change impacts will be on rainfall, making it more variable and less reliable (BenoˆÄ±t, 2012). With time since they were first mapped over 40 years ago, changes have been occurring as a result of various land degradation processes resulting to likely shifts in boundaries and conditions of the mapped zones. Several studies have suggested that land-cover changes alter the weather (Mechi, 1994; Foodym 2001; Bounoua et al., 2002; and Zhang et al., 2006). Also, Julius (2015), asserts that changes in land use, particularly when joined with climate change and variability, could impact on ecosystems and natural resources in complex ways. Generally, there is the politics of the actual land area that is desertified; is it the Sudan/Sahel/Sudano-sahelian or the sub-humid zone? Understanding local disturbance regimes is fundamental to understanding changes in ecosystem properties and stability (Halpin, 1997). Similarly, Fraser et al. (2011) makes an empirical contribution to our understanding of how social-ecological systems are vulnerable to climate change. Also, the recurring crop failures experienced in this zone may be a response to inadequate information inherent in the use of the classic eco-climatic zones. With the power of Geographic Information System (GIS) technology and the need to track such changes, studies are now required that employ GIS tools in mapping eco-climatic zones in northern Nigeria.
Generally, drought occurrence, erratic rainfall distribution and shift in economic fortunes, all combine to impact on the environment. The most significant climatic change that has occurred has been a long-term reduction in rainfall in the semi-arid regions of West Africa (Nicholson, 2001). Apparently, aridity has been drastically altering the traditional eco-climatic zones resulting to recurring crop failure. Conversely, lack of information on the existing eco-climatic zone and changes that have taken place is an apparent problem. No researches have been carried out to investigate and map changes in the spatial extent of the traditional eco-climatic zones to establish new zones. Indeed, most research up till now has focused on analogues between present and future climates (Martin, 2014). These are gaps in the achievement of food security and sustainability of the physical environment that the study intends to fill. Quantitative representativeness can characterize borders between eco-regions (Williams and Forrest, 2005). Delineation of current eco – climatic zones using modern geospatial techniques will provide accurate information on the state of the environment and could enhance agricultural productivity, quality of life and boost food security. As a country whose economy is heavily dependent on low-productivity rainfed agriculture, rainfall trends are often cited as one of the more important factors in explaining various socio-economic problems such as food insecurity (Wing et al., 2008).
Despite these apparent changes across the region and country in general, North/South climatic description and other broad regional climatic designation still dominate decision making. The two sub-climatic zones in Northern Nigeria are tropical continental north, tropical hinterland and the third zone is in response to relief; high plateaux. In addition, the eco-climatic parameter maps (onset, amount, cessation etc) produced independently is used in place of eco-climatic map. Hydrological, landscape and eco-regions were equally effective at defining regions interns of climate, landcover and water quality (David et al., 2004). Consequently, the integration of derived ecological and climatic parameters using Geographic Information System (GIS) to derive the eco-climatic map that will depict the eco-climatic condition in quantitative terms is crucial for sustainability of natural resources.
Study area
Northern Nigeria is located between Longitudes 3° to 15° East of the Greenwich meridian and Latitudes 9° and 14° north of the Equator, this region stretches from the Sokoto plains through the northern section of Hausa land to the Chad Basin. The extreme Northern part of the region share boundaries with the semi-arid and arid zone of the Niger Republic. The States located in this zone are Sokoto, Kebbi, Zamfara, Kastina, Kano, Jigawa, Yobe, Borno, Gombe, Bauchi, Adamawa, Kwara, Plateau, Taraba, Niger, Abuja (FCT), Nassarawa, Kogi and Benue States. The northern region, due to its latitudinal location is characterized by tropical continental dry climate. Rainfall amount is low, erratic and characterized by spatial and temporal variability. Agriculture is the most dominant economic activity consequently; the region has suffered great degradation from the hands of man and his livestock. The region is characterised by high temperature records and range, and dominated by savannah vegetation; Guinea to the south, Sudan and Sahel savanna to the north.
The derived eco-climatic (Onset, Cessation, Hydrological Growing Season, Aridity Index and Moisture Quality Index) parameter records (1950-2006) for the twelve selected meteorological stations in northern Nigeria were used (Abdulkadir et al., 2013b). The spatial spread of the globally referenced selected meteorological stations; Minna, Zaria, Yola, Maiduguri, Bauchi, Sokoto, Yelwa, Kano, Jos, Gausau, Nguru, and Katsina is taken as a sufficient basis for spatial interpolation of the non-observed locations in the zone. All the derived data are location specific except for vegetation. The location coordinates of the 12 data points were therefore used to extract Soil Adjusted Vegetation Index (SAVI) value. The derived eco-climatic parameters were defined numerically; 5, 4, 3, 2 and 1 indicating varying level of moisture effectiveness and the point data was transformed to spatial data X, Y, Z (longitude, latitude and factor) using krigging geo-statistical defaults in SURFER 8 to produce an accurate grid of the base map.
National Oceanographic Atmospheric Administration (NOAA) Advanced Very High Resolution Radiometer (AVHRR) satellite images of 1.1km spatial resolution over northern Nigeria was acquired from the National Remote Sensing Centre Jos, Nigeria. The atmospheric corrections were made to remove the effect of aerosols and obtain more accurate data from the satellite image since these particles; smoke, dust, and water vapour, strongly affect all spectral vegetation indices. They affect the contrast between the infrared (IR) and near infrared (NIR) values and lead to lower index values, whether they are based on the difference between the two ranges of NIR-Red or the ratio between the two (Dewidar and Al Rehili, 2013). Thereby optimizing visual interpretation and preparing the Images for SAVI transformation, ground control points were extracted from geo-referenced drainage map of Nigeria (rivers / streams intersection and shoreline features) and corresponding positions on the image were used to resample the image. The band 2 and 3 (0.72 - 1.1 µm and 3.55 – 3.93 µm) were transformed to vegetation data using Soil Adjusted Vegetation Index (SAVI) to quantify vegetation biomass in the region, where soil background is a significant component of the signal detected. SAVI has shown to be very sensitive to discriminate vegetation amount in sparsely vegetated areas (Chuvieco et al., 2002). Similarly Malingreau et al. (1989) selected AVHRR channel three to be preferable to channels four and five. The derived rainfall characteristics; onset (Ø), cessation (C), hydrological growing season (HGS), Aridity Index (AI), Moisture Quality index (MQI) and derived vegetation index (VI) were used to derive the eco-climatic indices for integration and delineation of the eco-climatic zones.
A Geospatial database was developed for the analysis and integration of the derived eco-climatic indices. These parameters were resampled using the spatial resolution of the image and imported into GIS environment (ArcGIS 9.3). These were input into an overlay module which superimposes the whole factor in a GIS environment for further analysis using equation below. Efficient and cost-effective methods are needed for delineating sub-field productivity zones to improve soil and crop site-specific management (Kitchen et al., 2005). The overlay was hinged on a theoretical basis which holds the values of the aridity index; cessation, hydrologic growing season and vegetation index are directly proportional to eco-climatic zones while those for onset and MQI are inversely proportional to the quantitative character of the eco-climatic zones. This is expressed as:
ECZ= AI *VI * HGS * C / Ø * MOI (1)
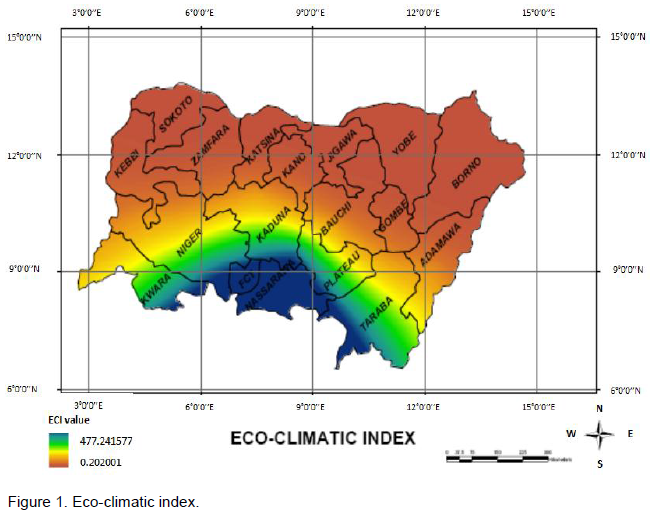
By implication the highest value will be 625 for the best Eco-climatic Zone (ECZ) class and the least value was 0.04 for the lowest class. However, in reality the highest class for this analysis is 477.242 while the least is 0.202. As a result, the eco-climatic zones were ranked and interpreted as Wet Humid, Humid, Sub- humid, Dry Sub-humid and Semi-Arid/Arid (Wet Humid, for the best class and Semi-Arid/Arid for the worst) Table 1. These were used to delineate the final map showing the Eco-climatic zones.
The derived eco-climate zones features were extracted using contour lines to demarcate eco-climatic zones limit, and this was overlaid on Iloeje (1976)’s scanned and digitized climatic region map to visualize the differences and similarities that exist between the two.
The integration of the entire factors using the empirical relationship reflects the moisture feature typical of northern Nigeria. Eco-climatic index values decreased gradually from the south northwards as Maselli (et al., 1996) concludes that the substantial agreement between these sources testifies to the eco-climatic value of the product obtained. Signifying the accuracy of the index, the Eco-climatic Index (ECI) value ranged from 0.202 depicting extreme moisture stress conditions in the extreme north to 477.242 indicting the best eco-climatic condition in the southern belt of the region (Figure 1).
The derived eco-climatic index was reclassified quantitatively using Table 1; consequently five eco-climatic classes were identified (Figure 2); semi-arid/ arid, dry sub-humid, sub-humid, humid and wet eco-climatic zones. Climatic regions provide useful information for ecologist, natural resource managers and economic planners (Brian and Ed, 1992; Maselli et al., 1996; Yan et al., 2013). Arid/Semi-Arid eco-climatic zone is most wide spread in the northern Nigeria; this stretches from northwest about (Lat. 10°20’N) through the central portion (Lat. 11°12’N) to about Lat. 9°27’N along the northeast as portray on Figure 1. This eco-climatic condition covers the entire Sokoto, Zamfara, Katsina, Kano, Jigawa, Gombe, Yobe, Borno, and northern parts of Bauchi and Adamawa States. Moisture stress is homogeneous in this zone as evident in the eco-climatic index as it has the least eco-climatic index value (ECZ< 50), since all the eco-climatic factors have the poorest moisture condition in this zone. Southwards, eco-climatic zones are heterogeneous reflecting different levels of moisture effectiveness.
Dry Sub-humid climate extends from southern border of semi-arid/arid zone to Long.4° E10’ Lat. 8°N 40’ through Long.8° E9’, Lat.10°N16’ to Long.11° E 46’ Lat.7°N 8’. It spread across northern Niger, Kaduna, Plateau and Taraba States, in addition to southern parts of Bauchi, and Adamawa States. This zone is characterized by low eco- climatic index (50 ≤ ECZ ≤ 150) and are classified as dry sub-humid climate.
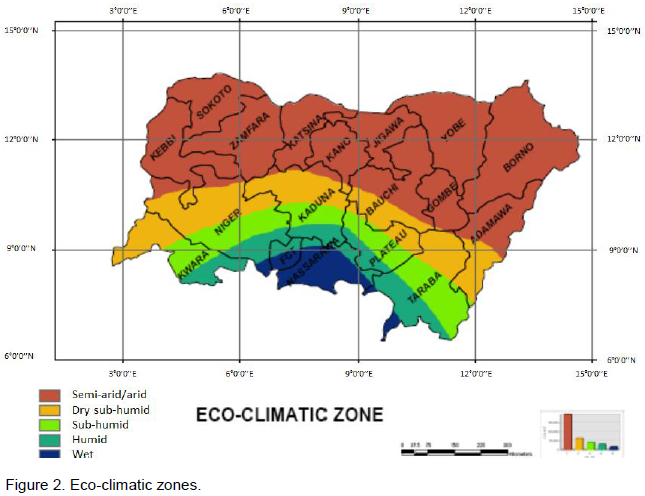
Three varying strips of humid zones are identified; Sub-humid consists of a narrow zone stretching from the southern margin of Sudan climate to Lon.4°E 53’ lat.8°N 71 through Lon.8°E 30’ lat. 9°N 32’ to Lon.10° E 35’ lat.7° N 12’. This is found across the central portion of Kwara, Niger, Kaduna, Plateau and Taraba States with eco-climatic values 150 ≤ ECZ ≤ 250. Humid (250 ≤ ECZ ≤ 350) spreads from the southern boundary of the Sub-humid zone to Lon.6°E 31’ Lat.8°N26’ and Lon. 9°E 7’ Lat.7° N 53’ covering southern parts of Kwara, Niger, Kaduna, Plateau and Taraba States as well as, northern parts of FCT and Nassarawa State. However, despite the fact large proportion of the region is dry, sub humid and humid there is small area that is wetter than humid condition that is been classified as the Wet eco-climatic zone which is found mainly in parts of FCT, Nassarawa and the extreme fringe of Niger and Taraba south. The highest eco-climatic index (350 ≤ ECZ ≤448) is recorded in this zone and is classified as Wet eco-climatic zone as apparent in Figure 2.
Comparison of eco-climatic zones and climatic regions
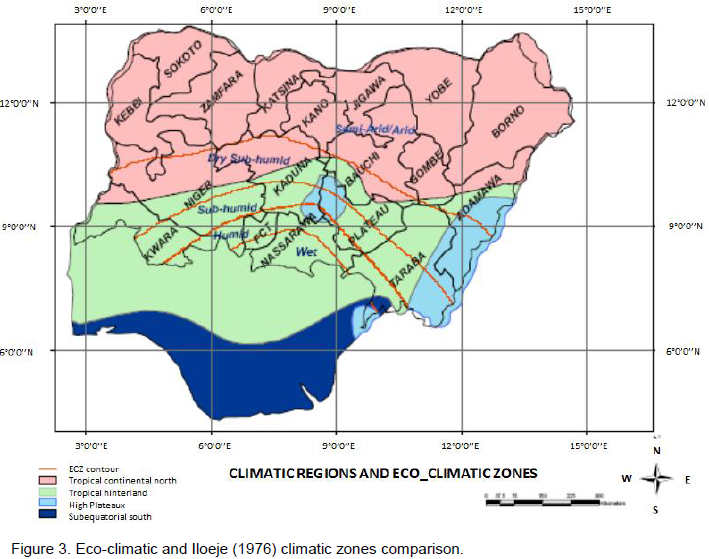
Iloeje (1976) identified four climatic regions in Nigeria; subequatorial south, tropical hinterland, tropical continental north and high Plateaux climate (Figure 3). This climatic classification was based on precipitation, temperature and relative humidity annual means values and totals. In contrast the current eco-climatic zone map is based on the integration of derived precipitation and vegetation data using Geospatial technique and empirical relationships to distinguish eco-climatic sub-units. As against Iloeje’s classification that was based on broad regional levels and traditional vector map overlay, which does not identify micro variations in the ecological and climatic zones for planning purposes across the region. This study identified five eco-climatic zones; semi-arid /arid, dry sub-humid, sub-humid, humid and wet eco-climatic zones with underlying implication of drastic transformation of the regional climatic zone. The comparison established that the tropical continental north has been transformed to semi-arid /arid and dry sub-humid. The classical tropical hinterland revealed actual characterization of varying humidity levels; dry sub-humid, sub-humid, humid and wet eco-climatic zones as evident from the on Figure 3. Consequently, comparison of the regional climatic and eco-climatic maps revealed significant transformation of the regional climatic zones.
Similarly, Centre for Climate change and Fresh water Resources Eco-climatic Atlas only plotted States and regional eco-climatic parameter maps for the six geo-political zones other than climatic or eco-climatic map. Furthermore, Nigeria Meteorological Agency produce annual rainfall prediction maps using derived rainfall parameter. However, all these do not integrate ecological parameter (vegetation biomass) with derived climatic parameter to depict the state of the environment in quantitative terms.
The mathematical combination of various layers to derive eco-climatic index and map of the northern Nigeria illustrate moisture variability typical of the region. Andrade et al. (2005) observed that spatial and temporal rainfall variability scenario is more compatible to the physical reality. The derived climatic and ecological variables are the building block for defining the zones in quantitative terms. The derived maps show clearly the vulnerability of the entire belt to drought, aridity and crop failure. Maps are needed to display ecosystem distribution and hierarchy (Tim and John, 1996). In addition, it identified the fundamental moisture condition patterns that could fill the gap of inaccurate and out-dated information evident of the developmental processes in the country. To be effective, management responses must now be rigorously assessed with focused and practical ecological analysis (Halpin, 1997). Reliable and sufficient geo-spatial information is shown here to be vital for sustainable development of any nation, since adequate, accurate maps and geo-spatial data base can provide basis for any developmental decision. As a result, these eco-climatic indicators and map are crucial environmental indicators and fundamental tool for natural resource management in this belt.
The homogeneous moisture stress identified in the Arid/ Semi-Arid zone beyond Latitude 100N is an indication of aridity in northern Nigeria. Desertification is a serious threat to arid and semiarid environments-which cover 40% of the global land surface and are populated by approximately 1 billion humans (Veron e al., 2006). This trend is disastrous to the agricultural sector, rural livelihood and can escalate food insecurity. Similarly, Ann et al., (2013) concludes that Societal vulnerability to the risks associated with climate change may exacerbate ongoing social and economic challenges, particularly for those parts of society which dependent on resources that are sensitive to changes in climate.
These derived eco-climatic indices provide detailed and accurate information on the eco climatic zones. Furthermore, the derived eco-climatic map depicts the present State of eco- climatic zones in the region. Designation of tension zones is an important prerequisite for formulating national polices that address land degradation and desertification (Eswaran and Reich, 1998; Alex, 2013). The derived eco-climatic map reveals that the eco-climatic index is fundamental for identifying, delimiting, and describing the major types of eco-climatic conditions in quantitative terms; moreover, it is sensitive to climatic variation across the region.
The most important point which emerges from the study is the need to identify the heterogeneity in the eco-climatic zones across the belt in the national planning policy. In addition, designs a tool for adaptation to the changing environment, enhance agricultural productivity, poverty alleviation and environmental sustainability. The sustainable management of environmental resources is not possible until their worth is appreciated and an appropriate price is paid for the benefits received (Soussan, 1992). The identified variability in the derived eco-climatic zone is of tremendous importance for farmers and, indeed, all the inhabitants, because agricultural productivity to large extent is a function of eco-climatic condition. Therefore, identification of these zones could enhance agricultural suitability planning across northern Nigeria. It is inevitable from the resultant map to promote water control and conservation particularly, in areas beyond Latitude 10°N. The development of irrigation scheme in this arid and semi-arid zone will minimize the effect of drought, augment all year round cultivation, ensure enough pasture and water for livestock and lessen the dangers of flooding downstream as already evident in the region. Moreover, in severe drought years that onset dates and HGS are insignificant (especially around Nguru and Maiduguri) irrigation agriculture will minimise the effect and reduce southward migration that usually characterized such years.
The apparent and widespread desertification across the northern region could result to meteorological changes will reduce rainfall effectiveness. By inference, the identified changes imposed localised impacts on regional circulation system and super-imposed global variability pattern, indicating drought and crop failure are inevitable in the region. The spatio-temporal trend indicated that the belt will become drier as such that the dwindling avail-ability of the vital natural resources required for survival will be aggravated. Suggesting, food insecurity, famine, loss of biodiversity, poverty, women and children labour and socio-economic instability will be severe in the region. Accurate assessment of the status, change, and trend of desertification will be instrumental in developing global actions to prevent and eradicate the problem (Yang et al., 2005). The majority of the population in this belt live in rural areas where the primary occupation is agriculture (rainfed), so the identified trend is a threat to economic growth. Consequently, identification of the current eco-climatic zones provide accurate and adequate information fundamental for the achievement of food security and sustainability of the physical environment in the belt where most economies are mostly agro-based.
Iloeje (1976)’s climatic map identified four climatic zones over the whole of Nigeria; high plateaux, subequatorial south, tropical hinterland and tropical continental north. This classification was based on quantitative definition of temperature and precipitation values (Koppen, 1918; Strahler, 1969). Generally, Köppen's limits are basically simple averages of the directly observed values of the climatic elements. It has been evident for a while (Muhammad et al., 2005) that these parameters alone cannot explain conditions pertinent to environmental sustainability in dry and dry sub-humid environments. The challenge therefore, is to use accurate and reliable methods to compute the derived parameters (onset, cessation, HGS and MQI) with little or no generalization. For example, NIMET (2008) prediction delineated the north eastern zone as a zone with 80 – 120 days of HGS and CCCFR (2005) also classified north western zone with 100- 120 HGS days. How these days of potential plant growth and development will be distributed throughout the season and how the rainfall receipt could be translated into actual moisture available to plants is not considered. This has remained the single reason why despite apparent seasonal improvements in the total rainfall receipt, crop failure has remained an issue across the belt. Consequently, the present study captured the moisture stress across the belt, better identifying the extreme northeast as a zone with less than 60 days of HGS, the northwest extending to the northeast with less than 90 HGS days signifying that crop failure is inevitable across the zone.
Generally, the country’s climatic classification is based on broad regional levels which do not identify sub-units for the purpose of landuse planning and other practical purposes. In addition these classifications are based on methods that are about two centuries’ old or cumulative values despite the growing level of knowledge and technology. Above all, researches have attested to the fact that mean and total rainfall figures are irrelevant for plant growth and development. Thornthwaite (1948), Denton and Barness (1988), Andrade et al. (2005) and Dantas et al. (2007) identified precipitation effectiveness and plant growth as fundamental in climatic classification. Consequently, climatic classification on the basis of mean temperature and precipitation values is not crucial for plant requirement as does the classifications based precipitation effectiveness and vegetation biomass. It identifies the remarkable evidence of progressive trans-formation of tropical continental north to Arid/ Semi-Arid eco-climatic condition and Dry Sub-Humid eco-climatic condition is the transition zone between the dry north and the humid south. Tropical hinterland shows diversified level of humidity; Sub-humid, Humid and wet eco-climatic zones. Ecosystems are liable to undergo sudden discontinuous transitions from a vegetated to a desert State (Sonia et al., 2007), these necessitate the re-appraisal of the broad regional classification that has been in use and the need to capture the variation within the topical areas for developmental policy.
The integration of the derived eco-climatic parameters are crucial for identifying the state of the environment in quantitative term, at micro / pixel level and this will enhance decision making regarding crop suitability and sustainability of the natural environment. The quantitative description of the eco-climatic condition provides an indicator of natural environment sensitivity to climate change and climatic vulnerability that will enhance management of natural resources and lead to the attainment of sustainable development. David and Chasca (2005) considered climate change as ‘special’ amongst livelihood disturbing factors in the developing world. The eco- climatic index and map have depicts shift of the climatic zones to lower latitudes, necessitating the adaptation of high latitude species in the lower latitude for enhanced livelihood. Furthermore, all measures should be towards reducing this southward shift and the impacts of the shift by proper resource management strategies. Thus, the derived eco climatic map will enhance crop sustainability decision, increase food production and sustainability of the physical environment.
Homogenous moisture stress identified north of latitude 10° (Sudano-sahelian states) reveals that drought severity is mainly a function of the changes that are evident in the region. Consequently the derive map confirms that Sudano-sahelian states (sokoto, Kebbi, Katsina, Kano, Jigawa, BOrno, Yobe Bauchi and Gombe has now been transformed to semi-arid and arid environment and this is important for any planning on natural resource management. Climate forecasting is not the panacea to all our problems in agriculture; instead, it is one of many risk management tools that sometimes play an important role in decision-making Holger and Roger (2005). Consequently, the derived eco-climatic map constitutes proactive approach in the region sustainability decision particularly, those regarding resource deficits. As a result the current eco-climatic condition and map of northern Nigeria is crucial for enhance food security and sustainability of physical environment.
Integration of meteorological and remote sensing data using empirical relationship in GIS environment has the capability of providing pointers to be the best possible sustainable solutions to the critical environmental issues. The derived eco-climatic index and map integrated climatic and vegetation indices and therefore better related to sustainable agricultural productivity and food security as against climatic classification based on mean temperature and rainfall values. Consequently, sustain-ability of agricultural productivity and other socio-economic activities in the region is primarily a function of accurate, up-to-date and adequate eco-climatic information on the state of the environment.
The author(s) did not declare any conflict of interest.
REFERENCES
|
AbdulKadir A, Usman MT, Shaba AH, Saidu S (2013). An appraisal of the eco-climatic characteristics in Northern Nigeria. Afr. J. Environ. Sci. Technol. 7(8): 748-757.
|
|
|
|
AbdulKadir A, Usman MT, Shaba AH, Shaba (2013). Climate Change, Aridity Trend and Agricultural Sustainability of the Sudano-sahelian Belt of Nigeria. Special Issue: Development and Sustainability in Africa – Part 1. Int. J. Dev. Sustain. 2 (2):1436-1456.
|
|
|
|
|
Alex DS (2013). Climate change hotspots mapping: what have we learned? Clim. Change 123(1):23-37.
|
|
|
|
|
Andrade JAS de, Bastos EA, Barros AHC, Silva CO da, Gomes AAN(2005) Climatic Classification and semiarid zone regionalization of the Piauí State, Brazil, under distinct rainfall scenarios. Rev. Ciênc. Agron. 36 (2):143-151
|
|
|
|
|
Ann O, Ndubuisi EL, Wilfred U (2013) Risk Management and Challenges of Climate Change in Nigeria. J. Hum. Ecol. 41(3):221-235.
|
|
|
|
BenoˆÄ±t S (2012). Present and future climate change in the semi-arid region of West Africa: a crucial input for practical adaptation in agriculture. Atmospheric science letters Published online in Wiley Online Library.
Crossref |
|
|
|
Bounoua L, Defries R, Collatz GJ, Seller P, Khan H (2002). Effects of Landcover on Surface Climate. Clim. Change 52: 29-64.
Crossref |
|
|
|
Brian R, Ed N (1992) Assessing the Sensitivity of Canada's Ecosystem to Climatic Change. Clim. Change 21:37-55.
Crossref |
|
|
|
|
Centre for Climate change and Fresh Water Resources (CCFR) (2005). Eco-climatic Atlas. MINNA FUTMIN Consult.
|
|
|
|
Chuvieco E, Marti´N MP, Palacios A (2002) Assessment of di Verent spectral indices in the red–near-infrared spectral domain for burned land discrimination. Int. J. Remote Sens. 23 (23):5103-5110.
Crossref |
|
|
|
Claire CV, Pam B, Paul O, Hans B, Bianca N, Jesse O, Claire B, Kuipers H (2008). Adapting landscapes to climate change: examples of climate-proof ecosystem networks and priority adaptation zones. J. Appl. Ecol. 45:1722-173.
Crossref |
|
|
|
Colin DB, David H (2010).Primary, secondary and tertiary effects of eco-climatic change: the medical response. Postgrad. Med. J. 86:230-234.
Crossref |
|
|
|
Dantas AAA, Carvalho LG de, Ferreira E (2007). Climatic classification and tendencies in Lavras region, MG. Ciênc. agrotec. 31(6): 1862-1866.
Crossref |
|
|
|
|
David MW, Thomas LW, Gerard M (2004). Delineation and evaluation of Hydrologic- landscape Regions in United States Using GIS Tools and Multivariate Statistical Analysis. Environ. Manage. 32 (1):871-888.
|
|
|
|
|
David SGT, Chasca T (2005). Adaptation to Climate Change: Perspectives Across Scales. Glob. Environ. Change Part A 15(2): 115-124.
|
|
|
|
|
Denton SR, Barnes BV (1988). An Ecological Climatic Classification of Michigan: A Quantitative Approach. For. Sci. 34 (1):119 – 138.
|
|
|
|
|
Dewidar KH, Al Rehili B (2013). Assessment of vegetation indices for estimating plant coverage and plant density Mountains, Saudi Arabia. Merit Res. J. Agric. Sci. Soil Sci. 1(2):19-32.
|
|
|
|
|
Eswaran H, Reich P (1998). Desertification: A global assessment of land quality. Proceedings of 16th International Congress of Soil Science, Montpellier, France.
|
|
|
|
Fraser EDG, Dougill AJ, Hubacek K, Quinn CH, Sendzimir J, Termansen M (2011). Assessing vulnerability to climate change in dryland livelihood systems: conceptual challenges and interdisciplinary solutions. Ecol. Soc. 16(3):3.
Crossref |
|
|
|
Halpin PN (1997). Global Climate Change and Natural-area Protection: Management Responses and Research Directions. Ecol. Appl. 7(3): 828-843.
Crossref |
|
|
|
Holger M, Roger CS (2005). Seasonal and Inter-Annual Climate Forecasting: The New Tool for Increasing Preparedness to Climate Variability and Change in Agricultural Planning and Operations. Clim. Change 70 (1-2):221-253.
Crossref |
|
|
|
|
Iloeje NP (1976). A New Geography of Nigeria. Nigeria, Longman Limited ISBN 0 582 65510 2
|
|
|
|
|
Julius GT (2015). The Extent of Spatial Temporal Variations in Land Use and its Implications on Forest Ecosystems: A Case of Nandi Hills Forests Kenya. Dev. Ctry. Stud. 5(8):129 -139.
|
|
|
|
Kitchen NR, Myers DB, Drummonde ST, Hong SY (2005). Delineating productivity zones on claypan soil fields using apparent soil electrical conductivity. Comput. Electron. Agric. 46 (1-3):285-308.
Crossref |
|
|
|
Malingreau JP, Tucker CJ, Laporte N (1989). AVHRR for monitoring global tropical deforestation. Int. J. Remote Sens. 10: 855-867.
Crossref |
|
|
|
|
Martin B (2014). European Isotherms Move Northwards by up to 15 Km/Year: Using Climate Analogues for Awareness-Raising. Eur. Sci. J. /SPECIAL/ edition ISSN: 1857 – 7881. pp. 547-556
|
|
|
|
Maselli F, Petkov L, Maracchi G, Conese C (1996). Eco-climatic classification of Tuscany through NOAA-AVHRR data. Int. J. Remote Sens. 17(12): 2369-2384.
Crossref |
|
|
|
Mechi GA (1994). Influence of the Land Surface in the Asian Summer Monsoon: Extend Conditions Versus Internal Feedbacks. J. Clim. 7: 1033-1049.
Crossref |
|
|
|
Muhammad TU, Emma A, Peter J, Mark T (2005). A conceptual framework for enhancing the utility of rainfall hazard for agriculture in marginal environment. Nat. Hazards 34: 111-129
Crossref |
|
|
|
Nicholson SE (2001). Climatic and environmental change in Africa during the last two centuries. Clim. Res. 17:123-144.
Crossref |
|
|
|
|
NIMET (2008). Year 2008 Rainfall Prediction and Socio-economic implication for all parts of Nigeria. Annual Bulletin, Abuja Nigeria Meteorological Services.
|
|
|
|
Sonia K, Max R, Minus VB, Michel L (2007). Local facilitation, bistability and transitions in arid ecosystems. Theor. Popul. Biol. 71(3): 367- 379
Crossref |
|
|
|
|
Soussan JG (1992). Sustainable development. Environmental issues in the 1990s. John Wiley and Sons. pp. 20-33.
|
|
|
|
|
Strahler A (1969). Physical Geography, Third Edition. New York, John Wiley and Sons, Inc.
|
|
|
|
Thornthwaite CW (1948). An approach toward a rational classification of climate. Geogr. Rev. 38:55-94.
Crossref |
|
|
|
|
Tim H, John Y (1996). Spatial Prediction of Climatic state factor Regions in Alaska. Ecoscience 3(4): 490-500.
|
|
|
|
Veron SR, Paruelo JM, Oesterheld M (2006). Assessing desertification. J. Arid Environ. 66(4): 751-763.
Crossref |
|
|
|
|
Williams WH, Forrest MH (2005). Delineation and Visualization of ecoregions. Environ. Manage. 32 (1) 839-860.
|
|
|
|
Wing HC, Gabriel BS, Ashbindu S (2008). Trends and spatial distribution of annual and seasonal rainfall in Ethiopia. Int. J. Climatol. 28(13):1723-1734
Crossref |
|
|
|
Yan B, Sylvie G, David RG, Héloïse LG, Patrick L, Jacques M (2013). Fire regime zonation under current and future climate over eastern Canada. Ecol. Appl. 23(4):904-923.
Crossref |
|
|
|
Yang X, Zhang K, Jai B, Ci L (2005). Desertification assessment in China: An overview. J. Arid Environ. 63(2):517-531.
Crossref |
|
|
|
Zhang K, Li X, Zhou W, Zhang D, Yu Z (2006). Land resource degradation in China: Analysis of status, trends and strategy. Int. J. Sustain. Dev. World Ecol. 13(5):397-408.
Crossref |
|