In the last years, the distribution of spatial and non-spatial data on the internet plays a crucial role in national development. It facilitates communication between administration, decision-makers and citizens for urban management. In order to encourage the sharing and disseminating of data, the present study aims to develop and implement WebGIS framework for urban management, which offer possibilities to access the right data in the right time to make the right decisions. In this paper web based WebGIS architecture is described and implemented using open source tools such as Geoserver, Tomcat apache and OpenLayers. The work also utilized Web client technologies such as HyperText Markup Language (HTML) for providing the flexibility and more interactivity. An area of Batna city in eastern of Algeria has been chosen. The study demonstrates that web GIS in combination with an urban geographic information system (GIS) is very useful and vital tools for visualizing and improving the decision-making processes.
Despite the rapid development of geographic information system (GIS) software, Database Management Systems, and more recently remote sensing, there remains a variety of issues that challenge researchers, developers, professionals and public users in the field. One of the oldest and still continuing issues in geospatial systems and applications is access to spatial data to use it efficiently for decision making.
The Internet, in particular the World Wide Web, is fast becoming an integral part of our daily lives and an essential medium for satisfying everyday needs (Skarlatidou et al., 2013). Within the past few years, the popularity of interactive web maps has exploded (Hazzard, 2011), and accessed and viewed by millions of users today (Peterson, 2003). Indeed, with the advent of open source solutions like Geoserver, Tomcat Apache, Udig and OpenLayers, online mapping is easily accessible, and everyone can create modern, fast and interactive web mapping applications with little or even no knowledge of geography, cartography or programming. WebGIS is the process of designing, implementing, generating and delivering maps, geospatial data and geographic information systems functionality or services on the World Wide Web over the internet (Li et al., 2011; Yang et al., 2005; Gillavry, 2000). WebGIS by the urgency of affordable progressive in web technologies, especially open source solutions, becomes a cheap and easy way of disseminating geospatial data and building interactive maps. Various studies in many fields (Environment, disaster management, urban management, etc.) have been carried out, and different methods have been proposed by using a variety of open source software (Alesheikh et al., 2002; Kokalj et al., 2006; Xie, 2010; Pirotti et al., 2011).
The process of urbanization in the city of Batna by classical tools showed a moderate efficiency, and put constraints to the administrators of local authorities as well as the citizens. These constraints are expressed in terms of control the incoherent growth of the city, lack of centralized urban management, but especially difficulties of sharing and access to data. Due to this, mapping and coherent management of the city of Batna have become a necessity utilizing modern tools like geographic information systems and remote sensing. Furthermore, development of the WebGIS plays crucial role for management of urban issues and provide two keys capabilities. First, the user can easily access, consult and retrieve the spatial data, with possibility to participate efficiently on the territorial development. Second, in order to collaboration in city’s activities, it is important that all urban administrations work under a centralized system (platform) to avoid taking any action without informing other ones. So, administration and organizations by sharing their spatial data on updated WebGIS would lead to coordinated urban development. In order to achieve this goal, present article describes design and development of a web-based GIS which have greatly contributed to the sustainable urban management.
DESCRIPTION OF STUDY AREA
Batna city, capital of the Aures massif is located in Eastern Algeria, in the province of Batna, between latitude 35°34’ to 35°31’ North and longitude 6°13’ to 6°7’ East. In the middle of platitude, surrounded by mountains with rugged relief. In the last four decade, the territory of the city spreads significantly from 483.43 ha in 1972 to more than 1331.32 ha in 1987 and from 2056.41 ha in 2001 to more than 2852.41 ha in 2013 and the number of registered inhabitants reached 319742 in 2013 which makes the city of Batna the largest and the main economic center of the state (5th class according to the Algerian city row daynamic) (Kasdallah, 2013). The incoherent expansion of the urban area had a remarkable effect on the urban management, the phenomenon of the urban sprawl effect become more and more severe in the city in recent years. To resolve this problem, it has been important to encourage a higher participation of citizens in the urban process in order to improve the goal of participatory democracy.
Moreover, present WebGIS developed in accordance with the Algerian Government’s Action Plan (PAG) promulgated in 2012 (in particular, articles 23, 24, 25 and 26) concerning the governance and the modernization, aims to strenghen the efforts exerted by the state to establish a new relationship between administration and citizens in terms of access to data. And to end all forms of overruns, injustices and marginalization. For this reason, we based on a strategy that includes the essential principles, especially:
(i) The right of citizens in information, transparency of administrative acts and protection against abuses of power.
(ii) Improving and simplifying administrative formalities and procedures, and equal access to data.
(iii) Better control of citizens on local public affairs.
Open source software (OSS)
Open source software provides the entire instrument necessary to build-up a web solution for a spatial information system that can be completely used interactively (Rinaudo et al., 2007). Open source software by Wheeler (2010), must grants four freedoms; to run the program for any purpose, to study how the program works, to redistribute copies, and to improve the program and to make it available for public. To make this, the software must include source code in which a programmer would modify the program. In the present article, following open source software are used:
Geoserver
Written in Java, Geoserver is an open source platform that supports the Open Geospatial Consortium (OGC) standards like Web Map Service (WMS), Web Feature Service (WFS), and Web Coverage Service (WCS). Geoserver allows for great flexibility in map creation and data sharing. It can easily work with a large range of data formats like Shapfiles (ESRI), PostGIS, Oracle spatial, ArcSDE, DB2, MySQL, GeoTIFF, GTOPO30, ECW, Jpeg2000, and other spatial formats. Furthermore, Open Layers is client side software (free mapping library) which is widely used with Geoserver to make map generation quick and more easily.
Tomcat apache
Based on the works of Agrawal and Gupla (2014), Tomcat Apache is an open source web server and servlet container, it plays the pivotal role in the development of any WebGIS framework. It handles the HTTP request coming from the web client and sends back HTTP response. Indeed, present article based on Tomcat Apache because it can run on different platforms (windows, etc), which made it available to wider public.
Open layers
Developed originally by Metacarta, Open Layers is an open source client side java script library that can be customized in a HTML document for making and displaying interactive web maps, viewable in nearly any web browser. It makes creating powerful web mapping applications fast and easier. Furthermore, Open Layers is an Application Programmer Interface (API) that provides with a robust library (tools) (Hazzard, 2011). Open layers can be used in present article to build entire mapping applications, with the ability to customize every aspect of map-layers, controls, events, etc.
Udig
Udig is also a popular Java-based desktop GIS software. The name, Udig, stands for “User-friendly Desktop Internet GIS”. Therefore, Udig offers strong capabilities to integrate Web mapping technologies, such as WMS, WFS, remote ArcSDE, WCS, GeoRSS and KML. Udig is built upon IBM's Eclipse platform with a “clean” user interface. It provides several good GIS functions, including the Styled Layer Descriptor (SLD) support, Web Catalog Server support, and thematic mapping with advanced symbology.
WebGIS architecture and employment
This article aims to develop a web based GIS to manage and monitor the urban planning process in a city of Batna as a case of study. To achieve this, we firstly installed the map server (Geoserver) by a classical executable file. Secondly, we installed the Java application server for developing web applications, for this purpose, Tomcat Apache is the most used and the most efficient. Thirdly, a specific directory is created in Geoserver to save the future configuration (C:\Program Files\GeoServer 2.5\data_dir\), then we configured Geoserver on this directory. The final step consists in connecting Geoserver to the database created by GIS software.
Figure 1 gives an overview of the various components and how these provide a seamless data flow for publication. The simplest form of WebGIS should have at least a server and a client, where the server is a web application server, and the client is a web browser (Pascaul et al., 2012). The web based GIS architecture in present work consists of three levels (three-tier conceptual architecture):
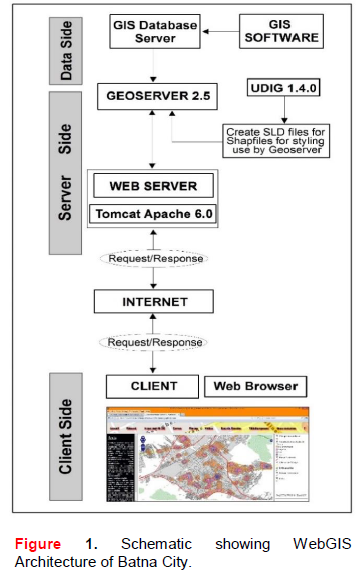
(i) The first level is client side (user interface), offers user interface functions, allows the interaction with the WebGIS, and displays the results.
(ii) The second level is server side (logical tier), includes web server (Tomcat Apache) and map server (Geoserver). Logical tier offers accomplishment of all business logic, data access function, and performs the processing task. The server will respond to the user’s request.
(iii) The third level is data side (data storage), consists of databases that stare Batna’s geospatial information.
Technically, when the user connect and request some data from the web server using a web browser (Baidu, Mozilla, IE, etc). Tomcat Apache in the first step establishes a connection between the internet and Geoserver by sending the HTTP request to Geoserver. In the second step, Geoserver receives the request, which is analyzed by defined concepts and logical restrictions. In the third step, the results founded in geographic databases are sent back to the Geoserver, which returns the results to the web server (Tomcat Apache). In the last step, web server displays the returned results to the end users at the client side in the form of tables and on the map.
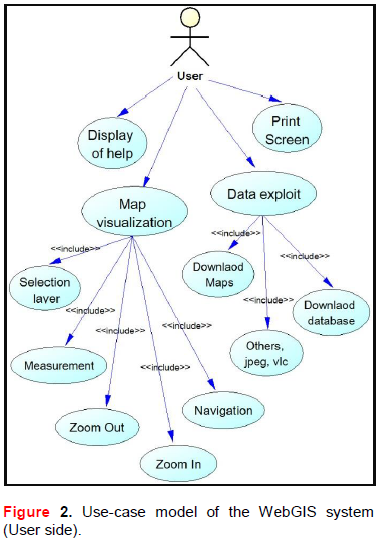
System use case diagram
Figure 2 depicts the use case diagram of the system. It shows four main use case. According to this application, a user will be able to perform major functions like visualization of maps (with capacity of handling, zooming, selection of desired layer and make measurements), exploiting data by downloading databases and other information, the user can also display help and print screen. The developed GIS of the city of Batna provide a rich and varied collection of data that are used to develop a high quality WebGIS. It also constitutes the result of a long process of collection, verification and classification. They are in fact, consist of administrative boundaries, housing, public facilities, land use and land cover, sewerage, water network, roads, electricity network, hydrographic data, easements, major development orientations, telecommunications and physical environment of the area, etc. Furthermore, all these data are in Shapfiles format (objects and attributes) with the exception of topographic and cadastral maps (GeoTIFF format). ArcGIS from ESRI with the Arctoolbox associated has been used as GIS software for creation of geographic database and performing spatial analysis. Our choice is justified more than one way; we searched the effectiveness by directing our implementation towards sophistical solutions, to make a complicated spatial analysis and to get a consistent database.
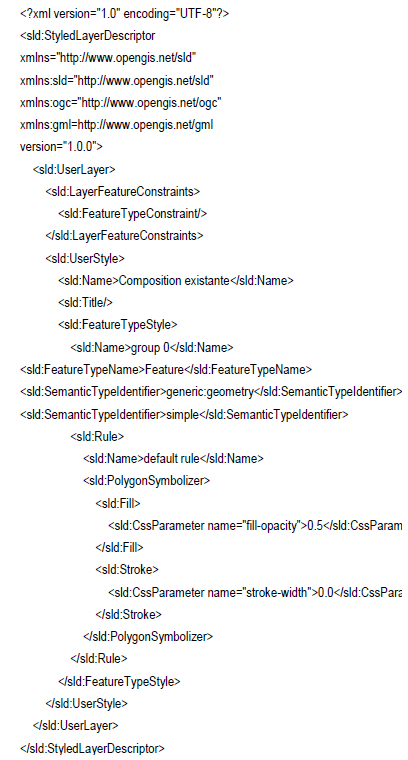
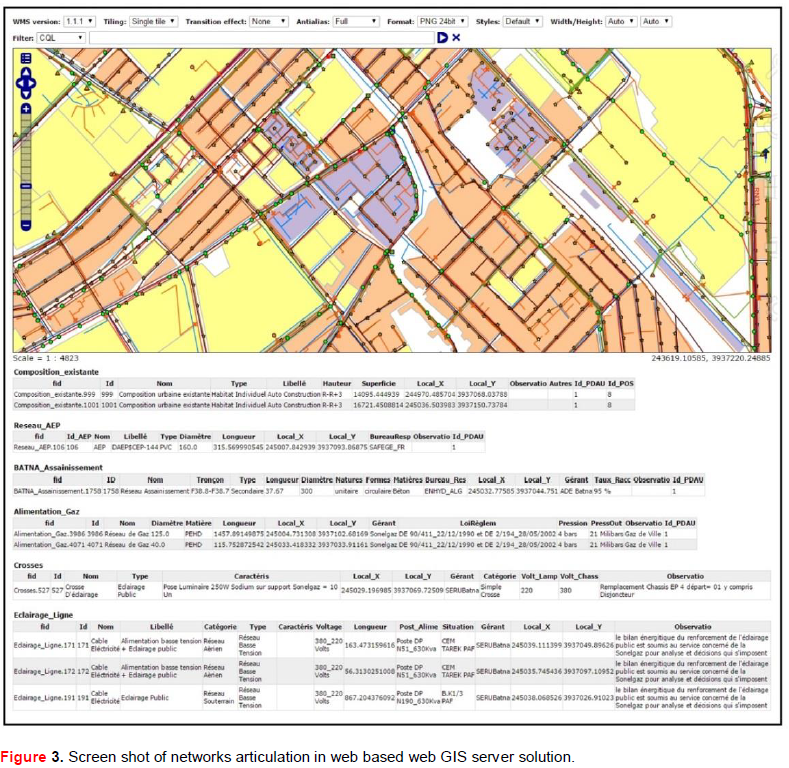
The objective of present work is to publish urban data through a network, to make the consultation and the use of data available for everyone who is connected. To achieve this goal, the article is summarized in two points. At first, a step of integration of data in application server, in the Geoserver, it consists to create a new workspace to include all the stores, than publication of the whole layers by specifying the general parameters (name, title, coordinate reference system and the bounding boxes). The second step consists of making our data symbolized; geospatial data have no intrinsic visual component. To see and understand a data, it must be symbolized, this means specifying a color, thickness and other visible attributes (Figure 3). In Geoserver, this symbolization is carried out by using a tagged language called “Styled Layer Descriptor” or SLD. Moreover, the SLD files contain a description of the display styles of layers, depending on the type of geometric shape, scales of visualization, a classification on an attribute value, etc. they are written using a script in Extensible Markup Language (XML) according to a syntax standardized by the Open Geospatial Consortium (OGC). This step was adopted by using open source software (Udig 1.4.0). The following example gives an impression of the content and the structure of XML data file:
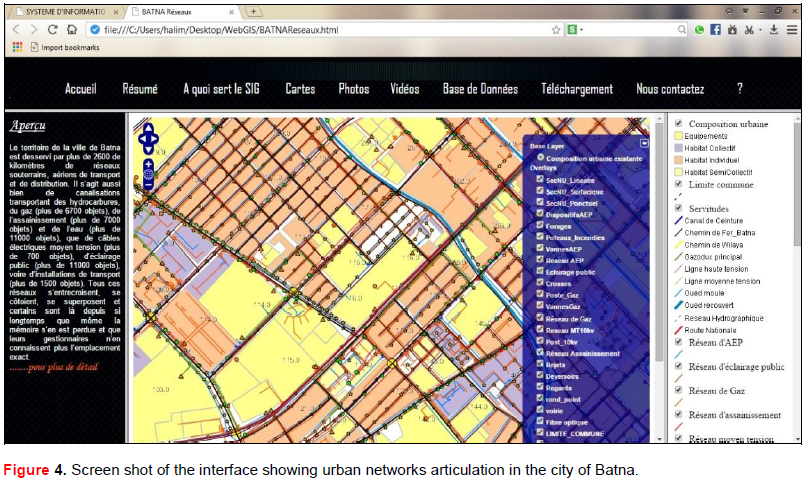
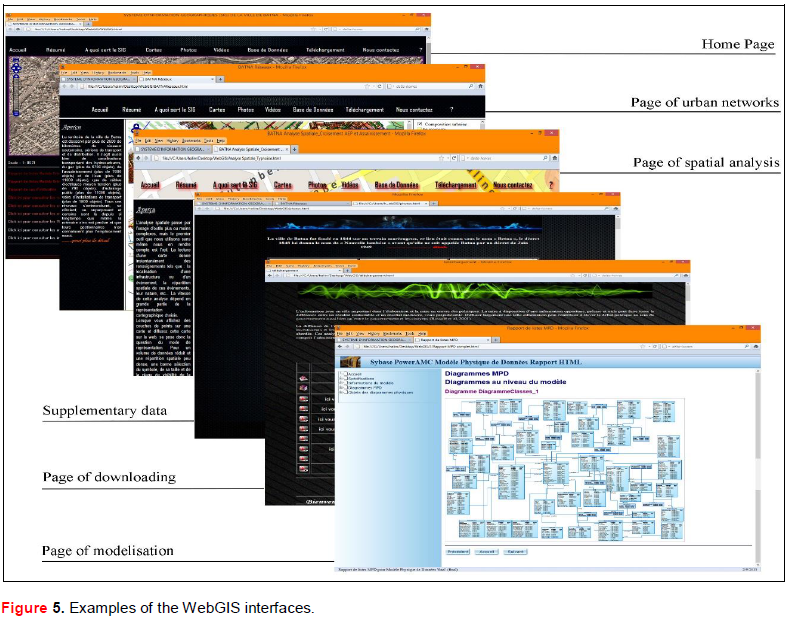
Present developed WebGIS enables the delivery of data and maps from geographic information systems (GIS) over the internet. Indeed, it can enable publication of high quality maps, with the capacity to query, manipulate, and interact with big volume of data. With web feature service (WFS) and web coverage service (WCS) standards, as well as a high performance certified compliant web map service (WMS), it can also display easily both raster and vector data, like satellite imagery, digital elevation model, topographic maps, spatial analysis data, and some extension such as Shapfiles data. The WebGIS may also linked to other kind of non-geospatial data sources and allow photographs, video, KML data to be displayed or consulted simultaneously with the spatial data. To thisend, the WebGIS of the city of Batna that we developed (Figure 4) were based on eight alternative interfaces (divided between collaborative block and data analysis block), developed within the framework of an analysis of needs concerning the data required from the various services and organizations, to ensure the performance of our WebGIS. Specifically, one interface incorporated all the previously interfaces. The rest of the interfaces include the following parts (Figure 5):
Interface 1: Home page, this page provides an abstract (guidelines) of the content of each page for a WebGIS.
Interface 2: Provides different spatial and spatio-statistical analysis improved using GIS software and integrated in the WebGIS:
(i) An analysis of the established fact for future integrated management.
(ii) A spatial analysis of a tool of planning, follow-up and intervention (crossing of the networks and associated risks).
(iii) An analysis for the management of industrial disasters (industrial area of the city of Batna).
(iv) A statistical analysis of the administrative city center
(basis of the congestion of the city).
(v) A diachronic analysis of consumption of the agricultural land in favor of uncontrolled urbanization.
(vi) A space-time analysis between projected and realized urban programs.
Interface 3: Provides a gallery of maps carried out concerning varied domains such, topography, social and economic characteristics, urban planning, risks, etc.
Interface 4: Incorporates all supplementary data such as photos, videos, 3D designs, KML, etc.
Interface 5: Page of consultation of the alphanumeric and geospatial database.
Interface 6: This page provides a capacity of downloading and updating statistics of interest inserted by multiple users.
Interface 7: Provides a complete and sophistical page of a modeling approach used to develop our GIS (class diagram, use case diagram, physical model of data).
Interface 8: Contact page to participate and improve the WebGIS.
Map is the core concept in OpenLayers. It allows us to visualize information from different kinds of layers (Perez, 2012). The graphic design of present interface aims at improving the design quality of the visualizations such as conventional color combinations and map size. It suggests that even map features and legends should be clearly communicated with high quality at all provided scales. Indeed, the size of the map frame selected (900x464 pixels) should giving the impression that the map’s context is easily comprehensive and clearly visible to interpret maps effortlessly. Moreover, the most important applications that present WebGIS offers to its users is a great number of controls. Controls allow navigating through the map, playing with layers, zooming in or out, performing actions such as editing features and measuring distances. In essence, controls allow interacting with the layers, which make it more flexible.
The following example shows the structure of code for the controls added to the map:
On the other hand, the use of classical GIS applications which are mostly too expensive, need a considerable knowledge and manipulation of geography, cartography concepts, spatial analysis techniques and programming to deliver maps and provide complex spatial analysis to users. So by using the present WebGIS, expert and non-expert users from anywhere do not need to install expensive GIS software in their computer to get spatial information and interactive maps, the interface allows to request a service, which includes geospatial data and different analyses. Furthermore, by the relative richness of the interface contents, it can replace the commercialized GIS software, and citizens can have access to city information (master development plan, land use plan, cadastral data, urban networks articulation, easements, etc.) and be more informed, which increase the ability to participate in territorial development and decision making.
In this article, it was discussed that in order to implement an efficiency and appropriate decision making, it is important that all organizations and local authorities share their data in a complete and centralized platform. Web based WebGIS as a tool provides a low cost and an efficient way to deliver data and maps products to users. The development of WebGIS has been described in detail and many interactive interfaces covering a wide range of applications in the fields of urban land cover/land use mapping, urban planning, urban growth monitoring, urban hazard and risk analysis as well as urban ecology studies have been embedded.
Despite the limited size of data that support the system (52 layers), the results indicates that the centralized platform developed with open source solutions is very suitable for local authorities to limit their financial budget, communicate data and make the most appropriate decisions for territorial management. Furthermore, an interactive WebGIS is an ideal tool to facilitate and encourage public participation in the urban development process. In addition, the technique presented in this study could be used as an efficient method for more effective monitoring and management. It would be very simple and useful to apply this method to other small and medium Algerian cities.