ABSTRACT
This paper analyses the trend in rainfall and water balance characteristics of Awka, Nigeria using the monthly rainfall data retrieved from the archives of the Nigeria Meteorological Agency in Lagos from 1976 to 2015. The tools employed for the study are linear regression analysis, cumulative sum (CUSUM) technique, Walter’s cumulative index analysis and Thornthwaite’s method. Rainfall was observed to have declined and generally below the climatological mean in the first decade, while from1988 to early 2000s, rainfall has maintained a steady rise. The length of rainy season has shown significant number of variations, but has recorded a general increase. The rainfall onset and cessation periods were predominantly March/April and October, respectively though significant changes in onset periods has been evident in the last 10 years with 6 out of the 10 having onset occurring in February. This study observed a reduction by one month in the periods of soil moisture utilization and increase by the same amount in the periods of soil moisture recharge. As a consequence, amount of water surplus has increased. However, this study provides explanation on the current state of rainfall in relation to climatic water budgeting for Awka and as such important for agricultural and water resource planning.
Key words: Cumulative sum technique, water balance components, Walter’s cumulative index analysis, Thornthwaite’s method.
Precipitation, in all its forms, is an important element of the physical environment and as such constitutes one of the most valuable sources of water, a strategic resource for human survival and social development. It is the most important hydrological input parameter and hydro climatic factor affecting man and his productivity (Bardossy, 2001; Ojo, 1990). Rainfall is one of the major factors affecting food security especially in countries largely or highly dependent on rain-fed agriculture, given that, in addition to evaporation rate and soil characteristics, it controls the state of soil moisture. The role of moisture in agricultural production is even more important in the tropics, especially Nigeria, where rainfall is highly seasonal over most parts and varies from year to year, while the growing season is determined by the availability of rain to meet crop water requirements (Ayoade, 2008). Consequently, IPCC (2007), in its synthesis report: summary for policy makers, projected that by 2020, in some countries, yields from rain-fed agriculture could be reduced by up to 50%, while agricultural production including access to food, in many African countries is projected to be severely compromised.
Among the hydrological aspects of precipitation studies, as outlined in Ayode (1988), are studies relating to variations in precipitation distribution in both space and time and analysis of precipitation data for hydrological purposes such as determination of run-off, groundwater recharge, soil moisture, flood forecasting and prediction. Precipitation is both spatially and temporally very variable while such characteristic has its attendant consequences. Ojo (1990) acknowledged that recent variabilities in precipitation have led to considerable shortages in water supply and a lot of hardships for urban population, while Bardossy (2001) is of the view that intense local precipitation, prolonged and spatially distinct rainfall events have provoked floods both in small/medium catchments and large rivers. In a more recent study, Ezenwaji et al. (2013) observed that climatic elements (temperature and rainfall) were the greatest contributors of flooding in Awka town, Nigeria during the period 2000 to 2009. Similarly, relative to the largely homogenous changes expected in temperature, precipitation trends and changes with climate reflect a more regional nature as Blake et al. (2011) noted that over the past century, the most rapid rate of precipitation increase has occurred in Sao Paulo, Brazil (+29 mm per decade) and the largest decrease has occurred in Harare, Zimbabwe (-21 mm per decade).
Thus, recent climatic variability, and most particularly rainfall variations are becoming increasingly of concern to researchers, institutions and governments. To predict future developments, past statistical trends can be considered along with physically-based climate model projections (Bardossy, 2001). Some studies based on statistical examination (Odjugo, 2010) and climate model projections (Abiodun et al., 2011) have shown that changes in precipitation behaviour is already evident in Nigeria. In addition, other scientific interests in Nigeria range from studies examining rainfall anomalies (Olaniran, 1991, 2002), to works analyzing rainfall trends and periodicities (Obot et al., 2011; Adefolalu, 1986; Ayoade, 1973; Ojo, 1990; Ezenwaji et al., 2014), to studies on rainy days (Olaniran, 1990; Omagbai, 2010a; Olaniran, 1984, 1987), seasonality (Adejuwon, 2012; Adefolalu, 1983; Adejuwon, 1990; Omagbai, 2010b), Onset, periodicities and reliability (Ilesanmi, 1972; Ayoade, 1974, 1975) and the trend of precipitation and annual water balance (Ojo, 1990).
However, examination of precipitation characteristics and trends is of great importance. It is known that possible changes in precipitation behaviour can have huge effect on the entire water balance characteristics of a region. Yet, there are few studies on the recent trends and climatic water budgeting in Nigeria, while none of such studies is in existence for the Awka region under consideration in this study. Thus, the aim of this study is to examine the result of the water balance computation in relation to current trends of precipitation and aspects of the problems such as flooding, water supply, erosion, etc., highlighted by some studies in the study area. Thus, this study intends to contribute to the growing understanding of rainfall characteristics and variability in Nigeria.
Study area
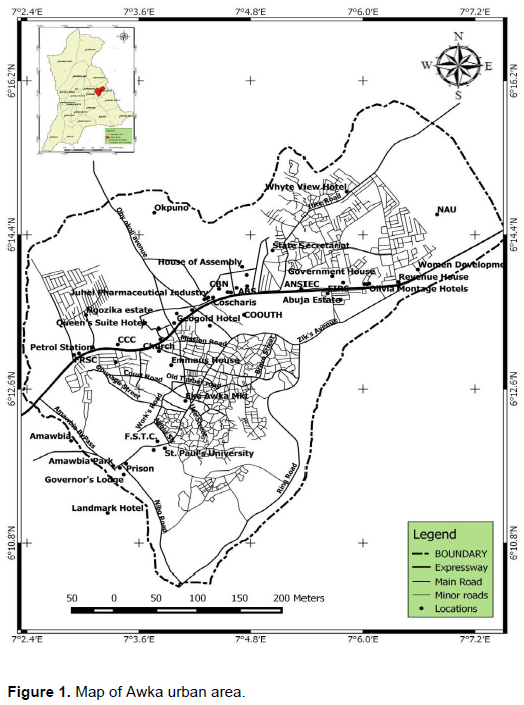
Awka is located in the eastern part of Anambra State, South-Eastern Nigeria (Figure 1). It is bounded by latitudes 6° 101Nand 6° 171N and longitudes 7° 2.41E and 7° 7.21E. The topography is characterized by rugged relief and it lies completely on the Awka-Orlu upland (Ezenwaji et al., 2013). The climate of Awka is the tropical wet and dry type according to Koppen’s classification system. The seasonal distribution of rainfall is controlled by the movement of the intertropical discontinuity air masses (ITD).
The rainfall pattern, which is controlled by the movement of the ITD, is characterized by a dry season, November to March, with dry continental North-East winds dominating during this period and a long wet season which occurs normally from April to October and dominated by the moist maritime south-west winds. In recent times, the onset and cessation periods of the rain in the study area has been observed to vary over time. The mean annual rainfall is about 1900.5 mm. The mean minimum and maximum temperatures are 23.5 and 32.1°C, respectively.
Data collection
Monthly rainfall dataset for this study was obtained from the Archive of the Nigerian Meteorological Agency (NIMET), Lagos, Nigeria for the study area. It covers a period of 40 years (1976 to 2015). The data was used to evaluate the temporal variations in precipitation characteristics of Awka and to determine other precipitation characteristics. The monthly values of rainfall for each year were summed for the 40 year period to generate annual rainfall values for the study area.
Data analysis
The temporal variation in the annual rainfall values at the study area was investigated. Trend in the time series was determined using linear regression. Having revealed so many fluctuations that the general trend of the individual variable may not be easily determined, a smoothening function was applied to the data. Thus, trend analytical technique and regression analysis were used to analyze the data.
For rainfall variabilities within the study area, mean deviation and standard deviation were calculated. In order to further explore charges in rainfall with time, mean annual rainfall was calculated at decadal intervals, that is, 1976 to 1985, 1986 to 1995, 1996 to 2005 and lastly, 2006 to 2015.
The cumulative sum technique (CUSUM, 1975), a variant of the residual mass technique, was used to examine the temporal sequence of rainfall. This technique has been proved to be a valuable tool in detecting intermediate-term changes in the mean value of a sequence of regularly spaced observations (Crapper et al., 1996). The cumulative sum si can be defined as:
where xi is the regularly spaced observation.
It can be used to detect intermediate changes in the mean values. The ordinate values are not relevant, it is the slope that is important (Crapper et al., 1996).
Attempt was made to determine the onset, duration and cessation of the rainy season in the study area for the period under investigation. This was based on method of Walter (1967) where onset of rains in Nigeria is defined in terms of the time of receiving an accumulated amount of rainfall in excess of 51 mm. The actual date of onset of rain is computed using the formula:
Days in the month × (51 - Accumulated rainfall in previous month) / (Total for the month)
The cessation is the date after which no more than 51 mm of rain is expected. The formula is applied in reverse order by accumulating total rainfall backwards from December to obtain the actual date of cessation. The duration between onset and cessation of rains represent the number of rainy days or length of rainy season. The method described in Walter (1967) is an effective method for determining effective rainfall by growing season in the tropics. This method has been applied by Adejuwon (2012) to study seasonality in the Niger Delta belt of Nigeria. The rainfall threshold value is defined thus: a day in which the rainfall amount is accumulated to51 mm is regarded as a rainy day and designated onset, while the cessation of rains is the date after which less that 51 mm of rain is expected. This amount ensures sufficient moisture in the soil to maintain crop growth and gives a reasonable guarantee that planting would be successful if started two weeks later (Adejuwon, 2012). The onset, cessation and duration of rainfall was calculated for Awka using the Cumulative Index Analysis (Adejuwon, 2012) of Walter (1967).
In addition, correlation analysis was performed to determine possible relationship between the number of rain days in a year and annual rainfall for that year.
Water budget computation was done for Awka in order to estimate values of evaporation (AE), water deficit (WD) and water surplus values (WS). This was done for the specified decades earlier. The model used is based on Thornthwaite and Mather (1957) which has also been used by Ayode (1973) to compute water balance for Jos and Calabar, Nigeria. If the appropriate monthly values of these parameters are plotted as indicated in Figure 2, we can determine as outlined in Ayoade (2008) the following:
(1) The period of moisture utilisation which is the period when AE > P.
(2) The period of water deficit which is the period when PE > AE.
(3) Period of soil moisture recharge which is the period when P > PE but the soil is not yet at field capacity.
(4) Period of water surplus which is the period when P > PE and soil is at field capacity.
Soil moisture holding capacity of 250 mm was adopted for Awka based on Thornthwaite and Mather (1957) in Ayode (2008). The potential evaporation (PE) was estimated using the formula by Thornthwaite and Mather (1957), while the relative amounts of water surplus were estimated at decadal intervals based on the same method.
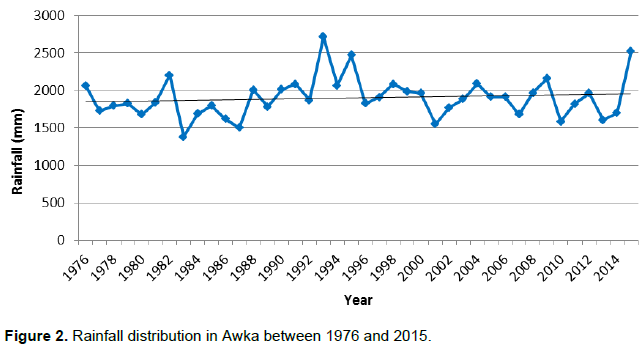
The average annual rainfall for the 40 year data is 1900.2 mm and the standard deviation is 269.8 mm, giving a coefficient of variation of 14.2%. The trend characteristics of rainfall achieved is as shown in Figure 2.
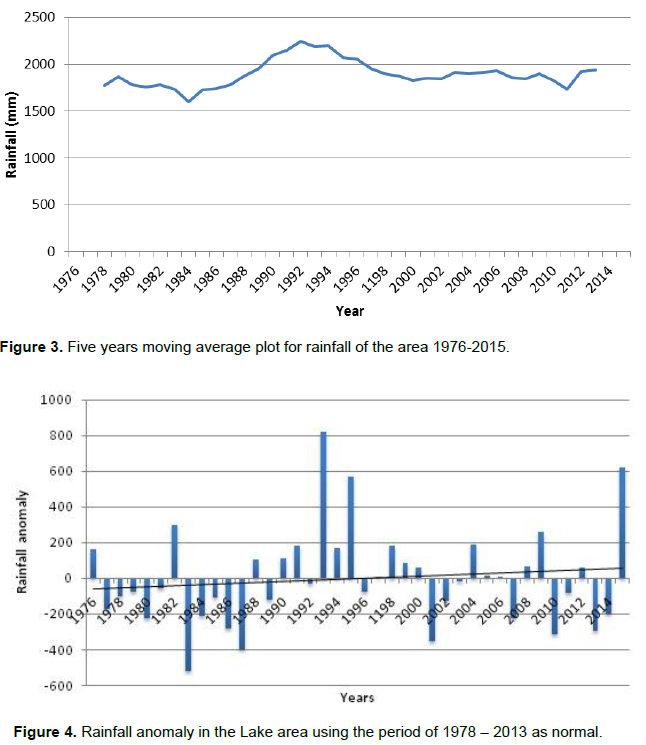
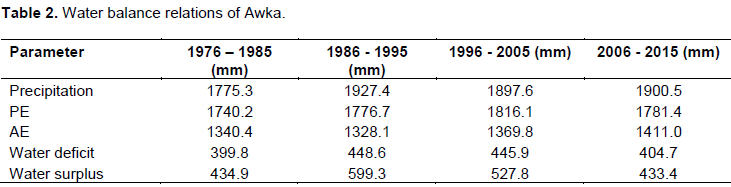
The high irregular nature of the plot shown in Figure 2 demanded the application of a smoothening function which is the moving average. The plot of a 5 year moving average of rainfall is as shown in Figure 3. While the trend is not statistically significant with a coefficient of 0.125 at 0.05 level of confidence , it is evident that the direction of rainfall is positive and the rate of this trend is indicated by an annual rate shown by the slope of the regression coefficient (b = 2.925). The trend plot of rainfall shows that at the start of the studied period (1976 to 2015), rainfall decline was recorded within first few years of the first decade (1976-1985) and was generally below the climatological mean rainfall (1900 mm) up until 1987 after which increasing rainfall was noticed for Awka. However, rainfall was found to be more pronounced between 1988 and 2000, a period that could be ascribed as wetter than any other within the studied period. A graph of rainfall anomaly (Figure 4) was also shown to give a clearer picture on rainfall condition in Awka. The rainfall anomalies relative to 1976 to 2015 normal provide evidence to the 1988 to 2000 wet period and to a more recent increase in the rainfall trend, which was more from 2004. Between 1976 -1987, rainfall was below the 1976 to 2015 normal, while from 1988 to 2013, the years with rainfall values above normal are more; 21 out of the 40 years were below normal but only 19 years (47.5%) out of the 40 years were above the normal.
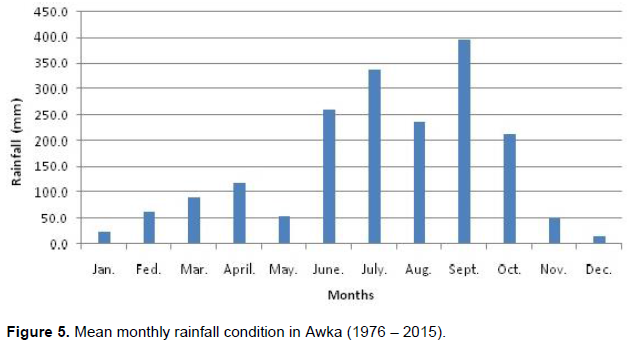
The maximum and minimum rainfall for the 40 years period were recorded in 1993 and 1983, respectively (Figure 4). The 40 years mean monthly rainfall distribution (Figure 5) shows that the monthly rainfall characteristics is bi-modal with the first peak occuring in July followed by the second peak recorded in September.
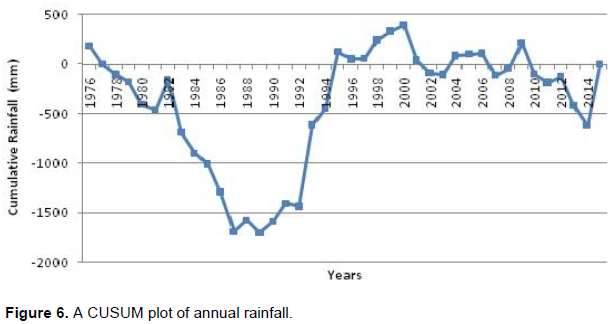
The CUSUM distribution for the annual rainfall is as shown in Figure 6. The cumulative sum reveals runs of
observations greater than the long-term mean with a positive slope and those less than the long-term mean with a negative slope.
An examination of Figure 6 reveals that the 40 years of records can be treated as consisting of two distinct average rainfall periods. The first period from 1976 to 1987 consist in a period of less than average rainfall; the second period, from 1988 to 2000 was a period of above average rainfall followed by a more recent period of slight uncertainty given that subsequent years after 2004 have rainfall fluctuation intermittently above and below the mean. The term average rainfall is used to refer to the 40 years mean. These trends are also apparent in Figure 2, but much more difficult to discern and in Figure 5.
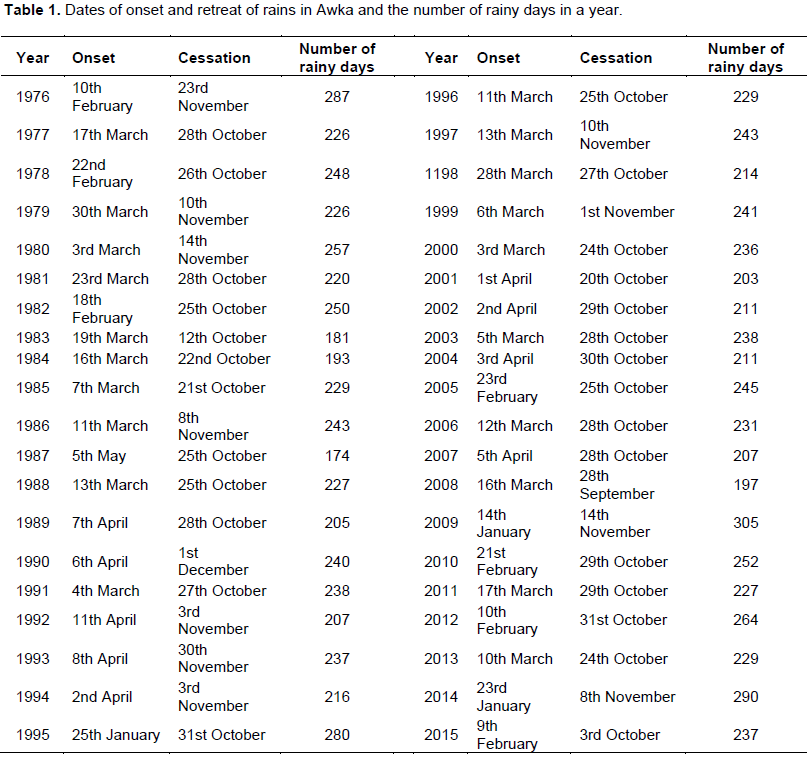
Onset, cessation and rainfall duration
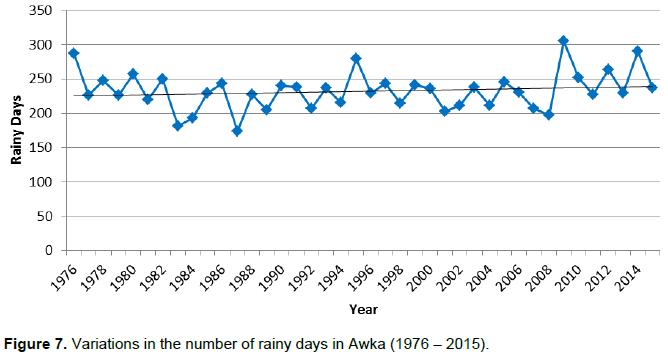
It was evident that onset of rains was predominatntly in the month of March followed by April and February with the number of years for the individual months under the 40 years period being 20, 9 and 7 years, respectively (Table 1). The cessation period was found to be predominantly October followed by November. Thus, rainfall starts in Awka around March/April and terminates in October/November. However, it does appear that periods of onset and cessation of rain are changing with onset of rains occuring more in January and February in the last 10 years and cessation still in October. Similarly, a slight increase in the number of rainy days was observed for Awka, while the relationship between annual rainfall and number of rainy days (Figure 7) was found to yield a positive correlation r = 0.485 (p = 0.05) with coefficient of determination of r2 = 0.24.
Water balance components
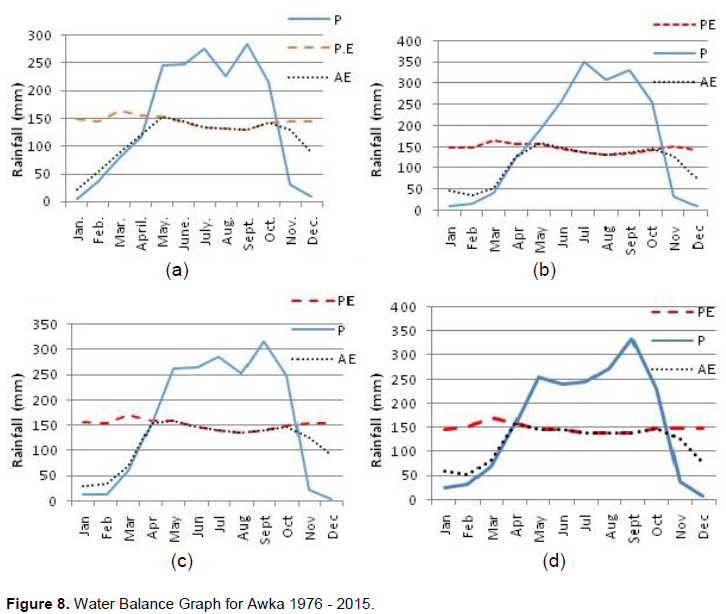
A comparison of the patterns of mean decadal monthl water budget characteristics for Awka as depicted in
Figure 8a, b, c, and d shows some differences. The values of PE estimated for the four decades using Thornthwaite’s formular were used while soil moisture holding capacity of 250 mm was assumed. These were used to provide estimates of monthly and annual values of actual evapotranspiration (AE), water deficit (D) and water surplus (S) for the four decades under consideration.
The relative amount of water surplus vary amongst the four decades. For example, the 1986 to 1995 had the highest value of water surplus of about 599.3 mm followed by the 1996 to 2005 decade for which 522.8 mm of rainfall occuring as surplus was recorded based on estimation of monthly values. This further validates and supports the assertion made earlier that from around 1988s and early 2000s can be categorised as wet period.
The mean water surplus for the four decades (40 year period) is 499 mm. The period of soil moisture utilisation in Awka was found to be from January to April and November to December the first two decades, while this was found to have reduced by one month for the last two. Thus, for 1996 to 2005 and 2006 to 2015, the period of soil moisture utilisation was from January to March and November to December. Similarly, annual values of AE was shown to be on the increase (Table 2 and Figure 8). The highest for AE of 1411 mm was estimated for 2006 to 2015 period. Thus, though the number of months for which AE > P has reduced by one, the mean decadal values of AE for the 40 years period have shown a consistent increase; a stong indication of possible contribution of increasing temperature to increasing evaporation rates (Nzoiwu, 2015) and the possibility of the monthly rates of evapotranspiration becoming more intense.
In the same vein, the period of water deficit (PE > AE) reduced by one month in the last decade, an indication of AE closing in on PE given the available energy and water availability due to increasing rainfall observed for Awka.
Similarly, period of soil moisture recharge before field capacity was discovered to be consistently between May and June for the following periods: 1976 to 1985, 1986 to 1995 and 1996 to 2005, while this was found to be from April to June in the last 10 years following the reduction in the number of months for soil moisture utilization. Water surpluses have been shown to consistently occur from July to October for the whole 40 years period given that the soil reaches its field capacity in July throughout the period in the study area.
The annual rainfall in Awka varies from slightly over 1370 mm to more than 2700 mm for the 40 years period under study. The mean annual rainfall for the period is 1900.5 mm, while the standard deviation and coefficient of deviation are 269.8 mm and 14.2%, respectively. It was observed based on the trend plot for rainfall that this climatic variable is changing. The direction of the trend is positive and is evident that rainfall is rising annually given the slope of the regression coefficient. The trend plot (Figure 2) shows that at the start of the studied period (1976 to 2015), rainfall decline was recorded within the first decade (1976 to 1985) until 1987 after which increasing rainfall was noticeable for Awka. This increase was found to be more pronounced between 1988 and early 2000s. A graph of rainfall anomaly (Figure 4) was also shown to give a clearer picture on rainfall condition in Awka and as such a further confirmation of the assertion on the direction of the rainfall trend. The rainfall anomalies relative to the 1976 to 2015 normal provide evidence to a more recent increase in the rainfall trend which was more from the late 1980s.
CUSUM technique showed a similar picture when used to examine the temporal sequence of rainfall in Awka. The CUSUM distribution for the annual rainfall as shown in figure 6 can be treated as consisting of two distinct average rainfall periods. The first period from 1976 to 1987 consisted of a period of less than average rainfall while the second period 1988 to early 2000s is a period of above average rainfall with some uncertainty up to 2015; a further proof that rainfall condition in Awka is experiencing an upward trend. Therefore, the period lasting from 1988 to early 2000s can be classed as the wettest period given that the highest annual rainfall amount recorded during the 40year period occurred in 1993, while the majority of the years has annual rainfall total above average value. The monthly rainfall characteristics of Awka was determined using the available data and is shown (Figure 5) to be bimodal with the first peak occurring in July followed by a second peak in September after which rainfall maintains a downward trajectory for the remainder of the year.
Onset of rains was found to be predominantly in the month of March/April, while cessation was predominantly October/November. It does appear, however, that the period of Onset of rains is changing with this occurring more in January/February in the last 10 years, while cessation of rains remained almost undeterred. Consequently, a slight increase in the number of rainy days was observed (Figure 6) which could be related to the shift in the onset and cessation dates. A correlation analysis performed, using Pearson Product Moment Correlation, to determine relationship between number of rainy days and annual rainfall yielded a positive correlation, r = 0.485 (p = 0.05). Thus, with increasing number of rainy days, annual rainfall total is expected to increase.
Mean estimated water surplus was calculated and yielded a mean value of 499 mm. The periods 1986 to 1995 and 1996 to 2005 had surplus value above the mean value of 599.3 and 522.8 mm, respectively. This further validates and confirms that 1987 to early 2000s were the wettest period in Awka based on the available 40 year record. The period of soil moisture utilization was found to occur from January to April and November to December from 1976 to 1995, while this was found to have reduced by one month for the last two decades 1996 to 2015 as this now occurs from January to March and November to December. Similarly, values of actual evapotranspiration are shown to be increasing (Table 2). The highest actual evapotranspiration value was estimated for 2006 to 2015 period. This shows that though the number of months during which AE > P has reduced by one, the mean decadal value of actual evapotranspiration maintained a continued increase indicating that the monthly rates of evapotranspiration is becoming more intense attributable to climate variability and change. Also, the period of water deficit was found to have reduced by one month in the last decade, a strong indication that actual evapotranspiration is closing up on the potential evapotranspiration given the availability of moisture. In the same vein, the period of soil moisture recharge before field capacity was found to be consistently May to June from 1975 to 2005 while it was found to have increased by one month as it is now April to June due to a reduction in the number of months for soil moisture utilization.
Moreover, a good knowledge of critical values in the series of various climatic elements such as rainfall and some of their derived parameters is of great importance in detecting variability which has implications for various important sectors, such as agriculture, water supply, flood management etc. Moisture plays a vital role in crop growth and development given that it is the main constituent of plant tissue and a reagent in photo-synthesis. The role of moisture in agricultural production is even more spectacular in the tropics especially Nigeria where high temperature prevail throughout the year and rainfall is highly seasonal in most parts and varies from year to year while the growing season is determined by the availability of moisture to meet crop water requirements (Ayoade, 2008). The state of soil moisture is controlled by rainfall, evaporation rate and soil characteristics (Ayoade, 2008). Thus, from agronomic point of view, the supply of soil moisture may vary from wilting point when no water is available for crop use to field capacity when soil is fully saturated with moisture. These conditions ranging from periods of soil moisture utilization or wilting point to soil moisture recharge, to field capacity and deficit have been determined for Awka as described above. In Ayoade (2008), it is noted that growing season in the tropics is determined by rainfall conditions in relation to evapotranspiration rates which are temperature dependent. Other studies such as Stern and Coe (1982) and Nieuwolt (1982) have confirmed that rainfall is the principal controlling element in agriculture given that in the tropics, rainfall is often the only input that varies markedly from year to year; so the predicted variability in crop index or water balance is due only to the variability in rainfall (Odekunle, 2004). The results of this study, therefore, can find further applications in the determination of the length of the growing season in Awka. Several methods abound as to the determination of growing seasons. These range from those that employ critical threshold values of rainfall to the methods based on rainfall and evapotranspiration data on the grounds that the effectiveness of rainfall for agricultural production in the tropics is determined by the prevailing rates of evapotranspiration. The Walter (1967) method utilized in this paper defined onset and cessation of rainfall in Nigeria in terms of a rainfall threshold of 51mm on a monthly basis and this is used to delimit the beginning and end (and by implication length) of the growing season. Thus, the length of the growing season for Awka has been defined in this paper which has equally shown some level of variations from year to year depending on rainfall variability. Given that a slight increase in the number of rainy days has been reported for Awka, it follows that the length of the growing season has equally increased over time in Awka.
More so, the possible changes in precipitation behavior and the associated water balance and hydroclimatic characteristics without doubt have important consequences on planning and development (Ojo, 1990). As noted, precipitation trends in Awka have shown some slight variations with related changes in water budget components. In most tropical cities, severe hydrometeorological phenomena related to precipitation and water balance have frequently occurred and usually cause great damage leading to loss of lives and property and causing great setbacks in development such as the case of recurring flood episodes in Awka and environs which has been related to climatic parameters as part of the casual factors in Ezenwaji et al. (2013). Other important consequences could range from problems relating to water supply in urban areas due to rapidly increasing water demands to issues of irrigation agriculture given the changing patterns in spatial and temporal rainfall due to climate change. This paper is timely given that the rainfall trend plot for Awka has shone light on the possible feedbacks which may result to more cases of flood. The result has equally shone light on the need for relevant authorities and households in Awka to consider rain water harvesting given that with increase in rainfall trend, the city has an ample supply of rainwater that should not be allowed to waste as flood in some instances with its attendant high magnitude that destroys lives and properties (Ezenwaji et al., 2016).
This paper has attempted to determine the trends in rainfall characteristics and associated water budget components and found that rainfall amounts have continued to increase over 29 years out of the 40 years under study from 1987 to 2015, while the water budget components have equally changed. For agricultural purposes, this paper established that periods of soil moisture utilization and deficit have reduced by a month while period of soil moisture recharge and amounts of water surplus have increased. Also, the length of rainy season or the growing season has been shown to increase due to changes in onset periods in Awka and a positive correlation is seen to exist between the annual rainfall amounts and the number of rainy days in a year. Therefore, given the nature of rainfall trend, the possibility of harnessing rainwater by relevant agencies as well as households is encouraged as this could help satisfy levels of water demand in the Awka urban area. This paper without doubt underscores the importance and usefulness of determining trends in hydroclimatic parameters of a region and associated water balance components given their potential contribution in planning and development (Ojo, 1990). However, important linkages have equally been shown to exist between changes in hydroclimatic parameters and how these changes propagates through changes in the frequency of occurrence of water related problems such as flooding, drought due to changes in periods of soil moisture recharge and utilization and as such should be of concern.
The authors have not declared any conflict of interests.
REFERENCES
|
Abiodun BJ, Salami AT, Tadross M (2011). Climate Change Scenarios for Nigeria: Understanding Biophysical Impacts. Climate Systems Analysis Group, Cape Town, for Building Nigeria's Response to Climate Change (BNRCC) Project. Ibadan, Nigeria: Nigerian Environmental Study/Action Team (NEST).
|
|
|
|
Adefolalu DO (1983). Rainfall patterns in the coastal areas of Nigeria. Nigerian Geographical J. 26:153-170.
|
|
|
|
|
Adejuwon JO, Balogun EE, Adejuwon SA (1990). On the Annual and Seasonal Patterns of Rainfall Fluctuations in Sub-Sahara West Africa. Int. J. Climatol. 10:839-646.
Crossref
|
|
|
|
|
Adejuwon JO (2012). Rainfall Seasonality in the Niger Delta Belt, Nigeria" J. Geogr. Reg. Plann. 5(2):51-60, 18.
|
|
|
|
|
Ayoade JO (1973). Annual rainfall trends and periodicity in Nigeria. Nigerian Geographical J. 16:167-176.
|
|
|
|
|
Ayoade JO (1975). Water Resources and their Developmentin Nigeria. Hydrological Sciences-~Bulletin~des Sci. Hydrologiques, 99:4-12.
|
|
|
|
|
Ayoade JO (1974). A statistical analysis of rainfall over Nigeria. J. Tropical Geography 29:11-23.
|
|
|
|
|
Ayoade JO (1988). Introduction of Climatology for the Tropics. Abiprint and Park limited, Ibadan.
|
|
|
|
|
Ayoade JO (2003). Tropical Hydrology and Water Resources. Ibadan. Agbo Areo Publishers.
|
|
|
|
|
Ayoade JO (2008). Introduction to AgroClimatology. Ibadan. University Press PLC.
|
|
|
|
|
Bardossy A (2001). Statistical Investigation of Precipitation Changes from a Hydrological Viewpoint. In Lozan J, Graßl H. and Hupfer P. (Eds) Climate of the 21ST Century: Changes and Risks. WissenschaftlicheAuswerungen, Hamburg, Germany.
|
|
|
|
|
Blake R, Grimm A, Ichinose T, Horton R, Gaffin S, Jiong S, Bader D, Cecil LD (2011): Urban climate: Processes, trends, and projections. Climate Change and Cities: First Assessment Report of the Urban Climate Change Research Network, C. Rosenzweig, W. D. Solecki, S. A. Hammer, S. Mehrotra, Eds., Cambridge University Press, Cambridge, UK, 43-81.
Crossref
|
|
|
|
|
Crapper PF, Fleming PM, Kalma JD (1996). Prediction of Lake Levels using Water Balance Models". Environ. Software 11(4):251-258.
Crossref
|
|
|
|
|
Ezenwaji EE, Okoye AC, Awopeju AK (2013) The relative contributions of climatic elements and environmental factors to flooding in Awka urban area. Afr. J. Environ. Sci. Technol. 7(8).
|
|
|
|
|
Ezenwaji EE, Phil-Eze PO, Enete IC, Osuiwu BO (2014). An Analysis of the Cycles and Periodicities of Annual Rainfall over Awka Region, Nigeria". Atmospheric and Climate Sciences, 4:665-671.
Crossref
|
|
|
|
|
Ezenwaji EE, Nzoiwu CP, Eduputa BM (2016) Enhancing Urban Water Supply through Rainwater Collection in Enugu Town, Nigeria. J. Geosci. Environ. Prot. 4:82-88.
Crossref
|
|
|
|
|
Ilesanmi OO (1972). An Empirical Formulation of the Onset, Advance, and Retreat of Rainfall in Nigeria. J. Tropical Geography 34:17–24.
|
|
|
|
|
IPCC (2007). Regional climate projections.In Climate Change 2007.The Physical Science Basis. Contribution of Working Group I to the Fourth Assessment Report of the Intergovernmental Panel on Climate Change. Cambridge, UK, New York, US: Cambridge University Press.
|
|
|
|
|
Nieuwolt S (1982). Tropical Climatology: An Introduction to the Climates of the Low Latitudes. John Wiley.
|
|
|
|
|
Nzoiwu PC (2015). An Assessment of the Effects of Climate Variability and Climate Change in Agulu Lake, Anambra State". Unpublished M.Sc. Thesis. The University of Ibadan, Ibadan, Oyo State.
|
|
|
|
|
Obot NI, Emberga TT, Ishola KS (2011). 22 years characterized trends of rainfall in Abeokuta, Nigeria. Res. J. Appl. Sci. 6(4):264-271.
Crossref
|
|
|
|
|
Odekunle TO (2004). Rainfall and Length of the Growing Season in Nigeria. Int. J. Climatology. 24:467-479.
Crossref
|
|
|
|
|
Odjugo PAO (2010b). Regional evidence of climate change in Nigeria. J. Geography and Regional Planning. 3(6):142-150.
|
|
|
|
|
Odjugo PA (2010a). General Overview of Climate Change Impacts in Nigeria. J Hum Ecol. 29(1):47-55.
|
|
|
|
|
Ojo O (1990). Recent Trends in Precipitation and the Water Balance of Tropical Cities: The Example of Lagos, Nigeria. Hydrological Processes and Water Management in Urban Areas (Proceedings of the Duisberg Symposium). IAHS Publ. No. 198.
|
|
|
|
|
Olaniran OJ (1990). Changing patterns of Rain-days in Nigeria. Geo J. 22(1):99-107
Crossref
|
|
|
|
|
Olaniran OJ (1991). Rainfall anomaly patterns in dry and wet years over Nigeria. Int. J. Climatol. 11:177-204.
Crossref
|
|
|
|
|
Olaniran OJ (2002). Rainfall anomalies in Nigeria: The Contemporary Understanding. An Inaugural Lecture delivered on April 25, 2002, University of Ilorin.
|
|
|
|
|
Olaniran OJ (1984). The start and end of the growing season in the Niger River Basin Development Authority Area of Nigeria. Malaysian J. Trop. Geogr. 9:49-58.
|
|
|
|
|
Olaniran OJ (1987). A study of the seasonal variation of rain-days of different categories in nigeria in relations to the miller station types for tropical continents. Theor. Appl. Climatol. 38:198-209
Crossref
|
|
|
|
|
Omagbai, B.E. (2010a). Rain Days and their Predictability in Southwestern Region of Nigeria. J. Hum. Ecol. 31(3):185-195.
|
|
|
|
|
Omagbai BE (2010b). An emirical predictability of seasonal rainfall in Nigeria. J. Hum. Ecol. 32(1):185-195.
|
|
|
|
|
Stern RD, Coe R (1982). The use of rainfall models in agricultural planning. Agric. Meteorol. 26:35-50.
Crossref
|
|
|
|
|
Thornthwaite CW, Mather JR (1955). The Water Balance. Laboratory of Climatology: Centerton, NJ.
|
|
|
|
|
Walter MW (1967). Length of the rainy season in Nigeria". Nigeria Geog. J. 10:127-128.
|
|