ABSTRACT
Urban expansion through identifying most suitable sites for urban sprawl plays vital role in alleviating various socio-economic problems. The objective of this study is to identify potentially suitable sites of Welkite town, Ethiopia. Geographical Information System (GIS) was integrated with remote sensing data to conduct multi criteria overlay analysis by determining principal parameters. DEM data was used to produce elevation and slope map of the study site, whereas, land use and land cover classification was conducted by Landsat 7 image. The influence and weight of each factor was given as, 30% for land use, 25% for elevation, 25% for slope, 10% for ground water and road 10% for accessibility. Rate values for each criteria class were given based on their impact from 9 to 1, higher value for more suitable class value and lower values for unsuitable class values. Finally by employing multi criteria overlay analysis, suitability map of Welkite town was generated. As a result about 1750 hectar of land was founded from highly suitable to moderately suitable for urban sprawl which is located North-eastern parts of Welkite whereas, only southern part of the town exhibits from slightly suitable to unsuitable for further expansion with an area of 1039ha. Hence, decision makers and urban planners of the town are highly recommended to adjust their master plan and sprawl of Welkite town to its north -eastern part based on the identified suitability result of this study.
Key words: GIS, remote sensing, land suitability.
Nowadays both horizontal and vertical urban growth have vital role in socio-economic aspects of a given town in particular and a nation in general. This is particularly true for developing countries like Ethiopia where a number of urban centers are increasing with time (Anwar and Bhalli, 2012). In Ethiopia it is clear that, the rate of urbanization is increasing in an alarming rate especially in the past decade. The reasons for this rapid urbanization center on population growth, rural-urban migration, improvement in the standard of living, unemployment in rural areas and others. In the absence of proper urban management practice, uncontrolled and rapid increase in population pose enormous challenges to governments in providing adequate shelter to people in urban areas. This prompt increase of urban population and the transforming urban economy lead to an ever-increasing load on the urban environment in terms of urban capture structure of the cities, creating many problems, such as unplanned sprawl, inadequate housing facilities, traffic congestion, insufficient drainage, sewerage facilities and lack of other amenities (Liu, 1998).
Land suitability mapping and analysis is a prerequisite to achieve optimum utilization of the available land which is becoming increasingly scarce resources (Ayalew and Selassie, 2015). Hence, suitability analysis for urban growth is considered one of the most important and effective techniques for identifying the best locations for urban growth by employing different types of criteria and weights (Javadian, et al., 2011; Alexander et al., 2012). It involves the selection of suitable locations of development by mapping the suitability index of a specific area (Joerin et al., 2001). Moreover, land use suitability analysis for urban development is necessary to overcome the problem with limited land availability against astronomical growth of urbanization.
Though, geographic information system integrated with remote sensing techniques is a powerful tool for determining suitable sites for ever increasing urbanization. Geographic Information System help users to view, understand, question, interpret and visualize spatial and non-spatial data in many ways that reveals relationships, patterns and trends in the form of maps, reports and charts (Babu and Sivasankar, 2015).
The GIS based maps provide the most important sources for spatial analysis. Remote sensing data provide temporal and spatial accurate maps, when used in the GIS environment, and they are integrated. Also, the attribute data attached in the database provide great help to the urban planners and decision makers (Hauser et al., 1982). GIS-based land suitability analysis using the multi-criteria evaluation (MCE) approach is therefore the most suitable method for solving complex problems related to land-use planning and development (Malczewski, 2004).
In Ethiopia, the construction of settlement over time has witnessed unplanned and uncontrolled sprawl such that the urbanization process in most town reveal largely illegal growth pattern, without identifying potential suitable lands for urbanization. In the same way, the trend of urbanization in Welkite town exhibited unplanned and uncontrolled way deprived of considering potential suitable sites. This tendency creates a problem for urban planning in an efficient way and various land use conflicts between users each other and with the government to supply land for urban dwellers. The reason for this problem might be many and complex but one might be less attention was given to suitability identification. But, the future success of economic growth policies depends on a lot on the infrastructural planning and development through identifying the most suitable sites for urbanization. It is universally established that remote sensing and GIS tools play a major role in various infrastructure planning and development as well. Several decisions taken by different planning agencies require spatial analysis of maps involving many parameters (Shan, 1999; Liu, 1998).
Hence, identifying most suitable sites enables urban planners to plan their urban expansion and infrastructural development to most suitable sites, decision makers to plan other development plans like investment on areas outside the residential areas and to attract investors by identifying potential areas. To this edge, this study tries to identify potential suitable sites for further expansion of Welkite town using multi-criteria evaluation techniques by employing GIS and remote sensing techniques together.
Objectives
The general objective of this study is to identify and map potentially suitable areas for further expansion of Welkite town whereas, the specific objectives meet by this research are; to employ land use/cover map of Welkite town from remotely sensed data; to determine important parameters for urban suitability analysis and to classify Welkite town based on different suitability classes.
Description of the study area
Location
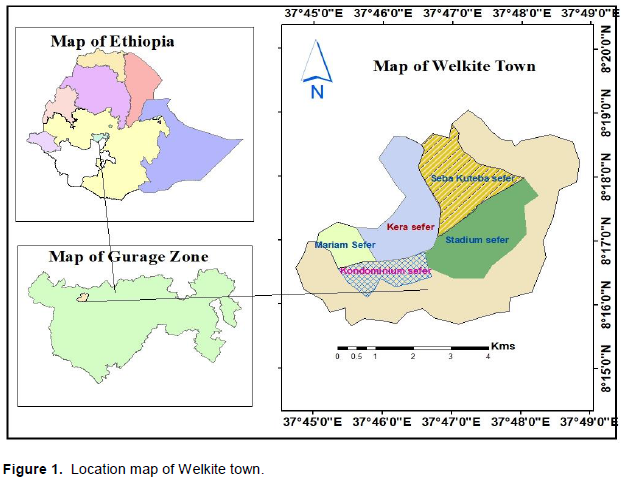
Welkite is a town and the administrative center of the Gurage Zone for the Southern Nations, Nationalities and Peoples' Region (SNNPR), of Ethiopia. Geographically Welkite town lies 37° 44ʹ35" E to 37°48ʹ45” E and 8°15ʹ50"N to 8° 20ʹ 00" N. The town is located on the main road from Addis Ababa to Jimma with a distance of 148 km from the country capital Addis Ababa. This town lies in a latitude and longitude of 8°17′N 37°47′E and an elevation between 1718 and 1909 m above sea level. It is surrounded by Kebena woreda (Figure 1).
Infrastructural development
According to the Gurage Zone Administrative government, Welkite is one of the 12 towns with electrical power, one of 11 towns with telephone service and one of the nine towns that have postal service. Welkite also had a bank branch and other financial institutions, as well as an all-weather road was built in 1963 which connects Welkite to Addis Ababa.
Economic activity
Since the town is in the midway on the road between Addis and Jima, trade is the major economic activity employed in the town, which most passengers who passes through the town use it as a transit and involved in various transactions. Hence, the residents of the town are primarily depend on retail and whole sale trade.
Demographic characteristics
Based on the Central Statistical Agency (2007) report, this town has a total population of 28,866, of whom 15,074 are men and 13,792 women. The plurality of the inhabitants practiced Ethiopian Orthodox Christianity, with 48.17% of the population reporting that belief, while 42.31% were Muslim, 7.86% were Protestants, and 1.34% were Catholic.
Data sources and method of collection
The most important thing in doing a GIS research is source of data. Reliable data is necessary to realize the designed purpose and objectives. This research used both primary and secondary data’s which are collected from different sources. Secondary data such as, Shapfile GIS data’s and others were collected from different Ethio-GIS. Landsat-7 satellite image with spatial resolution of 30 m from row 169 and path 54 was freely downloaded from United States Geological Survey www.earthexplorer.usges.gov. also SRTM with cell size of 30*30 m data was also freely downloaded from www.gisgeography.com/srtm-shuttle-radar-topography-mission/. In addition to these data’s observation and reconnaissance survey of the area through transect walk was conducted to recognize the biophysical components of the land. It was conducted to characterize each parameters such as land use/cover, slope, topography, road access and water point further enabled to determine the weighted values and scores based on their significance.
Data analysis
The town under study was clipped from Ethio-GIS shape file by using Arc map tools to delineate the boundary of Welkite town. Then important thematic layers for suitability analysis was created such as, land use/class map, elevation, slope, road network and water sources and weighed values were assigned based on their relevance. The procedures followed during the production of these thematic layers are clearly depicted as follows.
Land use/ cover and land cover classification
Digital image classification is the process of sorting pixels into a finite number of individual classes or thematic layers based on their reflectance values. Firstly image preprocessing methods such as image correction and enhancement techniques were employed to increase the transparency of image data. Supervised image classifications technique were applied after, assigning (creating) the signature editor, a maximum likelihood parameter was also used. Finally, the different land use/land cover classes were classified and maps were analyzed using ERDAS IMAGINE 2010 and ArcGIS 10.3.1 software.
Other parameters
Additional parameters for suitability analysis such as elevation map and slope was generated from a 30 m DEM, road map and water sources was extracted from Ethio-GIS shapefile by using ArcGIS 10.3.1 software for further suitability analysis.
Weighted overlay suitability model
Weighted overlay Suitability Model was used with GIS techniques for locations suitable for urban expansion. Each individual raster cell was reclassified into units of suitability and multiplied by a weight to assign relative importance to each and finally add them together for the final weight to obtain a suitability value for every location on the map; this can be interpreted by the following equation (Eastman, 2006):
Where, SL is Land slope; LE is land elevation; LU is land uses; DR is the distance to Road; DG is the distance to ground water potential areas. The subscript letter “f” represents the weight of each factor, while “c” represents the weight of each class of the individual factor.
Therefore, Suitable sites for expansion of Welkite town was estimated using the above equation for each pixel in the final integration layer and was regrouped into different classes with equal class interval to divide the entire study area into different suitable zones.
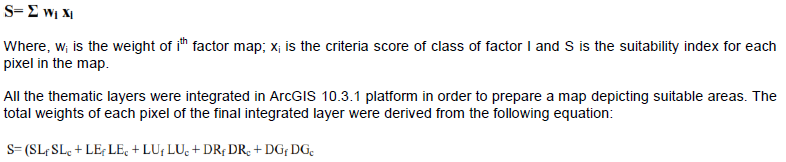
Land use/cover classes
The major land use/land cover classes of the study town which was identified by supervised image classification during the year 2018 were forest land, cultivated land, open bush and shrub land, built up, and bare/open land as indicated in the Table 2 and Figure 2.
The area coverage of each class is depicted in Table 1.
Land elevation
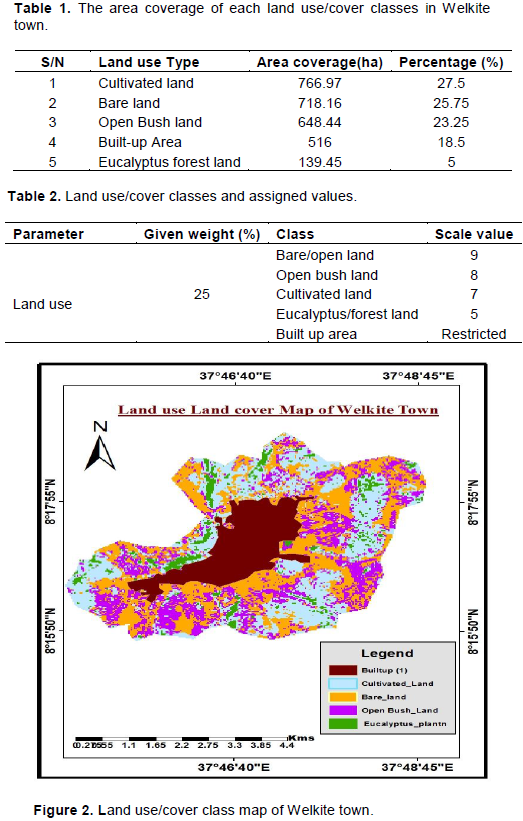
The elevation of the study town was generated from a 30 m resolution DEM and ranges from 1718 to 1909 m above sea level as depicted in Figure 3.
Since the vertical elevation difference with in the town is about 191 m and the highest elevation is below 2000 m above sea level, all elevation classes were considered as suited for urbanization, but their scale values were assigned (highest value for lower elevation and lowest value for higher elevation classes) as indicated in the Table 3. The reason that high elevation slopes is given lower scale value is that, as the elevation increases, suitability for constructing infrastructures decreases, availability of ground water decreases and finally its suitability for urbanization will decrease.
The land slope
The slope map of the study town was also produced from a 30m resolution DEM using arc hydro tools, and the slope values ranges from the minimum 0% to the maximum 47.9% as shown in the Figure 4. Most northern and eastern as well as south-western part of the town has a minimum slope value which is less than 10%, but only the central and north –western part of the town have highest slope values in between 15-30% values. This implies of that most parts of the town are with level topography.
In this study, slope areas with slope values greater than 20% are considered as unsuitable for house and other infrastructural construction, consequently unsuitable for urbanization and their values are restricted whereas areas with low slope value given highest scale values (as shown in the Table 4), because as slope decreases the land is level and there will be ease of construction of buildings, infrastructures, ease of transportation etc. as a result the suitability of a given land for urbanization increases.
The ground water source
Source of water for drinking as well as other domestic activities is vital for the given town dweller. Hence, in this study, the proximity of wells to expansion areas is considered as an advantage because wells will be used as a source for water. Areas lying close to the wells are considered the best suited and are assigned a higher class value as indicated in the Table 5.
Distance from main roads
Road plays a vital role in every daily social, economic and political issues in the inhabitants of a given town. In this study, the distances of each places from the main nearby road was calculated and those places with lower distance were considered to be suitable for urban expansion and assigned higher class values, as well as those places with higher distances were considered as less suited for urban expansion and assigned lower class values as portrayed in the Table 6.
Suitability analysis for urban expansion
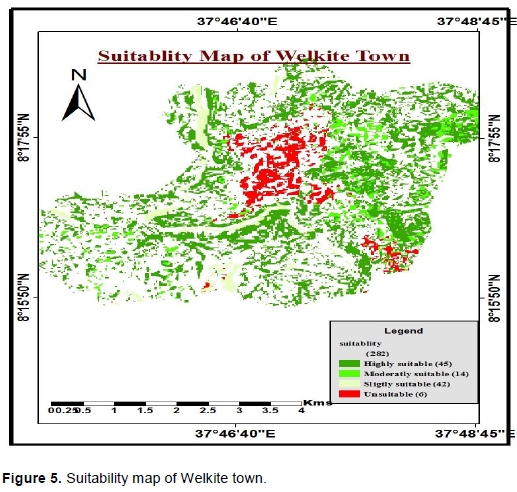
After determining prominent parameters, urban suitability analysis was done by using weighted overlay technique through multi-criteria evaluation. Integrated GIS based method for site selection can advocate technically selecting land for sustainable urban development. The advance Analytical Hierarchy Process method is selected to assign the weightages for thematic layers and weighted overlay method is used for integration. An integrated layer was generated from highly suitable, moderately suitable, slightly suitable and unsuitable land based on the provided weights for each parameter. Finally, suitability class was extracted from integrated layer as depicted in the Figure 5.
The results of this suitability analysis showed that most North-eastern parts of Welkite town are from highly to moderately suitable lands and covers an area about 1750 hectares whereas, only southern part of the town is slightly suitable to unsuitable for further expansion due to various reasons.
Generally as clearly depicted in Figure 5, places represented with deep green color are identified as highly suitable for urban sprawl which possess an area of 780 ha, and spatially located in the northern and eastern part of the town. In addition, those places represented by light green color are identified as moderately suitable for urban sprawl which possess an area of 390 ha of land and those places represented by gray color are identified as slightly suitable for urban sprawl, possess an area of 580 ha of land. Even though, level of suitability varied, all these classes of suitability area are considered as good for urban sprawl from the total of 2789 ha of land whereas the remaining part which was indicated by red color on identified as unsuitable for urban sprawl with an area of 1039 ha of land.
The possible reasons are, those parts of the town which was identified as suitable areas, possess lower elevation values, flat topographic nature, accessible to road, water point and with lower slope class values while most unsuitable areas exhibited higher elevation values, undulating topography, and higher slope classes. Similarly, the study of Åžatir (2016), found that, the weights of slope and topography were the most significant factors for urban sprawl.
CONCLUSION AND RECOMMENDATION
Generally this study identifies suitable sites for further sprawl of Welkte town by applying multi criteria overlay analysis using determinant parameters as impute factors. Each selected parameter was considered as a significant impact during the expansion of the town. On the study GIS integrated with remote sensing was identified as a power full tool for conducting suitability analysis. Hence, the research found that most North-eastern parts of the study town was highly suitable for further expansion. Using this result decision makers and urbane planners area highly recommended to prepare their urban sprawl master plan based on suitability result found in this study, for holistic development of the own. But inured to make the expansion of the town in both directions concerned body should do some site treatment mechanism. Additionally it is also warmly recommended that further researches should be conducted by including more parameters in addition to the parameters which were applied in this research to get more truthful urban sprawl suitability result.
The author has not declared any conflict of interests.
REFERENCES
|
Alexander KW, Benjamin M, Grephas OP (2012). Urban land use suitability assessment using geoformation techniques for Kisumu municipality in Kenya. International Journal of Research and Reviews in Applied Sciences 13(2):522-530.
|
|
|
|
Anwar M, Bhalli M (2012). Urban population growth monitoring and land use classification by using GIS and Remote Sensing techniques: A case study of Faisalabad city. Asian Journal of Social Sciences and Humanities 1(1):5-13.
|
|
|
|
|
Ayalew G, Selassie YG (2015). Evaluation of land suitability for cash and perennial cops using geographical information system in east Amhara region, Ethiopia. International Journal of Remote Sensing and GIS 4(1):1-7.
|
|
|
|
|
Babu SS, Sivasankar S (2015). GIS and remote sensing in urban waste disposal and management: A case study of Usilampatti municipality, India. International Journal of Applied Research 1(9):1047-1051.
|
|
|
|
|
Central Statistical Agency (CSA) (2007). National Population Census of Ethiopia. Available at :
View
|
|
|
|
|
Eastman JR (2006). IDRISI Andes guide to GIS and image processing. Clark University, Worcester P 328.
|
|
|
|
|
Hauser PN, Gardener RW, Laquian AA, Shakhs P (1982). Population and the Urban Future.
|
|
|
|
|
Javadian M, Shamskooshki H, Momeni M (2011). Application of sustainable urban development in environmental suitability analysis of educational land use by using AHP and GIS in Tehran. Procedia Engineering 21:72-80.
Crossref
|
|
|
|
|
Joerin F, Thériault M, Musy A (2001). Using GIS and outranking multicriteria analysis for land-use suitability assessment. International Journal of Geographical Information Science 15(2):153-174.
Crossref
|
|
|
|
|
Liu Y (1998). Visualizing the urban development of Sydney (1971-1996) in GIS. In Proceedings of the 10th Annual Colloquium of the Spatial Infonnation Research Centre. Dunedin: The University of Otago pp. 189-198.
|
|
|
|
|
Malczewski J (2004). GIS-based land-use suitability analysis: a critical overview. Progress in Planning 62(1):3-65.
Crossref
|
|
|
|
|
Åžatir O (2016). Mapping the Land-Use Suitability for Urban Sprawl Using Remote Sensing and GIS under Different Scenarios. InTech: Horwich, UK pp. 205-226.
Crossref
|
|
|
|
|
Shan Z (1999). Remote sensing and GIS as a tool in exploring the dynamics of urban spatial structure: The case study of Shanghai city. In Proceedings of the 20th Asian Conference on Remote Sensing was held on November pp. 22-25.
|
|