Full Length Research Paper

ABSTRACT
Variability in soil properties is a critical element across wide areas of researches especially in several aspects of agriculture and environment. The objective of this study was to examine the spatial variability of soil properties and factors contributing to the general pattern of variability in Akoko Region. Observations were carried out largely from sampling points and twenty soil samples were collected for laboratory analysis to determine the particle size fraction, soil pH, organic matter content, exchangeable potassium, calcium, magnesium, sodium, cation exchangeable capacity (CEC). The data were subjected to descriptive and factor analysis. The coefficient of variation ranged from 6.85 to 127%. The factor analysis revealed that the variability of the soil properties is mainly due to textural characteristics, chemical properties and organic matter.
Key words: Factor, analysis, spatial variation, soil properties.
INTRODUCTION
Soils are characterized by high spatial variation. Spatial variability of soil can result from a natural variability of soil properties as well as from human activity. This high variation makes it difficult to select properties to characterize and classify the soil. The effect of soil characteristics on erosion makes it desirable to determine the spatial variability of its physical and chemical properties. Variability in soil properties has been studied by many researchers (Akpokodje et al., 1986; Nwajide and Hogue, 1979; Hu et al., 2008; She and Shao, 2009; Ofomata, 1988, Olorunlana, 2014). The commonest techniques used in analyzing soil variability are the descriptive statistics in terms of mean, standard deviation, range and coefficient of variation. Though these techniques were able to show the overall variability and also revealed some useful variability pattern of the soil properties, they do not account for the source of variability in the soil properties. The introduction of factor analysis technique as one of the statistical techniques will reveal factors contributing to the soil variability (Adebayo, 1997). Arp (1984) suggested factor analysis as one of the statistical techniques that could reveal the factors contributing to the overall pattern of variability. The use of factor analysis facilitates reduction of large number of correlated variables to uncorrelated factors that are linear functions of the original variables. Each factor is responsible for the correlation among the group of soil properties that comprised it. The objective of this paper is to highlight the variability of physio-chemical properties of soil and to find the specific factors contributing to the overall pattern of soil variability.
MATERIALS AND METHODS
Study area
Akoko region is located north-east of Ondo State and South-West of Nigeria. The region lies within longitude 5031' E to 6006'E and latitude 7018'N to 7045'N. Akoko region covers an aerial extent of about 2465.6km2. Akoko region is situated at an altitude between 270m and 2750m above sea level. Most parts of the region have undulating terrain, which in many cases are almost completely encircled by high rugged rock outcrops, rising to a height of over 2750 m in some places.
Geologically, Akoko Region is a physiographic region characterized by two major crystalline basement rocks of the main African Precambrian shield. These are magmatite and granite gnesis, with quartz and pegmatite veins. These rocks belong to the migmatite-gnesis sub-classification of the basement complex of Nigeria. Akoko Region is located within the humid tropical climate of the forest region, which experiences two climatic seasons namely the rainy season (April – October) and the dry season (November – March).
Laboratory analysis
The soil samples were taken to the laboratory, air-dried, crushed and sieved using a 2mm-sized sieve mesh. Particle size analysis was carried out by Bouyoucos (1962) hydrometer method. Organic matter content was determined by multiplying the value of soil organic carbon by Van Barnmelen factor of 1724. The soil pH was determined in water (1:1 soil to water ratio) and in potassium chloride (1:1 soil to solution ratio) using a pH probe. Sodium and potassium in the filtered extracts were determined in a flame photometer while calcium and magnesium were determined using the Perkin Elemer 5010 atomic absorption spectrophometer. Cation exchangeable capacity was determined by the summation of exchangeable bases and acidity as described in Thomas (1982).
Statistical analysis
Descriptive statistics
The soil properties were analyzed using descriptive statistics. The mean was used to determine the average distribution of the variables. Other descriptive statistics that were used included the standard deviation which shows how the variable deviates from the mean and the coefficient of variation that shows the percentage of variation of the standard deviation from the mean.
Principal component analysis
Factor analysis was also used to group the ten (10) soil properties
into statistical factors. Principal component analysis was used as the method of factor extraction because it does not require prior estimates of the amount of variation in each of the soil properties explained by the factors. Factor (principal component) analysis was performed on standardized variables using correlation matrix (Table 2) to eliminate the effect of different measurement units on the determination of factor loadings.
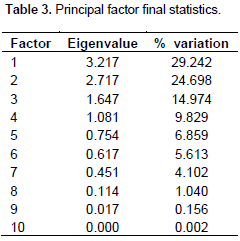
Factor loadings are the simple correlation between properties and each factor. Eigenvalues are the amount of variance explained by each factor. Factors with eigenvalues > 1 explained more total variation in the data than individual soil properties, and factors with eigenvalues < 1 explained less total variation than individual soil properties. Therefore, only factors with eigenvalues > 1 were retained for interpretation.
RESULTS AND DISCUSSION
Variation of soil properties
The statistical summary showing the mean, standard deviation and coefficient of variation for all the measured properties are presented in Table 1. There was spatial variability in soil properties manifested through the high coefficient of variation values. One may infer that the variations arose from complex interactions between topography, climate as well as soil use. Diversities in these factors regularly cause redistribution of soil particles from one location to the other through erosion and deposition processes. In order to compare the variability of the soil properties among themselves across the study area, the coefficient of variation was used and the result was further categorized into four classes in a modified version after Aweto (1982). Less than 20% CV is regarded as low variability; between 21 and 50% CV is regarded as moderate variability while between 51 and 100% CV is regarded as high variability. Any CV above 100% is regarded as very high variability.
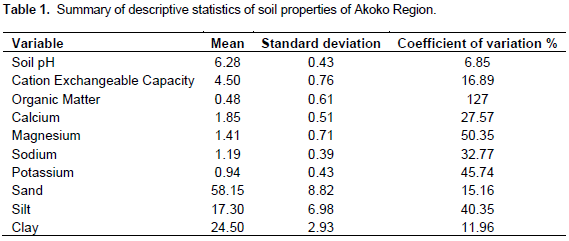
The soil properties across the study showed considerable variation for each element. The Cation Exchangeable Capacity and soil pH have low CV of 16.89 and 6.87% respectively while soil calcium, sodium and potassium varied moderately at 27.57, 32.77 and 45.74% respectively. High CV was recorded for magnesium (50.35%) and very high CV for organic matter (127%). The very high variation of organic matter arose from the vegetative cover of the area which reduces the impact of rainfall on the earth surface.
Sand and clay exhibited low level of variation of 15.16 and 11.96% respectively while silt proportion is moderately variable with CV of 40.35%
Factor analysis of the soil properties
Before the factor analysis, the initial correlation matrix was generated among the soil properties (Table 2).
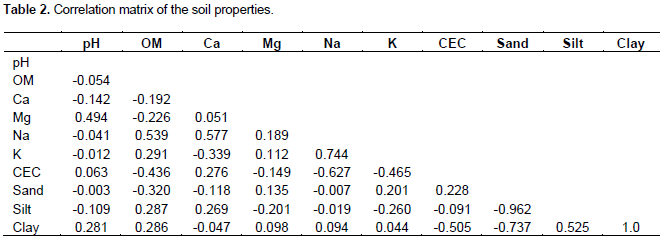
The factor analysis approach enables an understanding of the type and extent of relationships between the soil properties. The Eigen value structure of the soil properties are shown in Table 3. In line with Kaiser (1974) suggestion, only the factors with Eigen values greater than unity were retained. This implies that only the first four factors in the table were retained. These four factors accounted for over 78% of the total variance in the sample. In order to obtain a clear and consistent pattern of variation, the four factors extracted were rotated using the varimax method.
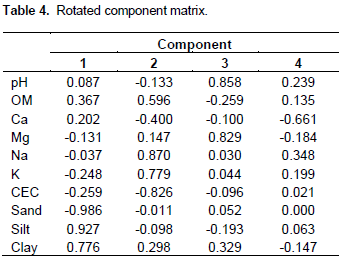
The loadings on each of the rotated factors are shown in Table 4. The first factor exhibited high negative loading on sand and high positive loadings on silt, clay and organic matter. This factor reflects textural characteristics. The second factor shows high positive loading on sodium, potassium and organic matter. This factor is considered chemical properties since sodium, potassium and organic matter correlated positively. The third factor contains high negative loading on organic matter and high positive loading on soil pH and magnesium. The fourth factor loaded positively high on sodium and soil pH. With the rotated factor solution discussed above, the distinctive role of the different soil properties in soil spatial variability was clearly revealed.
CONCLUSION
Spatial variation of soil properties in Akoko Region had been examined. There was spatial variability in soil properties manifested through the high coefficient of variation values. One may infer that the variations arose from complex interactions between topography, climate as well as soil use. Diversities in these factors regularly cause redistribution of soil particles from one location to the other through erosion and deposition processes. With the rotated factor solution discussed above, the distinctive role of the different soil properties in soil spatial variability was clearly revealed. Thus, the spatial variability of the soil properties in this area appears to derive mainly from the organic matter, chemical properties and textural characteristics. This implies that the most useful factors that would be considered in a detailed survey and control of erosion in the area would be organic matter, chemical properties and textural characteristics of the soil.
CONFLICT OF INTERESTS
The author has not declared any conflict of interest.
REFERENCES
|
Adebayo AA (1997). Factor analysis of forest floor variability in savanna woodland of Southwestern Nigeria. Glob. J Pure Appl. Sci. 3:255-263. |
|
|
|
|
|
Akpokodje EG, Olorunfemi BN, Etu- Efeotor JO (1986). Geotechnical Properties of soils susceptible to erosion in southeastern Nigeria. Nigeria J Appl. Sci. 31:81-95. |
|
|
|
|
|
Aweto AO (1982). Variability of Upper Slope soils developed on sandstones in Southwestern Nigeria. Nigeria Geogr. J. 25(1, 2):27-37. |
|
|
|
|
|
Bouyoucus G (1962). Hydrometer Method, Improved for Making Particle Size Analysis of Soils. Agrono. J 54: 464- 465. |
|
|
|
|
|
Hu W, Shao MA, Wang QJ, Reichardt K (2008). Soil water content temporal-spatial variability of the surface layer of a Loess Plateau hillside in China. Sci. Agric. 65:227-289 |
|
|
|
|
|
Nwajide CS, Hoque M (1979). Gullying process in Southeastern Nigeria. Nigerian Field 2(44):64-74. |
|
|
|
|
|
Ofomata GEK (1988). The Management of soil erosion problems in southeastern Nigeria. Proc. International Symposium on Erosion in S.E. Nigeria. |
|
|
|
|
|
Olorunlana FA (2014). Variability of Soil Chemical Properties at Different Sol Depths in Akoko Region of Ondo State. The Social and Management Scientists, 7(1):80-85 |
|
|
|
|
|
She DL, Shao MA (2009). Spatial Variability of soil organic C and total N in a small catchment of the Loess Plateau, China, Acta Agric. Scand. B- S.P., 59: 514-524. |
|
|
|
|
|
Thomas GW (1982). Exchangeable cations. In: A.L. Page et al. (2nd Edn.) methods of soil analysis,Agronomical Monographs. 9. ASA and SSSA, Madison, WI. pp.159–164. |
|
Copyright © 2024 Author(s) retain the copyright of this article.
This article is published under the terms of the Creative Commons Attribution License 4.0


