ABSTRACT
Geothermal power is one of the safest and environment friendly energy worldwide. It has been harvested in Kenya since 1956 with most potential sites being along the Rift Valley. There are surface manifestations such as hot springs and mudpools that are visible. Different methods of exploration are usually applied, including geophysical, geochemical and geological methods. This paper highlights different geothermal exploration techniques with emphasis on low cost methods that can be used in developing countries to map geothermal potential areas highlighting methods used in Kenya. A comparable cost analysis is done for Olkaria field in Kenya which has been explored using different methodologies and the results show that ground survey methods are more expensive than remote sensing though the two methods have unique advantages. Ground data collection method is three times expensive as compared to the remote sensing methodology. It also reviews the geothermal indicators that can be mapped by remote sensing techniques, and especially those using satellite imagery.
Key words: Geothermal indicators, exploration, geographical information systems (GIS), remote sensing.
Energy usage worldwide is increasing and use of alternatives such as geothermal energy is set to increase, since the world has only a finite supply of fossil fuels (Bertani, 2015; GEA, 2012).
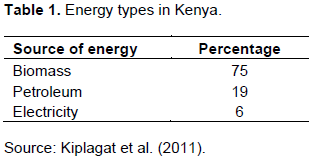
Geothermal power is one of the safest and environment friendly energy harvested in Kenya since 1956 (Omenda, 1998). Although Kenya has substantial renewable energy resources such as hydropower, solar, geothermal and wind, only about 18% households in Kenya are connected to the national electricity grid, and over 60% (Table 1) of the energy consumption is based on non-commercial biomass (Gloporis, 2012; Kiruja, 2011; Kiplagat et al., 2011).
According to GEA 2012, global geothermal industry has sustained a growth rate of 5% since 2012 and is projected to reach 2765 MW by 2020. Kenya and Ethiopia are endowed with significant geothermal resources as part of the East African Rift System (Pürschel et al., 2013). The main source of electricity in Kenya is hydroelectric power but due to climate change with prolonged dry spells in Kenya water has reduced in the rivers and dams such that the proportion of hydroelectric power is expected to fall to 20% by 2022 thus the country shifting focus to increasing wind and geothermal energy by 45% according to Gil-Alana et al., 2017.
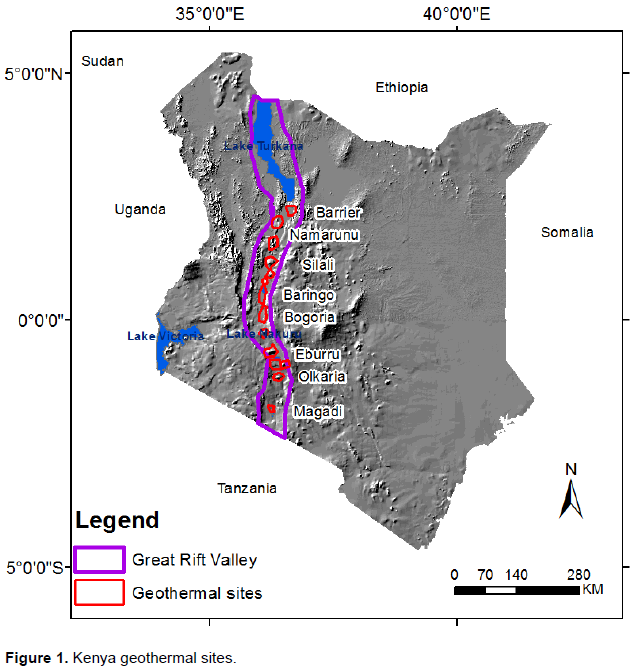
Kenya is one of the leading countries globally with significant geothermal resources with rich geothermal potential sites being along the Rift Valley (Figure1), and a few outside the rift (Mibei, 2012). According to geothermal power generation report, Kenya has installed capacity of 700 MW against total potential of about 10,000 MW with Olkaria geothermal field being the largest producing site (Omenda and Simiyu, 2015). The Olkaria geothermal field is inside a major volcanic complex associated with Quaternary volcanism. The field is a high-temperature geothermal system located within the Kenya Rift Valley with numerous volcanic domes (Omenda, 1998). Geothermal energy in Kenya has been used for direct use and in direct use (Figure 1).
With the ever-increasing demand for energy in the country there is need for exploration of cost effective ways of locating geothermal potential areas. The Kenyan Government has recognized geothermal energy as important source of electricity and has supported the Kenya Electricity Generating Company (KenGen) accounting for about 75% of the total installed capacity (Othieno and Awange, 2016; Kiplagat et al.,2011).
One of the main challenges associated with geothermal harvest is the large upfront cost of geothermal exploration and development in addition to high risks associated with resource exploration (Omenda, 2012). This study aims to;
(1) Summarize geothermal indicators in Kenya section 2 and 3
(2) Review methodologies of delivery of the indicators and
(3) Show how geographical information systems (GIS) and remote sensing (RS) has been used in exploration of geothermal energy by reducing the cost of exploration. One of the objectives of this study is to show which indicators could be mapped using GIS and RS clarifying on the strengths and limitations.
Physical geothermal manifestations
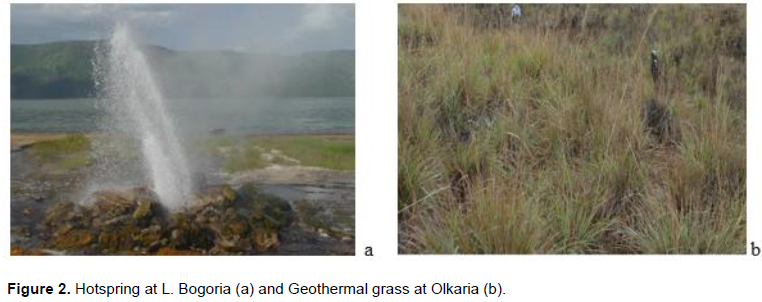
Geothermal energy manifests itself on the surface as hot-springs (Figure 2a and b), boiling springs steam jets, geysers, mudpools, seeps altered grounds, sulphur deposit, silica sinters, travertine, geothermal grass, young lava flows caldera and fumaroles along the Kenyan Rift after which geophysics, geochemistry and geological exploration methods are used for citing the wells for drilling (Njue, 2012).
The rift valley is a volcanic area and surface manifestations features stimulate exploration. Fluids and gases leak to the surface along faults and fissures or through permeable rock, which are a clear indication of existing geothermal reservoir in the ground. These manifestations may overlie a geothermal system while some may discharge after flowing some distance down gradient from a hydrothermal area (Muhagaze, 1984).
According to White and Williams (1975), low temperature systems have <90°C, intermediate temperature systems 90 to 150°C and high temperature systems range from 150 to 240°C. Kenya has high temperature prospects located within the Kenya Rift Valley (Omenda and Simiyu, 2015).
Renner (1975) defines the salinity of hot water systems as ranging between 0.1 and 3%. Vapor dominated reservoirs are good geothermal resources and occur where there is very high heat flow but low water recharge. Near-surface gases leach rocks in the spring area as they condense to form acids. According to Fournier and Rowe (1966), siliceous sinter deposits are indicators of the presence of hydrothermal reservoirs with temperatures higher than 175°C.
Geophysical methods
Geophysical measurements in geothermal involve measuring various parameters connected to geological structure and properties of geothermal systems with the aim of detecting and delineating geothermal resource as well as locating exploitable reservoirs and the siting of drill-holes through which hot fluids at depth can be detected (Mariita, 2010; Hersir and Bjornsson,1991). Parameters that characterize geothermal systems are
(1) High temperature
(2) High porosity
(3) High permeability
(4) Pressure and
(5) Chemical composition of the fluid (Wanjohi, 2012).
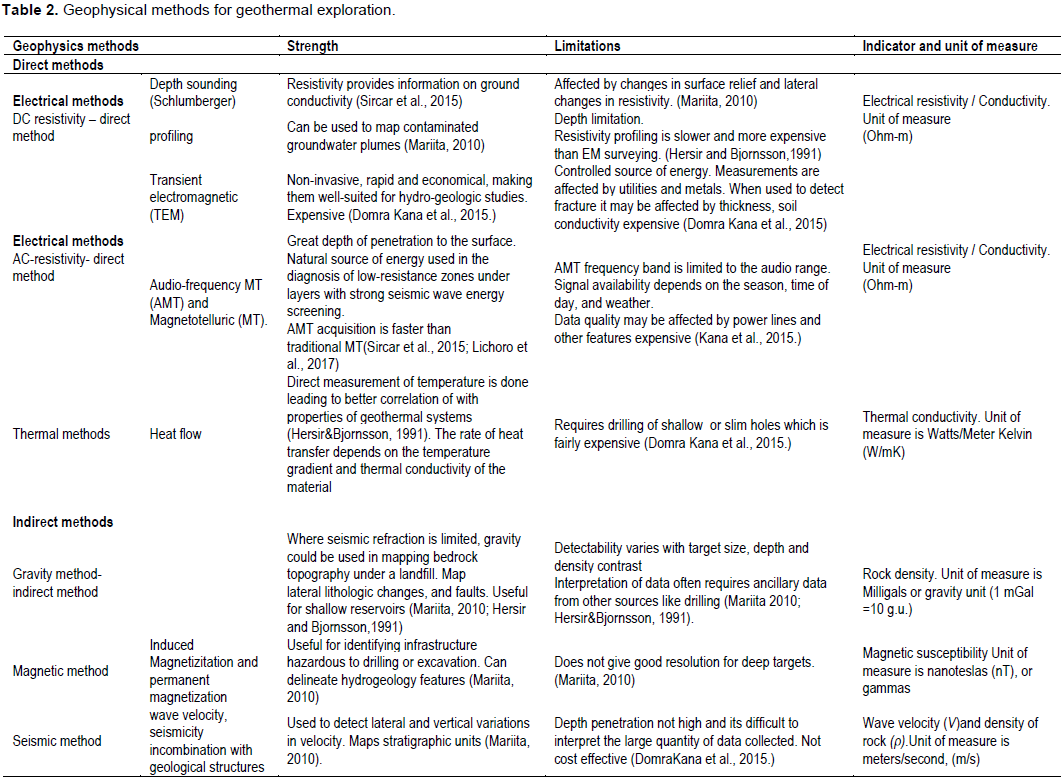
Aretouyap et al. (2016) has discussed various geophysical methods used in Africa highlighting their strength and limitations. Direct methods measure parameters that are directly influenced by geothermal activity while indirect method explores the physical parameters of the host rock. Some of the geophysical methods (Table 2) include;
(1) Thermal methods
(2) Electrical methods
(3) Gravity method
(4) Magnetic method and seismic methods (Domra Kana, 2015).
Table 2 summarises the various geophysical methods employed in geothermal exploration. In their review paper, Domra-Kana et al. (2015) have summarised the geophysical methods of geothermal exploration as being very useful in detecting geothermal anomalies. They rank the thermal and electrical methods as the best in comparison to seismic, magnetic and gravimetric, though a combination of different methods is recommended. However, they note that all geophysical methods are expensive but powerful tools in geothermal exploration. Detailed discussions on geophysical methods for geothermal exploration have been done by Aretouyap et al. (2016), Domra Kana et al. (2015), Wanjohi (2012), Mariita (2010), Hersir and Bjornsson (1991), and Abiye and Tigistu (2008).
Geochemical methods
Geochemical sampling and chemical analysis provide information used to:
(1) Delineate geothermal fields
(2) Locate aquifers, and
(3) Site wells.
The geochemist looks for parameters that would give an indication of trace of geothermal fluids and prediction of subsurface temperature. Trace of metal in the fluid such as Mercury and Lithium could be an indicator of geothermal area s (Bowen, 1989).
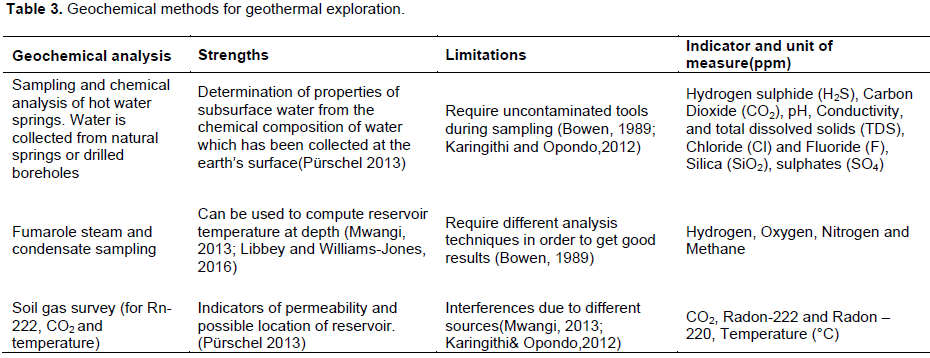
Borehole and springs chemical properties that are measured are temperature, pH, total dissolved solids (TDS), Carbon dioxide (CO2), sulphates (SO4), Chloride (Cl), Fluoride (F), Hydrogen (H2)Sodium (Na), Silica (SiO2), Randon gas (Rn-222) among others (Libbey and Williams-Jones, 2016; Mwangi, 2013; Pürschel, 2013; Karingithi and Opondo, 2012; Bowen, 1989). There are three main steps in geochemical processes:
(1) Sampling - care should be taken to avoid contamination of the samples
(2) Analysis- Isotopic analyses, enthalpy of the different fluids, and
(3) Interpretation of data.
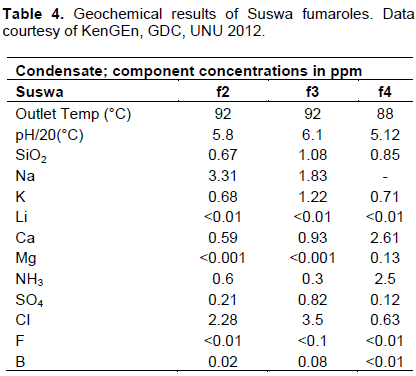
Where geothermal reservoirs have relatively high permeability and rather long residence times for fluid water, water and rock should attain chemical equilibrium if the temperatures exceed 200°C (Bowen, 1989). Chemical geothermometers are used to determine subsurface conditions. Increase in Carbon Dioxide level indicates increase in reservoir temperature (Pürschel, 2013). Table 3 lists the various geochemical analysis methods. Examples of geochemical analysis of three fumaroles in Suswa are shown in Table 4.
Geological mapping
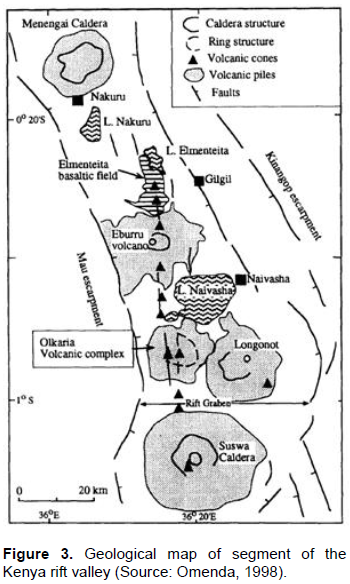
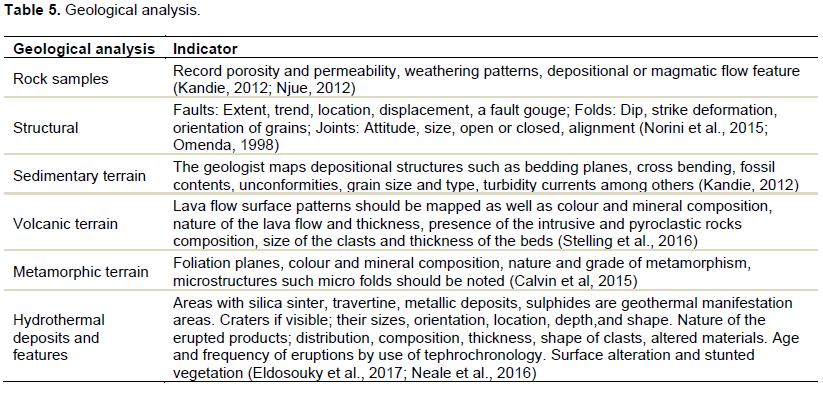
Geological analyses involve mapping parameters such as geological structures, volcanic centers and intrusive, geothermal manifestation, drainage pattern and rock type by either using geological maps or field visits. Geological maps provide information on distribution of rocks at surface, stratigraphy, geological structure which is useful in mapping geothermal potential areas. Figure 3 shows geological map of part of Kenya rift valley from Menengai to Suswa.
During the field visits, areas which give good exposure of outcrops and structures are located by making traverses across the geological grain (Bowen, 1989). Table 5 shows the various geological analyses methods.
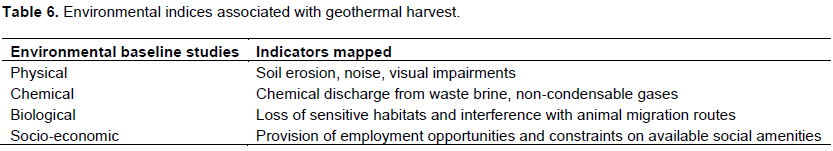
Environmental baseline studies
Environmental baseline studies outline existing environmental conditions to understand changes that may occur after proposed development like geothermal harvesting. The main aims of the environmental studies are to check
(1) Compliance with regulatory requirements
(2) Sustainable development and environmental impacts
(3) Implementation of monitoring, mitigation
(4) Biodiversity conservation
(5) Preservation of endangered species
(6) Community development projects and
(7) Safety.
Table 6 lists the various environmental indices that are associated with geothermal harvest.
Application of GIS and RS in deriving geothermal indicators
Many geoscientists have used RS data for mapping geothermal indicators since the advent of the technology. Remote sensing and GIS have been used to manage different geo scientific datasets associated with geothermal exploration (Knox-Robinson and Wyborn, 1997; Noorollahi et al., 2008; Prol-Ledesma, 2000).
In Russia, GIS has been used to integrate data on geothermal power plant location and characteristics of geothermal fields. The data has been shared publicly to enable users to carry out preliminary assessments of the geothermal potential areas (Teterina et al., 2015). Calvin et al. (2002) have combined optical, near-infrared and thermal infrared imagery to identify geothermal resources and map geologic structures based on their surface expression. They used both multispectral (ASTER, MASTER) and hyperspectral (HyMap, AVIRIS and SEBASS) data sets with field-based geologic maps to determine thermal anomalies. Pickles et al. (2001) used geobotanical hyperspectral airborne remote sensing to improve detection of geothermal anomalies. ASTER has been used to map Silica in La Pacana caldera (der Meer et al., 2014). Multispectral remote sensing have been used to map broad cases of surface minerals while hyperspectral optical remote sensing has been used to map surface mineralogy according to der Meer et al., (2012).
Other researchers have shown a negative correlation between the vegetation stress and changes of plant properties such as reduction in chlorophyll due to increase in ground temperatures could indicate geothermal anomalies and can be mapped using infrared bands (Haselwimmer and Prakash, 2013).
Thermal imagery has been used to assist exploration of geothermal prospects because the tone of the imagery shows the surface radiance temperature (Prakash et al., 1995). Thermal Infra-Red (TIR) remote sensing has been successfully used in geothermal exploration in the past (Babita and Sailesh, 2012; Zhou, 1998; Qin et al., 2011; Prakash et al., 1995).
Land Surface Temperature (LST) from Landsat-7 Enhanced Thematic Mapper Plus (ETM+) sensor has proved to be useful in geothermal exploration when combined with good understanding of geothermal mechanism of the area. LST has been integrated with geological analysis, geochemical, geophysics and suitability models for determination of geothermal potential areas (Qin et al., 2011; Siahaan et al., 2011; Elizabeth and Calvin, 2009).
Landsat has been shown to compute geothermal heat flux (GHF) and the results correlate well with ground data by different researchers (Savage et al., 2010; Watson et al., 2008). Unmanned Aerial Vehicle (UAV) based photogrammetric techniques have been used to map geological faults using data of rock surfaces by Vasuki, et al., (2014).
In their research, Coolbaugh et al. (2007) observed that some dark areas re-emit larger amounts of solar radiation than bright surfaces thus resulting in high terrestrial emittance that show false geothermal anomalies, thus recommends for topographic correction and effects of albedo.
In Kenya, Airborne Laser Scanning has been used at Menengai for an area of about 2000km2 resulting into 6,236 raw images. The images having the accuracy of 3m were used to map geothermal anomalies. LST was generated and integrated to DEM and geological analysis for the conceptual model. It was noted that for small area surface manifestations (mud pools, hot springs), the overall temperature was reducing, hence, 3 m pixel covering an 80°C hot vent of 50 cm2 size shows an overall temperature value of 20.25°C in 10°C surface temperature environment (Mutua, 2012).
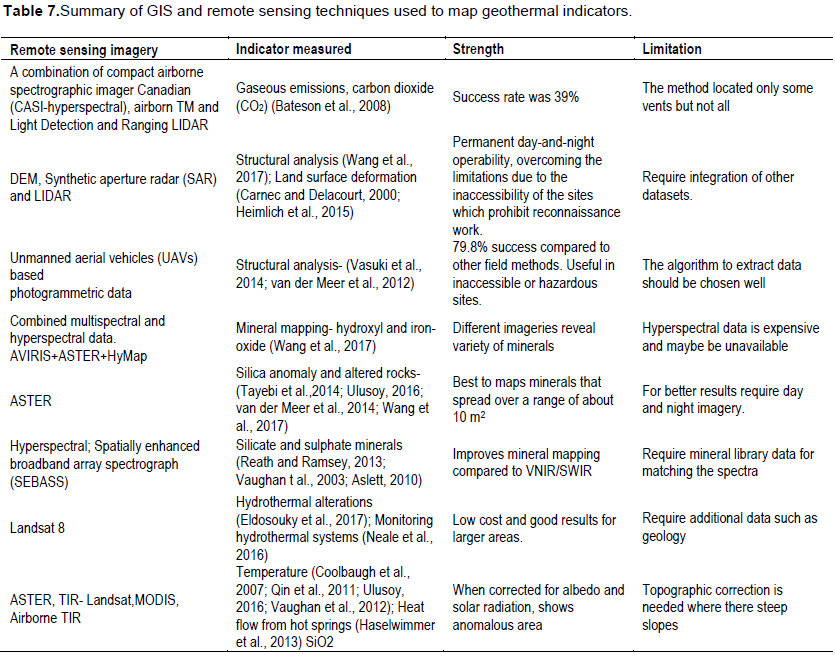
Although airborne survey gives better accuracy, TIR from Landsat provides a cost-effective technique. GIS based MCDA has been used to show high geothermal potential area by classifying different datasets in Afyonkarahisar (Yalcin and Gul, 2017). Also, Sadeghi andKhalajmasoumi (2015) have demonstrated that combination of different GIS analysis techniques is useful in combining different datasets. They combined fuzzy logic and binary index overlay to reveal geothermal potential areas. There is a wealth of literature on how remote sensing imagery and GIS integration has been used to map geothermal indicators by different researches as indicated in Table 7.
Cost analysis on exploration methods; case study Olkaria field in Kenya
Both satellite data processing and ground measurements can be used as reconnaissance tools. The costs associated with these activities are dependent on many factors, the main ones being:
(1) The cost of the satellite data
(2) Size of the area
(3) The number of measurements planned
(4) Terrain
(5) Whether using in-house staff or consultancy
(6) Methodology used
(7) Cost on hire of equipment
(8) Expenses on personnel allowances including professional fee and transport.
In comparing the relative costs on using either remote sensed data or ground measurements, the following assumptions are made use of. The assumptions used in this analysis are:
(1) The ground work measurements will be hired out to a consultant
(2) The methodologies to be employed are geology, geochemistry, geophysics and EIA
(3) Area of coverage is about 200 Km2
(4) Specific activities are data collection, analysis, report writing and review meetings
(5) The client will reimburse, all the cost expenses, on transport and equipment hire
(6) Satellite imagery used was Landsat 7 ETM+ and ASTER Digital Elevation Model.
(7) The exploration period is one month when all resources are available at cost.
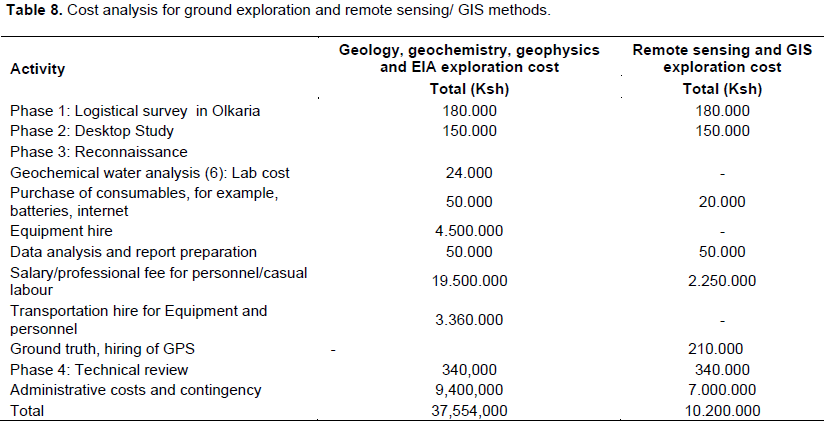
The budget (Table 8) is based on experience and information from industry. KenGen’s Olkaria geothermal field is used as an example. This is because much of KenGen’s 204 Km2 concession area is already developed and has data collected both remotely and on the ground.
In terms of development Olkaria can be divided into two parts on the basis of knowledge on the underlying resources. The best known (heavily explored) parts are the Northeast, Eastern and Domes sectors, where the existence of an exploitable resource has been confirmed by extensive drilling and long-term utilization and where comprehensive information is available on the nature and production capacity of the geothermal system.
The second part includes the less explored parts (to the west, south and south west) where drilling has been much more limited but has indirect indications of the existence of an exploitable resource and hence the field may be expanded in those directions (Table 8).
The budget is an indicative of the expected expenses. Comparing the two reconnaissance tools, that is, using remote sensed data and data collection on the ground, the large price difference is obvious. Ground data collection method is three times expensive as compared to the remote sensing methodology.
However, groundwork efforts do have an advantage over remote sensed data analysis, in that ground data is actual data as measured and not inferred from a processing technique commonly applied on remote sensed data. Further, ground surveys give opportunities for some type of data collection which satellite measurements cannot do, for example, determination of chemical parameter of geothermal fluids, physical properties of rocks and depth to reservoirs.
Nevertheless, an overriding advantage of remote sensed data use as an exploration tool lies in its coverage, availability and freely available for download. One can analyse data over a large area with minimal logistical challenges, such as seeking permission from land owners. Satellite data can show volcanic centres, heat anomalies, structures, land cover and other features of significance to geothermal energy exploration.
Satellite data processing tools allow 2D and 3D data analysis, and have the ability to integrate other mapping software which interacts with the GIS software allowing easy investigation of data quality, facilitates the understanding of complex structural geometry, and simultaneously visualizes multiple 3D models. It can also allow overlaying of many components or layers for better interpretation.
In this study, an in-depth review of the various methods that have been used in geothermal exploration has been given. For each of these methods, the specific indicators investigated and the respective strengths of the methods have been discussed. The benefits of using these methods have been alluded to and the intention of the paper that of putting together in one resource the various approaches that can be used in the efficient identification of suitable sites for geothermal exploitation.
Africa has a great potential of geothermal resources along the East African Rift System (EARS) which remains largely undeveloped. Although Kenya and Ethiopia are taking the lead in geothermal harvesting in Africa, other countries such as Democratic Republic of Congo, Djibouti, Eritrea, Madagascar, Malawi, Mozambique Rwanda, Tanzania, Uganda, and Zambia which are along the EARS could employ the cost effective exploitation methods (Kiplagat et al., 2011).
Many African countries have not exploited geothermal energy because of the relatively high cost and long-term commitment required so as to make returns according to Domra Kana (2015) drawing on the strengths of GIS and remote sensing in allowing the cost effective identification and siting of geothermal exploitation plants. When good exploration is done using remote sensing and GIS, then other detailed geoscientific (geophysical, geochemical and geologic) methods could follow, helping pinpoint accurately on where drilling and exploitation can take place in the prospect area. Integrating different methods is important as well as cost efficiency because certain parameters have different significance.
Therefore, a multidisciplinary approach integrating different methods is recommended. In summary remote sensing and GIS technology has contributed in deriving geothermal anomalies and providing data integration and analysis platform that leads to reveal new information. This review paper has shown through the various cases refereed, the application of these techniques, and the parameters that can be mapped giving researchers an opportunity to map and integrate with other scientific datasets, all geared towards efficient and cost effective exploitation of geothermal resources.
The authors have not declared any conflict of interests.
REFERENCES
|
Aretouyap Z, Nouck PN, Nouayou R (2016). A discussion of major geophysical methods used for geothermal exploration in Africa. Renewable and Sustainable Energy Rev. 58:775-781.
Crossref
|
|
|
|
Abiye TA, Tigistu H (2008). Geophysical exploration of the Boku geothermal area, Central Ethiopian Rift. Geothermics, 37(6):586-596.
Crossref
|
|
|
|
Aslett Z (2010). Evaluation of multi-scale hyperspectral reflectance and emittance image data for remote mineral mapping in northeastern Death Valley National Park, California and Oasis Valley, Nevada. (3404719 Ph.D.), University of Nevada, Reno, Ann Arbor.
|
|
|
|
Babita P, Sailesh S (2012). Topography and Land Temperature Investigation Using Arc GIS 10. Int. J. Basic and Appl. Sci. 01"02.
|
|
|
|
Bateson L, Vellico M, Beaubien SE, Pearce JM, Annunziatellis A, Ciotoli G, Marsh S (2008). The application of remote-sensing techniques to monitor CO2-storage sites for surface leakage: Method development and testing at Latera (Italy) where naturally produced CO2 is leaking to the atmosphere. Int. J. Greenhouse Gas Control 2(3):388-400.
Crossref
|
|
|
|
Bertani R (2015). Geothermal Power Generation in the World 2010-2014 Update Report in Proceedings World Geothermal Congress 2015,Melbourne, Australia, April 19-25, 2015.
|
|
|
|
Bowen R (1989). Geothermal Exploration. In R. Bowen (Ed.), Geothermal Resources. Dordrecht: Springer Netherlands. pp. 117-167.
Crossref
|
|
|
|
Calvin WM, Littlefield EF, Kratt C (2015). Remote sensing of geothermal-related minerals for resource exploration in Nevada. Geothermics, 53:517-526.
Crossref
|
|
|
|
Calvin W, Coolbaugh M, Vaughan RG (2002). Geothermal Site Characterization Using Multi- and Hyperspectral Imagery. Geothermal Resources Council Transactions, 26:483-484.
|
|
|
|
Carnec C, Delacourt C (2000). Three years of mining subsidence monitored by SAR interferometry, near Gardanne, France. J. Appl. Geophysics, 43(1):43-54.
Crossref
|
|
|
|
Coolbaugh MF, Kratt C, Fallacaro A, Calvin WM, Taranik JV (2007). Detection of geothermal anomalies using Advanced Spaceborne Thermal Emission and Reflection Radiometer (ASTER) thermal infrared images at Bradys Hot Springs, Nevada, USA. Remote Sensing Environ. 106(3):350-359.
Crossref
|
|
|
|
Domra Kana J, Djongyang N, Danwe R, Njandjock Nouck P, Abdouramani D (2015). A review of geophysical methods for geothermal exploration. Renewable and Sustainable Energy Rev. 44:87-95.
Crossref
|
|
|
|
Eldosouky AM, Abdelkareem M, Elkhateeb SO (2017). Integration of remote sensing and aeromagnetic data for mapping structural features and hydrothermal alteration zones in Wadi Allaqi area, South Eastern Desert of Egypt. J. Afr. Earth Sci. 130:28-37.
Crossref
|
|
|
|
Elizabeth A, Calvin W (2009). Remote Sensing for Geothermal Exploration Over Buffalo Valley, NV. GRC Transactions, 33.
|
|
|
|
Fournier RO, Rowe JJ (1966). Estimation of underground temperatures from the silica content of water from hot springs and wet steam wells. Am. J. Sci. (264):685-697.
Crossref
|
|
|
|
GEA (2012). Geothermal Energy Association 2012 International Market overview report.
|
|
|
|
Gil-Alana LA, Mudida R, Carcel H (2017). Shocks affecting electricity prices in Kenya, a fractional integration study. Energy, 124, 521-530.
Crossref
|
|
|
|
Gloporis E (2012). Renewable energy sources in Kenya. Report proceedings , Glopolis analytical centre , March 12-15 .
|
|
|
|
Haselwimmer C, Prakash A (2013). Thermal Infrared Remote Sensing of Geothermal Systems. In C. Kuenzer & S. Dech (Eds.), Thermal Infrared Remote Sensing: Sensors, Methods, Applications (pp. 453-473). Dordrecht: Springer Netherlands.
Crossref
|
|
|
|
Haselwimmer C, Prakash A, Holdmann G (2013). Quantifying the heat flux and outflow rate of hot springs using airborne thermal imagery: Case study from Pilgrim Hot Springs, Alaska. Remote Sensing of Environ. 136:37-46.
Crossref
|
|
|
|
Heimlich C, Gourmelen N, Masson F, Schmittbuhl J, Kim SW, Azzola J (2015). Uplift around the geothermal power plant of Landau (Germany) as observed by InSAR monitoring. Geothermal Energy, 3(1):2. doi:10.1186/s40517-014-0024.
|
|
|
|
Hersir GP, Bjornsson A (1991).Geophysical Exploration for Geothermal Resources- principles and application.UNU Geothermal Training Programme, Reykjavik, Iceland Report 15.
|
|
|
|
Kandie R (2012). Introduction to Geological field mapping. Short course VIII on exploration for geothermal resources. Organized by UNU-GTP, GDC and KenGen and held at Lake Bogoria Hotel and Lake Naivasha Sopa Resort, Naivasha, Kenya, 31st October – 22nd November.
|
|
|
|
Karingithi C, Opondo KM (2012). Application of geochemistry in geothermal technology. Short course VIII on exploration for geothermal resources. Organized by UNU-GTP, GDC and KenGen and held at Lake Bogoria Hotel and Lake Naivasha Sopa Resort, Naivasha, Kenya, 31st October – 22nd November.
|
|
|
|
Kiruja J (2011). Potential for direct utilisation of geothermal energy at the lake bogoria geothermal resource proceedings, Kenya Geothermal Conference 2011 Kenyatta International Conference Center, Nairobi, November 21-22.
|
|
|
|
Knoxâ€Robinson CM, Wyborn LAI (1997): Towards a holistic exploration strategy: Using Geographic Information Systems as a tool to enhance exploration, Australian Journal of Earth Sciences: An Int. Geoscience J. Geological Society of Austr. 44(4):453-463.
|
|
|
|
Kiplagat JK, Wang RZ, Li TX (2011). Renewable energy in Kenya: Resource potential and status of exploitation. Renewable and Sustainable Energy Reviews, 15(6):2960-2973.
Crossref
|
|
|
|
Libbey RB, Williams-Jones AE (2016). Compositions of hydrothermal silicates and carbonates as indicators of physicochemical conditions in the Reykjanes geothermal system, Iceland. Geothermics, 64:15-27.
Crossref
|
|
|
|
Lichoro CM, Árnason K, Cumming W (2017). Resistivity imaging of geothermal resources in northern Kenya rift by joint 1D inversion of MT and TEM data. Geothermics, 68:20-32.
Crossref
|
|
|
|
Mariita NO (2010).Strengths and weaknesses of gravity and magnetics as exploration tools for geothermal energy. Presented at short course V on exploration for geothermal resources. Naivasha, Kenya: UNU-GTP, KenGen, GDC; 2010.
|
|
|
|
Mibei B (2012). Status of geothermal exploration and development in Kenya. Short course VIII on exploration for geothermal resources. Organized by UNU-GTP, GDC and KenGen and held at Lake Bogoria Hotel and Lake Naivasha Sopa Resort, Naivasha, Kenya, 31st October – 22nd November.
|
|
|
|
Muhagaze L (1984). Geological mapping and borehole geology in geothermal exploration. Report 5, 38 pp. Li.
|
|
|
|
Mutua J (2012). Remote sensing in Geothermal exploration. Short course VIII on exploration for geothermal resources. Organized by UNU-GTP, GDC and KenGen and held at Lake Bogoria Hotel and Lake Naivasha Sopa Resort, Naivasha, Kenya, 31st October – 22nd November.
|
|
|
|
Mwangi SM (2013). Application of Geochemical Methods in Geothermal Exploration in Kenya. Procedia Earth and Planetary Science, 7, 602-606.
Crossref
|
|
|
|
Neale CMU, Jaworowski C, Heasler H, Sivarajan S, Masih A (2016). Hydrothermal monitoring in Yellowstone National Park using airborne thermal infrared remote sensing. Remote Sensing of Environment, 184:628-644.
Crossref
|
|
|
|
Norini G, Groppelli G, Sulpizio R, Carrasco-Nú-ez G, Dávila-Harris P, Pellicioli C, De Franco R (2015). Structural analysis and thermal remote sensing of the Los Humeros Volcanic Complex: Implications for volcano structure and geothermal exploration. J. Volcanol. Geothermal Res. 301:221-237.
Crossref
|
|
|
|
Njue LM (2012).Geothermal manifestation. Short course VIII on exploration for geothermal resources. Organized by UNU-GTP, GDC and KenGen and held at Lake Bogoria Hotel and Lake Naivasha Sopa Resort, Naivasha, Kenya, 31st October – 22nd November.
|
|
|
|
Omenda PA (1998).The geology and structural controls of the Olkaria geothermal system,Kenya. Geothermics, 27(1):55-74.
Crossref
|
|
|
|
Omenda PA (2012).Development of geothermal resources in Africa: Kenya experience proceedings, 4th African Rift Geothermal Conference (ARGeo-C4), UNEP Headquarters, Nairobi, Kenya, November 21-23.
|
|
|
|
Omenda PA, Simiyu S (2015). Country Update Report for Kenya 2010-2014. Proceedings World Geothermal Congress 2015, Melbourne, Australia, April 19-25.
|
|
|
|
Othieno H, Awange J (2016). Energy Resources in East Africa. In H. Othieno & J. Awange (Eds.), Energy Resources in Africa: Distribution, Opportunities and Challenges. Cham: Springer International Publishing. pp. 33-137
Crossref
|
|
|
|
Pickles WL, Kasameyer PW, Martini BA, Potts DC, Silver EA (2001). Geobotanical Remote Sensing for Geothermal Exploration. Geothermal Resources Council Transactions, 25:307-312.
|
|
|
|
Prakash A, Sastry RGS, Gupta RP, Saraf AK (1995). Estimating the depth of buried hot features from thermal IR remote sensing data: a conceptual approach. Int. J. Remote Sensing 16(13):2503-2510.
Crossref
|
|
|
|
Prol-Ledesma RM (2000). Evaluation of the reconnaissance results in geothermal exploration using GIS. Geothermics 29:83-103.
Crossref
|
|
|
|
Pürschel M, Gloaguen R, Stadler S (2013).Geothermal activities in the Main Ethiopian Rift: Hydrogeochemical characterization of geothermal waters and geothermometry applications (Dofan-Fantale, Gergede-Sodere, Aluto-Langano). Geothermics 47:1-12.
Crossref
|
|
|
|
Qin Q, Zhang N, Nan P, Chai L (2011). Geothermal area detection using Landsat ETM+ thermal infrared data and its mechanistic analysis—A case study in Tengchong, China. Int. J. Appl. Earth Observation and Geoinformation, 13(4):552-559.
Crossref
|
|
|
|
Reath KA, Ramsey MS (2013). Exploration of geothermal systems using hyperspectral thermal infrared remote sensing. J. Volcanol. Geothermal Res. 265:27-38.
Crossref
|
|
|
|
Sadeghi B, Khalajmasoumi M (2015). A futuristic review for evaluation of geothermal potentials using fuzzy logic and binary index overlay in GIS environment. Renewable and Sustainable Energy Rev. 43:818-831.
Crossref
|
|
|
|
Savage SL, Lawrence RL, Custer SG, Jewett JT, Powell SL, Shaw JA (2010). Review of Alternative Methods for Estimating Terrestrial Emittance and Geothermal Heat Flux for Yellowstone National Park Using Landsat Imagery. GIScience Remote Sensing. 47(4):460-479.
Crossref
|
|
|
|
Siahaan MN, Soebandrio Andri, Wikantika Ketut (2011) Geothermal potential exploration using remote sensing technique (Case study : Patuha area, West Java).10th Annual Asian Conference & exhibition on Geospatial Information, Technology & Applications. October 17-19.
|
|
|
|
Sircar A, Shah M, Sahajpal S, Vaidya D, Dhale S, Chaudhary A (2015). Geothermal exploration in Gujarat: case study from Dholera. Geothermal Energy, 3(1):22.
Crossref
|
|
|
|
Stelling P, Shevenell L, Hinz N, Coolbaugh M, Melosh G, Cumming W (2016). Geothermal systems in volcanic arcs: Volcanic characteristics and surface manifestations as indicators of geothermal potential and favorability worldwide. J. Volcanol. Geothermal Res. 324:57-72.
Crossref
|
|
|
|
Tayebi MH, Tangestani MH, Vincent RK, Neal D (2014). Spectral properties and ASTER-based alteration mapping of Masahim volcano facies, SE Iran. J. Volcanol. Geothermal Res. 287:40-50.
Crossref
|
|
|
|
Teterina N, Rafikova Y, Kiseleva S (2015). Assessment of Geothermal Resources Potential in Regions of Russia, using GIS technologies. Proceedings World Geothermal Congress 2015 Melbourne, Australia, 19-25 April 2015.
|
|
|
|
Ulusoy Ä° (2016). Temporal radiative heat flux estimation and alteration mapping of Tendürek volcano (eastern Turkey) using ASTER imagery. J. Volcanol. Geothermal Res. 327:40-54.
Crossref
|
|
|
|
van der Meer F, Hecker C, van Ruitenbeek F, van der Werff H, de Wijkerslooth C, Wechsler C (2014). Geologic remote sensing for geothermal exploration: A review. Int. J. Appl. Earth Observation Geoinformation, 33:255-269.
Crossref
|
|
|
|
van der Meer FD, van der Werff HMA, van Ruitenbeek FJA, Hecker CA, Bakker WH, Noomen MF, Woldai T (2012). Multi- and hyperspectral geologic remote sensing: A review. Int. J. Appl. Earth Observation Geoinformation, 14(1):112-128.
Crossref
|
|
|
|
Vasuki Y, Holden EJ, Kovesi P, Micklethwaite S (2014). Semi-automatic mapping of geological Structures using UAV-based photogrammetric data: An image analysis approach. Comput. Geosci. 69:22-32.
Crossref
|
|
|
|
Vaughan RG, Calvin WM, Taranik JV (2003). SEBASS hyperspectral thermal infrared data: surface emissivity measurement and mineral mapping. Remote Sensing of Environ. 85(1):48-63.
Crossref
|
|
|
|
Vaughan RG, Keszthelyi LP, Lowenstern JB, Jaworowski C, Heasler H (2012). Use of ASTER and MODIS thermal infrared data to quantify heat flow and hydrothermal change at Yellowstone National Park. J. Volcanol. Geothermal Res. 233-234:72-89.
Crossref
|
|
|
|
Wang G, Du W, Carranza EJM (2017). Remote sensing and GIS prospectivity mapping for magmatic-hydrothermal base- and precious-metal deposits in the Honghai district, China. J. Afr. Earth Sci. 128:97-115.
Crossref
|
|
|
|
Wanjohi A (2012). Geophysical Mapping - Introduction. Short course VIII on exploration for geothermal resources. Organized by UNU-GTP, GDC and KenGen and held at Lake Bogoria Hotel and Lake Naivasha Sopa Resort, Naivasha, Kenya, 31st October – 22nd November.
|
|
|
|
Watson FGR, Lockwood RE, Newman WB, Anderson TN, Garrott RA (2008). Development and comparison of Landsat radiometric and snowpack model inversion techniques for estimating geothermal heat flux. Remote Sensing of Environ. 112(2):471-481.
Crossref
|
|
|
|
White DE, Williams DL (1975). Assessment of geothermal resources of the United States. U.S. Geological Survey Circular 726:155 p.
|
|
|
|
Yalcin M, Kilic Gul F (2017). A GIS-based multi criteria decision analysis approach for exploring geothermal resources: Akarcay basin (Afyonkarahisar). Geothermics, 67:18-28.
Crossref
|
|
|
|
Zhou Y (1998). The application of thermal infrared remote sensing techniques in geothermal surveying. Remote Sensing for Land & Resources 4:24-28.
|