Full Length Research Paper

ABSTRACT
In this paper, land use and land cover change detection of some selected stations in Anambra state for three (3) periods of twenty-nine (29) years was conducted. This was done by using three satellite images of different dates (1986, 2000 and 2013) which were interpreted and analyzed to extract the detailed information for identification of the changes. To obtain the changes in the land use/land cover, the traditional approach of post classification comparison was followed. The satellite images, submaps created were georeferenced and classified by the method of unsupervised classification based on the following classification scheme: water bodies, vegetation, gully areas, built-up areas and bare surfaces. The results showed significant rapid growth in built-up areas while the vegetation and gully areas were annually decreasing. Also, there was little or no appreciable change in water bodies. This study will guide policy makers and urban planners in the administration of land use development of the study area.
Key words: Land use, classification, change detection, built up areas, vegetation.
INTRODUCTION
Land is definitely one of the most important natural resources, since life and developmental activities are based on it. Land use refers to the type of utilization to which man has put the land for some specific use. It also refers to evaluation of the land with respect to various natural characteristics. But land cover describes the vegetal attributes of land. Land use and land cover data are essentials for planners, decision makers and those concerned with land resources management. Land use is obviously constrained by environmental factors such as soil characteristics, climate, topography, and vegetation. But it also reflects the importance of land as a key and finite resource for most human activities including agriculture, industry, forestry, energy production, settlement, recreation, and water catchment and storage. Land is a fundamental factor of production, and through much of the course of human history, it has been tightly coupled to economic growth (Richards, 1990). As a result, control over land and its use is often an object of intense human interactions. Human activities that make use of, and hence change or maintain, attributes of land cover are considered to be the proximate sources of change. They range from the initial conversion of natural forest into cropland to on-going grassland management (e.g., determining the intensity of grazing and fire frequency) (Hobbs et al., 1991; Turner,1989). Such actions arise as a consequence of a very wide range of social objectives, including the need for food, fiber, living space, and recreation; they therefore cannot be understood independent of the underlying driving forces that motivate and constrain production and consumption. Some of these, such as property rights and the structures of power from the local to the international level, influence access to or control over land resources. Others, such as population density and the level of economic and social development affect the demands that will be placed on the land, while technology influences the intensity of exploitation that is possible. Still others, such as agricultural pricing policies, shape land-use decisions by creating the incentives that motivate individual decision makers. The possible forces driving land-use and land-cover changes can be grouped into six categories such as: population; level of affluence; technology; political economy; political structure; and attitudes and values (Turner and Meyer, 1991; Stern et al., 1992).The first three have been linked to environmental change in the I = PAT relationship that considers environmental impact (I) to be a function of population (P), affluence (A), and technology (T) (Commoner 1972). The relationships of these three categories of driving forces with environ-mental change have been statistically analyzed. Some of this work specifically addresses land-use and land-cover change (Meyer and Turner, 1992) and suggests measures for each category: namely, population density, GNP or GDP per capita, and energy consumption per capita. Data from satellite images, with its synoptic view of large area under uniform illumination and revisit capabilities amongst other benefits, can offer possibilities for the land use change pattern (Aldrich, 1975). Modeling these changes through the use of remote sensing techniques is critical/crucial for formulating effective environmental policies and management strategies (Kuleli, 2005)
This paper employs the technique in detecting changes in land use/land cover inter alias estimating the real extent of the changes. The paper also addresses the consequences arising from the observable changes in land use patterns, an appreciation of which could assist the relevant planning authorities to promptly and easily counter the adverse effects of the changes.
Study area
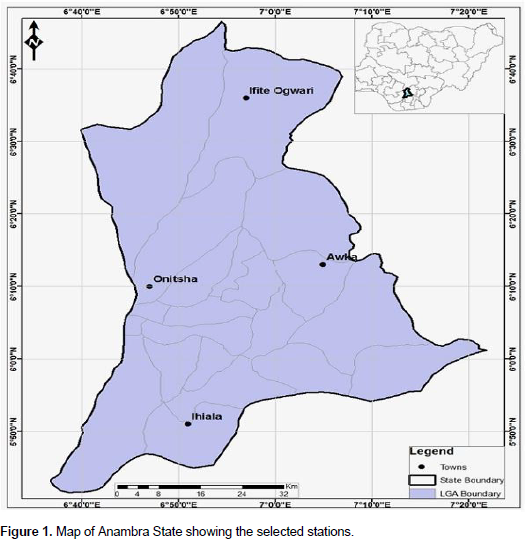
Anambra State of Nigeria was created on 27th August, 1991 out of the old Anambra State with its state capital as Awka which lies at Latitude 6021’N and Longitude 7061’E. The land area is approximately 4,844km2, its annual population growth rate of 2.21% per annum (National Bureau of Statistics, 2011). Anambra State has over 60% of its people living in urban areas making it one of the most urbanized places in Nigeria (National Bureau of Statistics, 2011). Since then, the state has being witnessing immense growth in the size of built-up areas, increase in number of immigrants, transportation and commercial activities. It experiences warm humid tropical climate, with average rainfall between 1520-2020mm per annum. Minimum and Maximum temperatures range between 25.40C and 30.60C and its vegetation is the tropical forest type (NIMET Seasonal Rainfall Prediction, 2014).
For this study, the following towns were selected; they are Awka, Onitsha, Ihiala and Ifite-Ogwari. Awka lies between 6021’N and 70610E, Onitsha lies between 6017’N and 6078’E, Ihiala lies between 5086’N and 6086’E and Ifite-Ogwari lies between 6060’N and 6095’E (Figure 1).
DATA AND METHODOLOGY
Landsat TM of 1986, Landsat ETM of 2000 and Landsat 8(OLI) of 2013 were sourced for interpretation and analyzed in order to obtain the required data for this work. Ancillary data such as topographic, street guide, land use and infrastructure maps were used as base maps. There was also an intensive ground truth collection/verification exercise. The images were obtained from Global Land Cover Facility of the University of Maryland while the maps were sourced from the State Ministry of Lands and Survey in Awka. The salient features of the Landsat satellite images are presented in Table 1.
Most change detection techniques fall into five general categories via manual, write function memory insertion, image enhancement, multi-date data classification and comparison of two independent land cover classifications (Kuleli, 2005; Masi, 1999; Jenson, 1996). In this study, the traditional approach of post classification comparison, which aims at establishing the difference between the classified images of two different dates, is used for changed detection study. This does not only allow areas of no change to be identified, but in areas where change has occurred, the nature of the change can be determined. Additionally selective grouping of classification results allows the analyst to observe any subset of changes, which may be of interest (Singh, 1989).
Land use and land cover change analysis
Satellite images were analyzed in conjunction with ground truth observation as stated by Thomas and Ayuk (2010) and Kumar et al. (2014). Five land use classes; water bodies, vegetation, gully areas, built-up and bare surfaces were delineated as the major land use cover types. Weeks (2003) recommends the use of at least two time-period data sets to detect changes in land use and land cover through processes such as urban sprawl, in that it is change in places over time that we must measure and analyses essentially measure the impact of human settlement by quantifying the change. The selection of the image was based on the acquisition date (season), availability, spatial resolution and percent cloud cover. All images coincided with dry season before onset of rains.
Image classification
Land use and Land cover maps were developed from satellite images through defining spectral classes by clustering image data and assigning pixels into classes. Multi-temporal Landsat data processing was done using ENVI 4.7 software (ESRI, 2009).
Regions of Interest (ROI) were defined to extract statistics for classification. Supervised classification was used with false colour composite bands (4, 3, and 2) to cluster pixels in a dataset into classes corresponding to the selected ROI. Supervised classification techniques used to classify the images included minimum distance and maximum likelihood (ESRI, 2009)
Change detection
Change detection was done for the classified land use and land cover types. ENVI EX Software (ESRI, 2009) was used for thematic change detection by comparing two images of different time periods (1986 and 2000 images, and 2013 images) and overall change between 1986 and 2013.
Human population
Human demographic data spanning from 1961 to 2006 population census were collated from National Bureau of Statistics of the Federal Republic of Nigeria. This was used to compute the land consumption rate and land absorption coefficient.
(Trend) percentage change= observed change x 100
Sum of change --- (1)
In obtaining approximate annual rate of change, the percentage change is divided by 100 and multiplied by the number of study year 1986-2013 (27 years). Overlay operations identifies the actual location and magnitude of change.
The land consumption rate and absorption coefficient formula are given below;
L.C.R = A/P ---- (2)
A= real extent of the study area.
P= Population

A1 and A2 are the areal extents (in sq. meters) for the early and later years, and P1 and P2 are population figure for the early and later years respectively (Yeates and Garner, 1976).
The 2008, 2009 and 2010 population figure was projected by National Bureau of statistics using the recommended National Population Commission (NPC) 2.5% growth rate as obtained from the 1991/2006 censuses.
n = r/100*P0……………………… (4)
Pn= P0 + (n * t)……………. (5)
Pn= estimated population
P0= base year population (1991 population figure)
r = growth rate (2.5%)
n = annual population growth
t = number of projection years
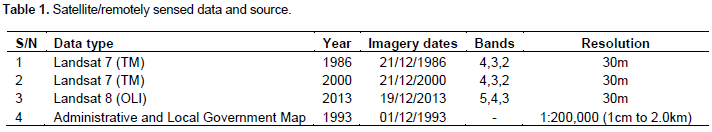
For clarity of expression, analysis of change detection is carried out through the use of Arc GIS. Firstly, digital layers of land use/land cover classes for the years under focus (i.e. 1986, 2000 and 2013). The areal extent of each class is then delineated. Secondly, the layers are laid and the results are displayed, which allows comparison to identify changes and the magnitude of the changes of the changes that are involved. Each of the composite change maps depicts only the changes that involve just a single class for the years 1986, 2000 and 2013. Ground truth (Field work) exercise is undertaken to aid in the analysis and interpretation of the satellite images (Figure 2).
RESULTS AND DISCUSSION
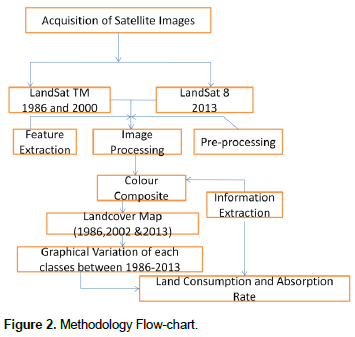
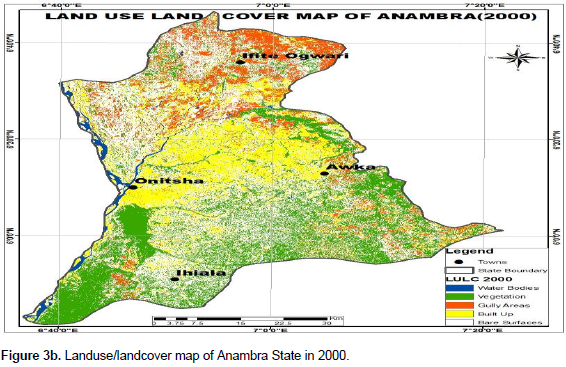
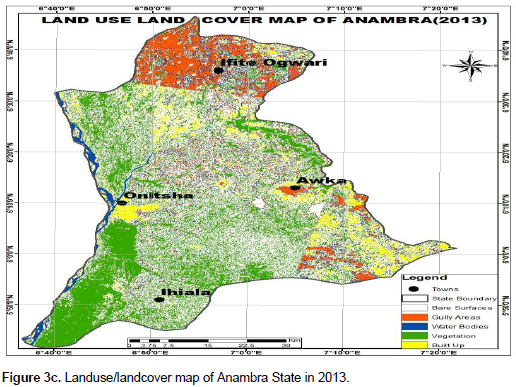
The land use map of Anambra state for 1986, 2000 and 2013 is presented in Figures 3a to 3c.
The total area of Ifite-Ogwari in square meters was about 196.39 m2. Table 2 shows the Land use and Land cover Classification of 1986, 2000 and 2013 dataset.
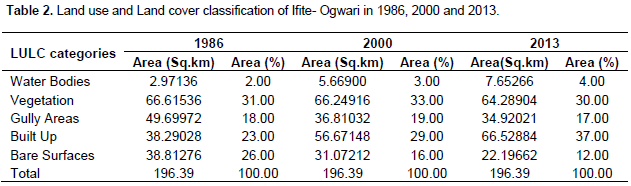
Table 2 represents static area of each land use land cover category for each year. Ifite-Ogwari had water bodies covering 2% of the total land use land cover which has the least percentage cover apart from gully areas which has 18% of the spatial extent. Also, vegetation occupied 31% which is the highest coverage followed by bare surfaces having 26% of the total land use land cover in 1986. This implies that the Ifite-Ogwari is an area still developing from traditional setting where farming seems to form the basis of living. In addition, the season in which the study area satellite image was acquired fell within the dry season; this would also be a major contributing factor to the observed classification. Gully areas had 18% indicating that the settlement is dominated by farmers, traditional farm practices resulted to the gully within the area. Water bodies during that period would also be lower as there would be reduced or no rainfall. Vegetation had the largest area cover mainly because of poor economic growth, sluggish population, forest preservation and management.
In 2000, built-up occupied the second largest with 29% rather than 26% in 1986; this suggests a percentage change of 6% and annual rate of change of 0.84%. This may be due to the fact that Ifite-Ogwari was the hub of agricultural activities in Anambra State and the development was slow.
As in 1986, water bodies also occupy the least though of higher percentage in 2000. This may be due to the dam construction e.g. Anambra-Imo River basin, Omambara river etc. The change in land use and land cover distribution in 2000 in comparison to the year 1986 are as follows: vegetation was the highest in 1986 with 30% of the total area cover which increased to 33% in 2000, bare surface was the second highest which was 26% in 1986 and drop to 16% in 2000, built-up which was 23% in 1986 increased to 29% in 2000, gully areas covered 18% in 1986 and increased to 19% in 2000 and water bodies remain the least in both cases.
In 2013, built-up occupied 37% of the entire spatial extent in Ifite-Ogwari, indicating an increase from 29% coverage in 2000 and 23% in 1986. This may have occurred as a result of increase in farm settlements and the influx of oil companies exploring the oil deposits within the area. The change in the land use and land cover distribution pattern from 1986 to the year 2013 are: vegetation has the second highest in 1986 of the total area cover which increase to 33% in 2000 and drop to 30% in 2013, gully areas was 18% in 1986, increased to 19% in 2000 and decreased to 17% in 2013. The decrease in the gully areas may be as a result of memorandum of understanding signed between Anambra State government and World Bank on Erosion control in 2013. Bare surface, which was 26% in 1986, dropped to 16% in 2000 and decreased further to 12% in 2013; though the water bodies remain the least with 2% in 1986, 3% in 2000 and increased to 4% in 2013 (Table 3).
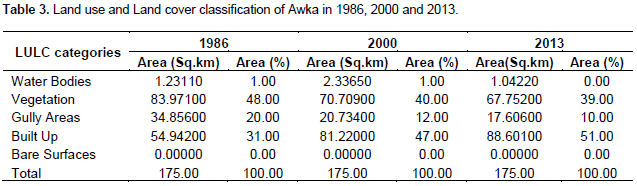
In 1986, vegetation occupies 48% of the entire spatial extent in Awka which was the highest coverage, followed by built-up areas with 31%, gully areas with 20% while water bodies, 1% and bare surfaces, 0%.
In 2000, built-up occupies the largest with 47% of the spatial extent of Awka, indicating an increase from 31% in 1986, and the percentage increase was 16%. This may be due to the fact that migration rate increased as the capital city is the administrative, economic and commercial heart beat of Anambra State.
Vegetation coverage decreased from 48% in 1986 to 40% in 2000. This implies that rural-urban migration has impacted on the vegetation drastically because more built-up areas, roads and new markets has emerged to meet the teeming demands of Awka residents. Gully areas also were with 12% in 2000, indicating a drop from 20% in 1986 and this may have resulted from Anambra state Erosion Control programme by State Ministry of Environment. Water bodies were 1% in 2000, maintaining the same spatial extent of 1% in 1986 and bare surfaces, 0% in 1986 and 2000.
In 2013, built-up covers the highest of the spatial extent with 51%, which indicates an increase from 31% in 1986 and 47% in 2000 consecutively. This may have resulted from the Capital city of Anambra State which centers administrative, commercial and other industrial activities in the state. The pattern of land use land cover distribution in 2013 change compared to 2000 and 1986: vegetation was the highest in 1986 with 48% of the total area cover which drop to 40% in 2000, decrease further to 39% in 2013, gully areas which was 20% in 1986 reduced to 12% and also decrease to 10% in 2013, water bodies was with 1% in 1986, 1% in 2000 and decreased to 0%. Bare surfaces remain the least with 0% in 1986, 2000 and 2013 respectively.
Table 4 represents static area of each land use/ land cover category for each year. Built-up areas covering 45% of the total land use followed by vegetation which was 26%, gully areas with 13%, bare surfaces with 11% and water bodies having the least spatial extent with 5% in 1986. Onitsha city is known as one of the commercial hubs in West Africa because of the presence of Onitsha Main market, Building materials Market, Electrical Market and Auto-spare parts. This results in influx of rural residents into the city which contributes to built-up areas with 45% and vegetation with 26%. This indicates that the city is just moving away from traditional setting where farming seems to form basis of living. In addition, the season in which the study area was imaged fall within the dry season. This would also be a major contributing factor to the observed classification. The weather factor during this period might have reduced the percentage or area of the vegetation as some trees would be withered. Water bodies and gullies during this period will also be lowered as there will be reduced or no rainfall. In 2000, built-up occupies the largest with 57% indicating a percentage increase of 12% from 45% in 1986. This may be due to the fact that migration rate increased as the city is the commercial hub of Anambra State and the development of the city through increase in infrastructures which consumes land built-up. The pattern of land use land cover distribution in 2000 change compared to 1986 shows vegetation was the second highest in 1986 with 26% of the total cover which increased to 28% in 2000, gully areas which was 13% in 1986 decreased to 8% in 2000, water bodies with 5% in 1986 increased to 7% in 2000 while bare surfaces was with 11% in 1986 which drop to 0% in 2000.
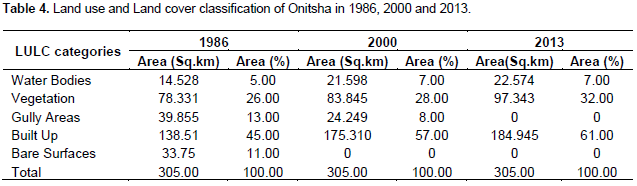
In 2013, built-up covers the highest of the spatial extent with 61%, which indicates an increase from 45% in 1986 and 57% in 2000 consecutively. This may have resulted from the commercial activities in and around Onitsha such as Onitsha Main market, Ose market, Building materials market, Auto-spare parts market etc. The pattern of land use land cover distribution in 2013 change compared to 2000 and 1986 shows vegetation was the second highest in 1986 with 26% of the total area cover which increased to 28% in 2000, increased further to 32% in 2013, gully areas which was 13% in 1986 reduced to 8% and also decrease to 0% in 2013, water bodies was 5% in 1986, 7% in 2000 and 7% in 2013. Bare surfaces remain the least with 11% in 1986, 0% in 2000 and 2013 respectively.
Table 5 represents static area of each land use/ land cover category for each year. Vegetation was 36%, built- up areas covered 24% of the total land use, gully areas were 19%, and bare surfaces were 16% and water bodies covered the least spatial extent by 5% in 1986. Ihiala city lies in the agricultural belt of the State; it is a peaceful part of the state attracting settlers wishing to escape the chaotic state of Onitsha and Awka. In addition, the season in which the study area was imaged falls within the dry season. This would also be a major contributing factor to the observed classification. The weather factor during this period might have reduced the percentage or area of the vegetation as some trees would be withered. Water bodies and gullies during this period will also be lowered as there will be reduced or no rainfall.
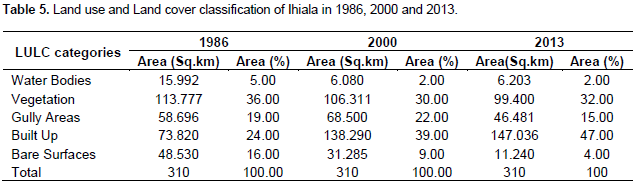
In 2000, built-up occupies the largest by 39% indicating an increase in 1986 from covering 24% of the spatial extent in Ihiala. This may have resulted from urban settlers seeking affordable housing in the city because house rent in Onitsha and Awka is relatively on the high side. Vegetation covered 36% in 1986 and decreased to 34% in 2000. This may have occurred as a result of the increase in built-up areas within the areas coupled with infrastructural developments to meet the teeming demands of new settlers from the neighboring cities. Gully areas occupied 19% in 1986 and increased to 22% in 2000; agricultural activities within this area may have contributed to the increase in the gully areas. Bare surfaces occupied 16% in 1986 and dropped to 10% in 2000; while water bodies covered 5% in 1986 and dropped to 2% in 2000; the weather factor during the period may have reduced the water bodies.
In 2013, built-up covers the highest of the spatial extent with 47%, which indicates an increase from 24% in 1986 and 32% in 2000 consecutively. This may have resulted from the presence of Anambra state University, Madonna University and its capacity as the local administrative capital of the zone. The pattern of land use land cover distribution in 2013 change compared to 2000 and 1986 is that vegetation was the highest in 1986 with 36% of the total area cover which decreased to 34% in 2000, dropped to 32% in 2013, gully areas which was 19% in 1986 increased to 22% and also decreased to 15% in 2013; water bodies, 5% in 1986, 2% in 2000 and maintained 2% in 2013. Bare surfaces covered 16% in 1986, dropped to 10% in 2000 and covered 4% in 2013 respectively (Tables 6-9).
Land use land cover change: Trend, rate and magnitude
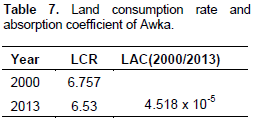
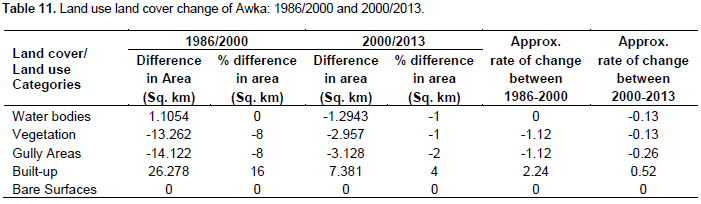
From Table 10, there is a negative change in bare surface between 1986/2000 and 2000/2013. This may be the reason why rocky/undulating area is utilized by people for commercial activities (quarry, construction, blasting and mining). Consequently, the built up land increased by 6% between 1986/2000 and 8% between 2000/2013. This is because many State projects are respectively and this may have occurred in that the State Ministry of Environment have intensified efforts in curbing erosion menace in the capital city. South of the town on the slopes of the Awka-Orlu uplands are locations where such soil erosion and gully control project has been mitigated. Built up land increased by 16% in 1986/2000 and 4% in 2000/2013. This may have resulted from the state creation in 1991; the city hosts the State Governor’s Lodge, State Assembly and State Ministries for Health, Education, Lands, Water. Anambra Broadcasting Service (ABS) and radio station are located in the city centre. A number of federal institutions including the Central Bank of Nigeria, the NTA Awka media station, and branches of the Federal Inland Revenue Service, Federal Road Safety Commission, Nigerian Immigration Service, and Corporate Affairs Commission are also present in the city. Thus, this attracts a lot of people to the city leading to the physical expansion of the city as evident in the land consumption rate of 6.757 in 2000 and it dropped to 6.53 in 2013 as a result of the technical cooperation agreement between the State Government and UN-HABITAT in 2007 to provide technical assistance in preparation of a Structure plan for Awka Capital Territory (2009-2028).
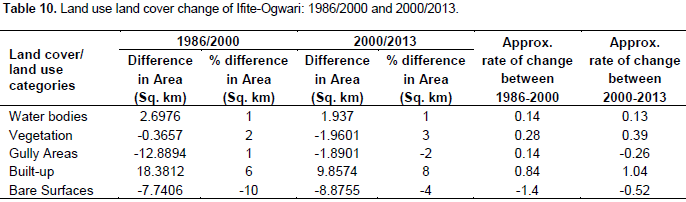
Water bodies covered 0% in 1986/2000 and dropped to -1% in 2000/2013; this may have resulted because the season the study area was imaged was dry season in that cloud free images are available within that season (Table 11).
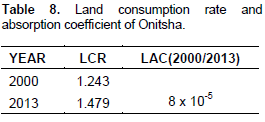
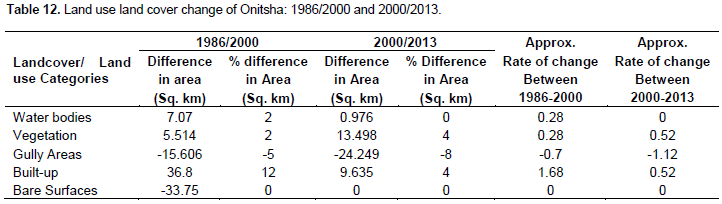
From Table 12, there is a negative change in Gully areas from 1986/2000 and 2000/2013, which was -5 and -8% respectively. This may have resulted from State Government Erosion control tagged Anambra State Integrated Development Strategy. Water bodies covered 2% in 1986/2000 and dropped to 0% 2000/2013, which may be linked to the dry season when the study area was imaged. Subsequently, the built-up land increased by 12% in 1986/2000 and dropped to 4% in 2000/2013. This is because of the city serves as commercial hub for the entire State leading to physical expansion of the city as evident in the increase land consumption rate from 1.243 in 2000 to 1.479 in 2013 and land absorption coefficient by 8 x 10⁻⁵ between 2000 and 2013. Some of the land consuming projects include; Onitsha Main Market, Upper Iweka Market, Auto-Spare Parts Market, Building Materials Market, Electronics Market, Federal Housing Estate Fegge, Government Residential Area, Awada layout, Omagba Phase 1 and 2 among others will encourage migration into the city.
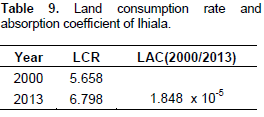
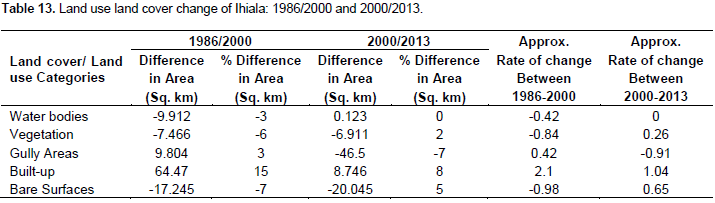
From Table 13, there is a negative change in vegetation areas from 1986/2000 which was -6% and positive change of 2% in 2000/2013. This may have resulted from the State Erosion Control program and migration of residents to city centers like Onitsha and Awka for greener pastures. Bare surfaces indicated a negative change of -7% from 1986/2000 and a positive change of 5% in 2000/2013 which occurred because Ihiala is the administrative capital of the zone consisting of cities Amorka, Okija, Mbosi, Isieke, Orsumoghu, Ubuluisuzor and Uli. Built up land increased by 15% and dropped to 8% from 1986/2000 to 2000/2013 respectively. This is because of the presence of Anambra State University Uli, Madonna University Okija and Atlantic International University Okija that attracted rapid development of buildings for accommodation of students within the community. Ihiala city expanded physically as there was an increase in the land consumption rate from 5.658 in 2000 to 6.798 in 2013 and the land absorption coefficient by 1.848 x 10 -5 between 2000 and 2013. Gully areas covered 3% in 1986/2000 and dropped to -7% in 2000/2013. This may have resulted from the State Government Erosion Program. Water bodies covered -3% in 1986/2000 and dropped to 0% in 2000/2013; the low percentage of the water bodies was because the study area was imaged during dry season in order to avoid cloud cover in the Landsat imagery.
CONCLUSION
Land use and land cover changes detection were conducted in the study areas and it was observed that variation in Landuse/Landcover would only be brought into limelight through change detection studies. This fact could be seen in the periodic changes in areal extent of the designated Land uses. This finding however, establishes the urban growth in Onitsha and Awka compared to Ifite-Ogwari and Ihiala. Although, the out-come of the Landuse/Landcover changes was presented according to range and annual changes, it is imperative to conclude that the higher Landuse/Landcover development in the study area and impliedly in the four stations was apparent in the range period of 2000 to 2013.
Moreover, within the 27 years used as study period positive changes in Landuse/Landcover development were witnessed in Built-up areas and Bare surfaces while Vegetation and Gully areas has negative trends. The water bodies’ area witnessed little or no change between 1986 to 2013. Policy makers, urban planners and other relevant government agencies intervention are needed to avoid poor usage of land and its resources.
CONFLICT OF INTERESTS
The authors have not declared any conflict of interests.
REFERENCES
|
Aldrich RC (1975). Detecting Disturbances in a Forest Environment, Photogramm. Engng of Remote Sensing 41:44 Howarth, J.P and Wickware GM (1981). Procedure for Change Detection Using Landsat Digital Data. Int. J Remote Sensing 2:277. |
|
|
|
|
|
Commoner B (1972). The environmental cost of economic growth. In R.G. Ridker (Ed.) Population, resources and the environment (pp. 339-363). (Washington DC: Government Printing office). |
|
|
|
|
|
Environmental Systems Research Institute (ESRI) (2009). ENVI 4.7 and ENVI EX.ITT Visual Information Solutions. ESRI, Redlands, California. USA. |
|
|
|
|
|
Hobbs NT, Schimel DS, Owensby CE, Ojima DS, (1991). Fire and grazing in the tall grass prarire: contingent effects on nitrogen budgets. Ecology 72, 1374-1382. |
|
|
|
|
|
Jenson JR (1996). Introductory Digital Image Processing: A Remote Sensing Perspective, second Edition. Prentice Hall. New Hersey. |
|
|
|
|
|
Kuleli T (2005). Change Detection and Assessment Using Multi Temporal Satellite Image for North-East Mediterranean Coast. tt:/wwwgisdevelopment.net/application/nrm/Mnm/tuncey-artpf.htm accessed 3/3/2008 |
|
|
|
|
|
Kumar G, Sena DR, Kurothe RS, Pande VC, Rao BK, Vishwakarma AK, Bagdi GL, Mishra PK (2014). Watershed impact evaluation using remote sensing. J. Current Sci. 106(10):1369 -1378. |
|
|
|
|
|
Meyer WB, Tuner II BL (1992). Human Population Growth and Global Landuse/Cover Change. Annual Review of Ecology and Systematics 23, 39-61. Doi:10.11456/annurev.eso23.110192.000351. |
|
|
|
|
|
National Bureau of Statistics (2011). Annual Abstract of Statistics 2011. Pg. 27. |
|
|
|
|
|
NIMET (2014). 2014 Seasonal Rainfall Prediction (SRP). S & E Consulting. pp.9-15. |
|
|
|
|
|
Masi JF (1999). Monitoring Land-Cover Changes a Comparison of Change Detection Techniques. Int. J Remote Sensing 20:139-152 |
|
|
|
|
|
Richards JF (1990). Land transformation in the Earth as transformed by human action. Cambridge University Press, New York. Pp. 163-178. |
|
|
|
|
|
Singh A (1989). Digital Change Detection Techniques Using Remotely Sensed Data. Int. J Remote Sensing 10:988-1003. |
|
|
|
|
|
Stern P, Young OR, Druckman D (Eds) (1992). Global Environmental Change: Understanding the Human Dimensions. Natural Research Council, Commission on Behavioral and Social Sciences and Education, Committee on Human Dimension of Global Change. Natural Academy Press, Washington, DC. |
|
|
|
|
|
Thomas A, Ayuk J (2010). Land Use/ Land Cover Mapping of the Kulis-Eerste River Catchment (Western Cape) Through an integrated Approach Using Remote Sensing and GIS pp 77-78 In: Application of Africa: Results from the TIGER Initiative. IHP-VII Technical Documents in Hydrology 85 UNESCO Working Series SC-2010/WS/15 Paris. |
|
|
|
|
|
Turner II BL (1989). The Human causes of global environment change. In: Defries RS, Malone T (Eds), Global change and Our Common Future: Papers from a Forum. National Academy Press, Washington, DC, pp. 90-99. |
|
|
|
|
|
Turner II BL, Meyer WB (1991). Land use and Land cover in global environmental change: consideration for study. Int. Soc. Sci. J 130, 669-679. |
|
|
|
|
|
Weeks JR (2003). Chapter 17 Using Remote Sensing and Geographic Information Systems to Identify the Underlying Properties of Urban Environment. In Champion T. and Hugo G.,New Forms of Urbanization: Beyond the Urban-Rural Dichotomy. Aldershot, UK: Ashgate Publishing Co. (A Publication of the International Union for the Scientific Study of Population). |
|
|
|
|
|
Wikipedia (2014). http://en.wikipedia.org/wiki/Anambra_State |
|
|
|
|
|
Yeates M, Garner B (1976). The North American City, Harper and Row Pub. New York. |
|
Copyright © 2024 Author(s) retain the copyright of this article.
This article is published under the terms of the Creative Commons Attribution License 4.0


