ABSTRACT
The purpose of this study is to evaluate the viability of wildlife corridors between the Benue National Park and the Faro National Park through the hunting areas, by identifying the main threats to their integrity, mapping of land use, characterization of their flora and the wildlife inventory that frequents these corridors in order to propose measures for their sustainable management. Field observations, land use mapping from the 2016 Landsat 8 image classification, and 60 floristic surveys at six sites (corridors) on 20 m × 20 m plots treated under R resulted in the following results: nine types of activities were identified, including logging, agriculture, grazing and forestry. With ggold panning the main threats to corridors, the species mostly used by these farmers are Piliostigma thonningii (82.674 ± 4.24), Combretum sp. (78.18 ± 4.01) and Tamarindus indica (75.06 ± 3.85) among the most threatened woody species. On the floristic level, vegetations under the influence of anthropic activities present a large number of rejections, a small number of adult stems. The Shannon diversity index varies between 4.30 and 5.07 in all corridors. On the other hand, the index of equitability varies from 0.50 to 0.59. On the faunal plan, 204 individuals, belonging to 12 animal species, grouped into 6 families frequent the corridors. This number is well below what was achieved in 2010 when there was a decrease of 1024 individuals in the corridors, a decrease rate of 83.38%. In the face of these threats, which risk irreversibly damaging the corridors, a restoration and conservation plan for these corridors that will integrate community management based on strengthening the participatory approach is essential.
Key words: Corridor, planning, national park, biodiversity, inventory, socio-economic surveys, anthropogenic activities, north.
The fragmentation and destruction of habitats that result from human activities are considered to be the major causes of biodiversity loss. This erosion is at the heart of a major challenge that mobilizes the world community
(Béné and Lawan, 2006). The World Conference on Sustainable Development held in Rio de Janeiro in 1992 and the V World Parks Congress in Durban in 2003 presented several measures to preserve biodiversity. These include networking, maintaining or rehabilitating corridors to address the shortcomings of past conservation strategies which were based on the protection of isolated areas, and the effects of ecosystem fragmentation on the loss of natural resources (Carrière et al., 2003). These conservation measures are at the heart of new public policies for conserving territories and wildlife. However, their implementation and monitoring areis not always ensured in developing countries due to the various circumstances and pressures. An analysis of the integrity of these devices is essential to evaluate the effectiveness of planning and conservation , esSpecially given that the critical role of corridors in the efficient conservation of fragmented landscapes and wildlife, and the efficacy of conservation plans in addressing them is crucial (Kiffner et al., 2016).
Conservation biologists recommend increasing connectivity between habitats to maintain, and if possible, improve the viability of populations of target species (Bennett, 1999). The current option for restoring connectivity is to establish corridors between disconnected habitats. The biodiversity conservation corridor is derived from the island biogeographic model (McArthur and Wilson, 1967) and the metapopulation theory (Bonnin, 2008). A corridor is a linear element of the landscape connecting habitats within a rather unfavorable environment (Kindlmann and Burel, 2008); it is a narrow piece of habitat, linear or not, that connects larger habitat patches and is surrounded by a non-habitat matrix (McArthur and Wilson, 1967). In general, corridors fulfill several roles: habitat (permanent or temporary), channel or corridor for the dissemination of species, filter, barrier, source (individuals emanating from the corridor) or wells (Forman and Godron, 1986; Bennett, 1999). Bennett (1999) prefers that the term be linked to that of a corridor to emphasize the function of conduit and that of landscape connectivity. The purpose of landscape linkages is to provide regional connectivity (Harris, 1985). Rosenberg (1995) cited by Narké (2017) notes a confusion in the use of the term corridor both structurally and functionally. On the one hand, the connectivity provided by the corridor is structural, in the form of a landscape link (Narké, 2017) and on the other hand, it is functional and contributes to the maintenance of metapopulations (Bonnin, 2008). In this study, we will focus on the structural aspect of corridors. Depending on the scales involved, the corridors interact on a given species to constitute either a passageway or an impassable obstacle.
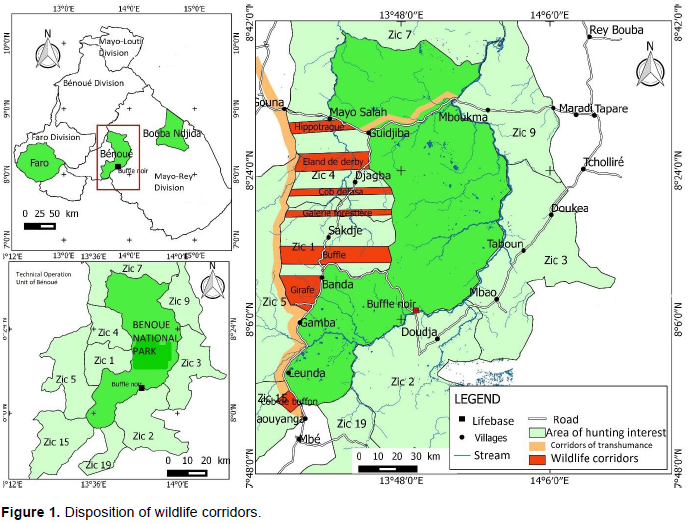
The region of North Cameroon is central to several socio-economic and environmental issues. 40% of its surface area is subject to nature protection regulations (3 national parks - Benue, Bouba Ndjidda and Faro, and 28 areas of hunting interest - ZIC). However, the sustained demographic growth of this region, which increased from 7.5 habs/km² in 1976 to 31 habs/km² (RGPH, 2010) due to the massive arrival of migrants from the more populated regions of the far North of Cameroon were accompanied by the progression of a pioneering agricultural and pastoral front. These events had major environmental consequences, particularly for protected areas and their surrounding areas. Indeed, the size of the areas cleared annually and the consequent fragmentation of space following these clearings limits the mobility of wildlife in the region. For example, conservation corridors (Figure 1) have been negotiated and created along the national No.1 to facilitate the passage of wildlife between these protected areas (Danah, 2001).

After their installation, these devices come under increasing anthropic pressure due in part to uncontrolled land occupation. These corridors implemented through the program of Conservation and Management of Biodiversity in Cameroon (PCGBC) resulted from the new conservation orientation initiated in 1999 and based on the ecoregion approach (Saleh, 2012). Indeed, this project named GEF-Biodiversité aims at the conservation and development of the Benue complex composed of the Benue National Park (BNP) and adjacent hunting areas (Saleh, 2012). This project is composed of NGO implementing agencies like the World Wide Fund for Nature (WWF), the Dutch Society for Development (SNV) and the Cooperation Fund (FAC). The project organized populations which led to micro-zoning, the negotiation of rules and agreements as well as the installation of corridors, their materialization and management mechanisms (Saleh, 2012). But the non-consideration of migrants in the process will be decisive for the sustainability of conservation systems.
Reduction of the activities of the executing agencies of the program and the cessation of these in 2011, as well as the small number of eco-guards with very little motivation, are leading migrant populations to increase their numbers, in search of vital space to take storm the corridors and extend their fields. Thus, biodiversity degradation has progressed from the simple nibbling of corridor margins to a real establishment of the fields in the corridors compromising the mobility of animals to move from East to West of ZIC 1, 4 and 5. These threats have led to the extreme degradation of the fauna and flora biodiversity. The critical situation of these corridors raises questions about the viability of these tools, which are supposed to ensure the mobility of wildlife.
Several studies have been conducted on the management of plant and wildlife resources in this area. Siroma (2002) identified wildlife corridors in ICAs (cynegetic hunting areas) 7, 8 and 14 of the Benue National Park Complex. Tsakem (2006) proposes to improve the income of the neighboring populations to be able to conserve more of the natural resources. Ndamè (2007) indicated that the exclusion of riparian populations by the public authorities in the management of natural heritage would pose a major challenge in the sustainable management of resources. The impact of human activities on protected areas in the northern region, especially the corridors in the Benue National Park complex, has been analyzed by Siroma (2007). Vounserbo (2010) made an inventory of the corridors of cynegetic hunting areas 1 and 4 peripheral to the Benue National Park. The studies highlight that these corridors are under multifaceted pressure, but play their roles in moving wildlife from one protected area to another. But, what about the current state of the corridors? This article attempts to evaluate the viability of these corridors by identifying the main threats to their integrity through the mapping of land use (2016), characterization of the flora and the wildlife inventory that frequents these corridors in order to propose measures for their sustainable management.
Location of the study area
The Benue National Park (BNP) is located between 7° 55 to 8° 40 north latitude and 13° 33 to 14° 02 east longitude. It is part of the network of protected areas in the region of North Cameroon which has 3 national parks, 28 areas of hunting interest, 2 zones of hunting interest in co-management and 2 zones of hunting interest in community management. BNP covers an area of 180,000 ha and is limited: to the north by Mayo Lade and Laindelaol courts; to the south by the course of Mayo Dzoro; to the East by the course of the Benoue River; and to the West by the Ngaoundere - Garoua N ° 1 main road, from the Mayo Dzoro bridge to the Banda village; the old Ngaoundere-Garoua Road, from Banda to ex-Djaba; by trunk road No. 1, from ex-Djaba to the bridge over Mayo Salah through the course of Mayo Salah until the confluence with Mayo-Lade.
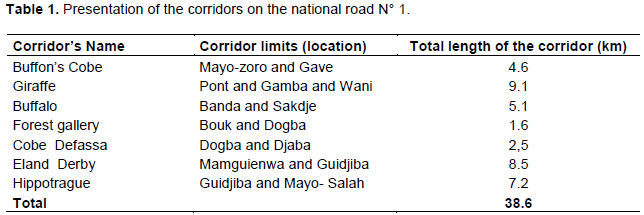
The periphery of the BNP includes the 8 areas of hunting interest (ZIC 1, 2, 3, 4, 5, 7, 9 and 15), among which are ZIC 1 and 4 for the co-management between the MINFOF (Ministry in charge of wildlife). The riparian population have respective areas of 39,552 ha and 40,640 ha (Tsakem, 2006). These two areas (ZIC 1 and 4) and the park constitute the sites of this study. The agreement signed between the local populations and the Ministry in charge of wildlife stipulates that management of these areas must be done jointly by both parties. The actual limits of these ZICs are defined by decree N° 0580 / A / MINEF / DFAP / SDF / SRC of August 27, 1998. According to Siroma (2007), seven corridors have been created and materialized on the national road N° 1 for a total length of about 39 km. In our work, we chose six of the seven and neglected Buffon's cobe corridor whose boundaries are no longer in good condition (Table 1).
Methods
The methodological approach is based on the identification of threats, the mapping of land use, the characterization of the flora and the monitoring of the wildlife species that circulate in the corridors.
Identification of threats to corridor integrity and land use mapping
Thus, logging, poachers' encampments, setting up fields, pastoral activities, gold panning, and honey extraction observed in the corridor were identified. This step consisted in identifying the different human activities. Identification of threats to the corridor includes marking a starting point at each end of the corridors, from which we head inland, and at every 5 km, we made 90° angle inside the corridor and continued parallelly to the axis of the corridor. After wards, we took a perpendicular angle to exit the corridor. Given the short length of the Forest Gallery Corridor, we divided it in two. The various human activities (logging, poaching camps, field installation, pastoral activities, gold panning, honey extraction, etc.) observed in the corridor were noted. Using GPS points, the area of each site marked by anthropogenic activities was measured in order to quantify the extent of these activities. Whereas the land use mapping that follows the identification of corridor threats is based on the use of Landsat 8 (Coordinates) image data (30 m spatial resolution) from December 2016, the methodology used is based on analog and digital processing of satellite images predicated on the recognition of objects from field observations (Aoudou, 2010).
Characterization of the flora
Characterization of flora aims to better appreciate the floristic state of the various corridors. The collection of floristic data was made in each corridor of 20 m x 20 m, that is, 400 m2 each, for a total of 60 floristic surveys for all corridors. Surveys are scattered throughout the study area.
In each plot, the plant species were identified to measure the height and the diameter of the trunk at 1 m, 30 for species larger than 2 m and to count all the species in the plot including thoseat which are less than 2 m high. The vegetation analysis focused on floristic diversity and its structures determined from the following parameters:
(i) Ecological profile
This was done using the abundance parameter. Abundance refers to the total number of individuals of the species. Absolute abundance is the total number of individuals of the species over the total number of individuals in the study site. Relative abundance is the ratio of absolute abundance to the total number of individuals in the community.
(ii) Basal area
It is given by the formula: Gi = π DH2 / 4 where Gi is the basal surface of the species i, and DH is the diameter of the species.
(iii) Diversity and equitability
Specific diversity is analyzed using diversity indices (Magurran, 1988; Kent and Coker, 1992). They are:
(a) Shannon index
It is an indicator of specific wealth. It is given by the formula:
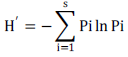
H': Shannon Biodiversity Index
i: a species of the environment
p (i): proportion of a species i relative to the total number of species (S) in the study milieu (or specific diversity of the environment) which is calculated as follows: p (i) = ni / N where ni is the number of individuals of the species and N is the total number of individuals, all species combined.
(b) Simpson's index
It calculates the probability that two individuals selected randomly in a given environment are of the same species.
D = Σ Ni (Ni-1) / N (N-1)
D: Simpson's index
Ni: number of individuals of the given species.
N: total number of individuals.
(c) Jaccard’s coefficient of similarity
It enables comparison of the different plots and is given by the formula:
PJ = c / (a + b-c) x 100
Where a = number of species from list a (Medium 1); b = number of species in list b (Medium 2), c = number of species common to both environments.
The similarity between habitats is expressed by a high value of this index.
The Hamming distance proposed by Daget cited by Le Floch (2007) is added to this index to compare floristic records according to the formula:
H = 100 – PJ
where PJ is the Jaccard index. The selected thresholds are shown in Table 3.
Interclass analysis of AFC (component factor analysis) under R software
The interclass analysis of the AFC links a table of descriptive variables grouped together in a table x (number of species) species on the one hand, and a table of explanatory variables that can explain the structure of the communities on the other hand. This studies the differences existing between the classes while optimizing the distribution of the centers of gravity of the classes. It is represented by the factorial map (space with two or three dimensions with n dimensions) with each survey surrounded by its species and each species surrounded by surveys. The study of maps makes it possible to isolate groups of records that are closest to each other in space because of their floristic composition. This is how the nearby corridors were determined by their floristic composition. The interclass analysis of the AFC was applied to the 60 measurements taken in the corridors.
Determination of the number of wildlife visiting the corridors
Direct and indirect observations (footprints or droppings) have been used to determine the numbers of wildlife that frequent the corridors. Information on the species, number of individuals and the time of observation were noted on the collection sheet. This method was applied by the WWF/PSSN in 2010. The information collected at WWF and the interviews with resource persons made it possible to trace the evolution of the number of wildlife in the corridors.
Des données cartographiques
To produce the land cover map and evaluate the percentage of land use of the different types of space occupation, remote sensing through the analog and digital processing of the satellite imagery was used, based on the recognition of objects from field observations (Aoudou, 2010). The land use mapping that follows the identification of corridor threats is based on the use of 2016 Landsat 8 image data, with 184/54 coordinates and 30 m spatial resolution.
Identification of threats related to corridor survival
Nine types of human activities have been identified in the corridors. These include logging, poaching, grazing, farm planting, gold panning, habitat installation, use of trails and coal ovens across the corridors. Woodcutting is the most popular activity and alone accounts for 52.63% of the observed activities. Wood is cut either for cooking food or for sale, and for the manufacture of coal or agricultural land clearing. Figure 2a, b and c illustrate the different techniques of tree cutting. Indeed, wood is the main source of energy used, and also represents a significant source of income for the population that effuses through the National road No. 1 to truckers and other people. Its collection was formerly practiced in Multiple Use Zones (MUZ). However, increase of the population and arrival of the migrants led to excessive cutting of the wood. This cut is now done inside and outside the MUZ. The most commonly used are: Isoberlinia spp., Acacia spp., Vitex spp., Anogeissus leiocarpus, Hymenocardia acida.
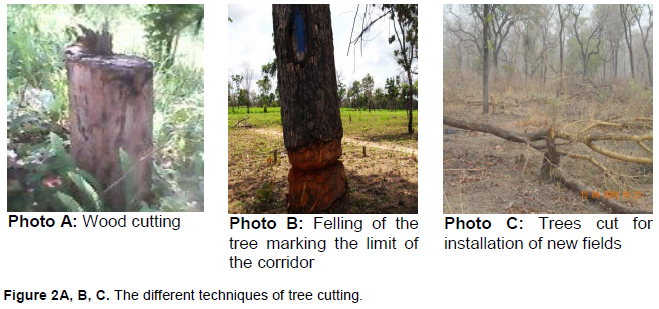
Agricultural practices
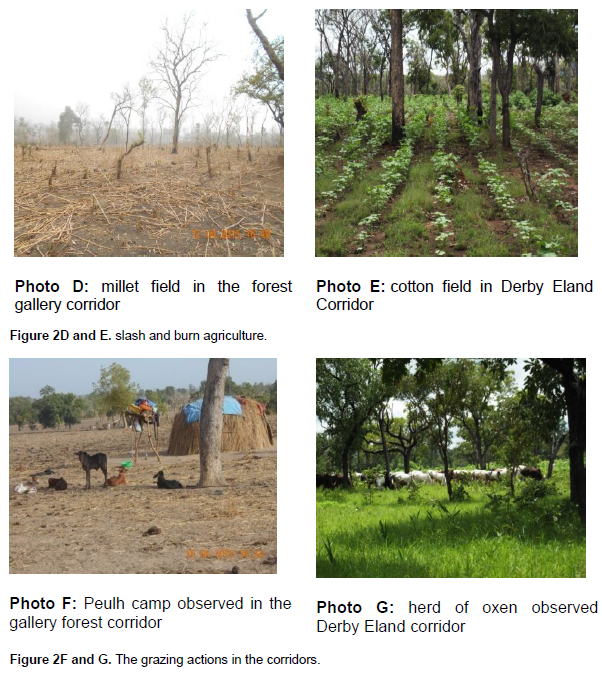
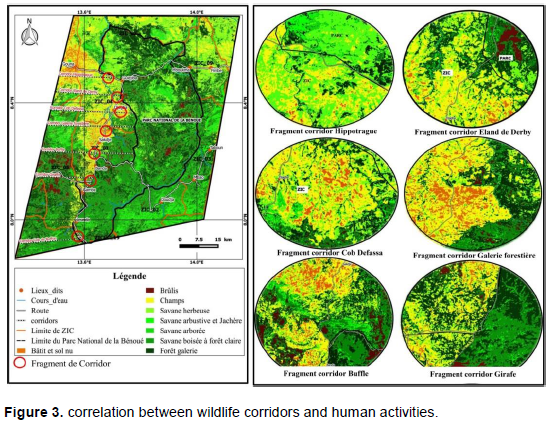
Agriculture accounts for 22.44% of the observed activities. The main crops grown in the locality are cotton (Gossypium hirstum) grown largely by migrants, maize (Zea mays), millet (Sorghum spp.), Groundnut (Arachi shypogea) and yam (Dioscorea spp) which is more practiced by natives, and cowpea (Fasiolus spp) which is a slash and burn agriculture (Figure 2D and E). We observed a total of 81 farms. The Giraffe Corridor alone records 31 observations on the Eland Derby Corridor, comprising six farms. Expansion of agriculture in the corridors is due to the fact that there is more and more numerous and uncontrolled migrants installing farms in the corridors, though forbidden from use. Once free, corridors such as the Buffalo Corridor, the Hippotrague Corridor and Cobe Defassa are experiencing an increase in human activity. This remarkable increase in this activity is due to lack of awareness of the riparian population to monitor the integrity of the corridors (Figure 3).
Livestock
This is the third activity that accounts for 7.2% of the observed threats. Figure 2F and G illustrate the grazing actions in the corridors with all corridors affected by this activity. In this study, 25 livestock cases were observed. The Giraffe and Buffalo corridors are more intensively grazed. Extensive breeding poses a significant threat to wildlife with the risk of contamination between pets and wildlife through disease and destruction of wildlife habitat. This activity is reflected by the presence of shepherd camps near or in the corridors, herds of grazing cattle and the transhumance tracks observed inside the corridors. Similarly, pruning of woody species such as Afzelia africana, Ficus sycomorus, Daniellia oliveri and Pterocarpus sp. by breeders for feeding animals provides evidence of livestock presence. This pruning disrupts habitat and therefore threatens biodiversity in BNP and its periphery. The inadequacy of surveillance teams aggravates this situation. Farmers are no longer afraid of the threats and sanctions imposed by the eco-guards. They negotiate for money to graze in the corridors and in the park.
Other forms of anthropizations
In order of importance, tracks of gold panning, coal kilns, human habitat, honey extraction, and poaching are the other important anthropogenic threats. Thus, 26 cases of trails were observed which constitute 6.37%. This activity has increased considerably compared to previous years, with the population using track to go cut wood in their fields, looking for gold.
The gold panning is done in the beds of Mayo and is manifested by the upheaval of the earth in the bed of Mayo. It is more practiced in the village of Djaba and less in the village of Guidjiba. The rare observation (3.32%) of this activity can be explained by the fact that our study was carried out during the dry season, resulting in a lack of water to wash the gold. Poaching has reduced compared to 2007 when there were five seizures of poaching equipment such as firearms, spears, cartridges and even a motorcycle. This decline may be due to lack of animals in the corridors that bring poachers to the park. These observed practices are at the origin of the degradation of the corridors. The presence of humans in environment influences the movement of animals either to reproduce or to feed or seek a more secure environment.
Table 2 shows that the most affected corridor is the forest gallery with 25.48% of observed threats. This is due to the fact that the migrants settled on the side of Dogba come to their fields and cut the wood in this corridor. The forest gallery is followed by the Girafe corridor with 23.5% of threats observations. These threats have been more widely observed in Banda-Wani where people are coming to fetch wood for coal production. Also, the corridors Cobe Defassa and Hippotrague each with 15% of observations and finally the Eland Derby corridor is the least attacked corridor. Only 11.6% of threats are recorded, which explains the high frequency of animals in this corridor.
According to our investigations, Piliostigma thonningii (82.674 ± 4.24), Combretum sp. (78.18 ± 4.01) and
Tamarindus indica (75.06 ± 3.85) are the most endangered woody species. This is due to their overuse for different uses such as firewood (Piliostigma thonningii), livestock (Afzelia africana), coal production (Terminalia sp.), Handicraft (Boswellia dalzielii), construction (Anogeissus leiocarpus), traditional medicine (Piliostigma thonningii), and also food (leaf of Balanites aegyptiaca).
Floristic composition of corridor’s vegetation
Sixty surveys were conducted in all corridors of the UTO Benue. To this end, 2869 woody individuals were divided into 99 species, and 70 kinds and 36 families were inventoried. The Forest Gallery corridor is the richest in biodiversity with 581 individuals, 57 species, 37 kinds and 26 families. It is followed by the Hippotrague and Cobe Defassa corridors, which number 511 and 466 individuals, 58 species, 56 kinds and 28 families.
Indices and equitability
The number of woody species observed and the Shannon-Weaver and equitability indices calculated for all corridors show that all corridors are diversified; also, the Buffalo corridor has a higher index (5.07). This high diversity reflects the presence in each corridor of a multitude of plant species that are relatively abundant. This offers animals a variety of foods and shelters. Equitability index values are consistent across all corridors. These values reflect a distribution of individuals within species in each corridor.
Comparison of different vegetal formations
The Jaccard test (Table 3), which estimates the homogeneity or heterogeneity of the vegetation, shows a strong floristic difference between the Buffalo and the Forest Gallery (61.8%), and average between Hippotrague and Cobe Defassa (50.8%). This reflects a relativity heterogeneity between these environments (corridors). However, this value is low between Eland de Derby and Giraffe (30.8%), as well as between Forest Gallery and Giraffe (32.2). The floristic difference is very small between Cobe Defassa and Eland Derby (12.5%). The very slight floristic difference between Cobe Defassa and Eland Derby reflects a large number of similar species that they contain.
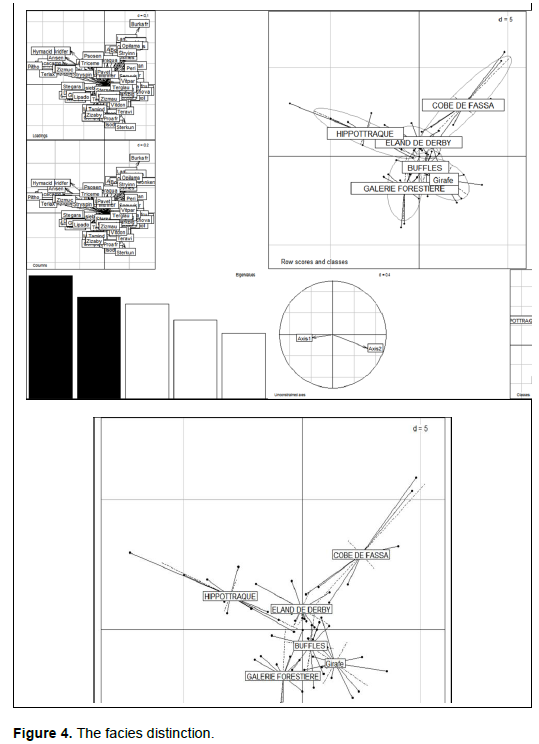
The interclass analysis of the AFC highlights the particular structure of plant formations along the corridors. Indeed, the examination of the factorial axes 1 and 2 of the diagram (Figure 4) makes it possible to individualize two large sets following a North / South gradient. These are the corridors located north of the axis (Cob de Fassa, Eland derby, Hypotrague) which are distinguished from those located in the south (Buffalo, Gallery forest and Giraffe). The corridors located in the north are characterized by species such as: Burkea africana, Strycknos inocua, Monotes kerstingii, Anona senegalense, and Hymenocardia acida. Corridors in the south are mainly composed of: Vitellaria paradoxa, Terminalia glaucescens, Vitex doniana, Isoberlinia doka, Prosopis africana, Ziziphus mucronata (Figure 5).
The horizontal structure of the vegetation is dominated by individuals with a diameter between 10 and 20 cm. This class is highly represented in the Hippotrague and Buffalo corridors (114 and 110 individuals / ha). In the Derby Eland Corridors and Forest Gallery, the number of individuals in this class is 38 individuals/ha and 52 individuals/ha, respectively. Woody trees with a diameter greater than or equal to 30 cm are less numerous in the vegetation. Those of diameter between 20 and 30 cm are found in the corridors Buffalo and Giraffe. This overrepresentation of discards reflects the effect of logging, to which can also be added the action of bush fires and overgrazing. The highest basal area is found in the Forest Gallery Corridor (7530.29 m2/ha) followed by Cob Defassa (6992.32 m2/ha). The Giraffe corridor occupies a very low basal area of 3936.10 m2/ha, due to the fact that it consists largely of rejects. The low basal area of the Eland Derby Corridor (5153.33 m2/ha) is due to the scarcity of trees that are destroyed for the benefit of crops.

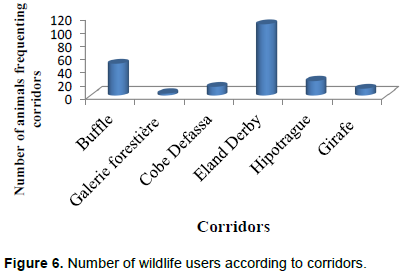
Corridor use by wildlife
Here, we counted a total of 204 individuals of different animal species in the six corridors. These individuals are unequally distributed among these different corridors. Figure 6 illustrates the distribution of animals in each corridor. The Derby Eland Corridor (108) and Buffalo (48) are the most frequented by wildlife while Giraffe Corridor (10) and Forest Gallery (3) are less crowded. This difference in corridor use by wildlife can be explained by the fact that villages near the Girafe Corridor and the Forest Gallery are more populated than those near the corridors Hippotrague, Eland de Derby and Buffalo. It may also be noted that the less used corridors are more or less those with a small area. The proximity of the most used corridors to the BNP also explains this difference. Indeed, the corridors connected directly to the park (Eland de Derby and Buffalo) are the most frequented by the fauna unlike those distant from the park (Gallery Forest and Giraffe).
Diversity of wildlife species observed in corridors
These are animals that frequent the corridors installed in hunting areas 1 and 4, ranked by order and by family in each corridor. Thus, 12 animal species belonging to 6 families and 4 orders were identified. The artiodactyls which are the most diversified order in terms of species with 2 families and 8 species is 87.75% of the observations, followed by Primates (8,33), carnivores (2 families and 2 species) with (3,43%) and rodents (0.49) that are very poorly represented. We note the absence of some emblematic species such as giraffe (Giraffa camelopardalis), lion (Panthéra leo), and elephant (Loxodonta africana africana), lycaon (Lycaon pictus).
Variety of animals observed by class of protection
The species observed were divided into protection classes (A, B and C). Thus, Class B is most prevalent in all corridors with 85.29% being dominated by Buffon's Cobe that are observed in all corridors. The strong presence of Cobe de Buffon may be due to the disappearance of their predators, which are the panther and the lion in the area. It is followed by classes C and A which represent respectively 8.82 and 5.88%. Class A is represented only by Grimm's duiker and reedbuck and observed only in the Eland corridor of Derby and Giraffe. The strong presence of classes B and C may be due to the fact that these species are highly mobile compared to class A animals, which are generally large. Another reason could be related to habitat fragmentation and poaching that is more pronounced on Class A species for their meat and trophy. According to our surveys, the absence of certain species could be explained by the establishment of fields in their habitat and poaching prevents them from frequenting these corridors of passage. It can be explained by the seasonal migrations of certain animals in the dry season in search of food, water and sometimes mineral salts inside the park or to another nearby park (Table 4).

Influence of human activities on fauna and flora
The monitoring of the corridors shows that there is a strong dependence between wildlife corridors and human activities. Indeed, the more important they are, the less wildlife is present in the corridor affected by these activities. Both variables have a high correlation (R = -0.89 to 0.05%). Other environmental factors must also act in this distribution, especially the presence of water points, the hunting activity, and the search for quality forage. When threats are low the number of animals observed is large in the corridor. This is the case of Buffalo corridors, Eland de Derby. With regard to the Forest Gallery and the Giraffe Corridor where threats are very high, the number of animals in these corridors is small compared to other corridors; this reflects the strong negative correlation between human activities and the presence of wildlife in the corridors. These activities have a negative impact on wildlife. Because the destruction of their habitat leads them to flee these environments. It appears that between 2010-2015, the decline in animal numbers is observed in all the corridors of the BNP. This drastic decrease is most noticeable in the corridors, Forest Gallery with a difference of 98.01%, Cobe Defassa (95.58%) and Hippotrague (93.31%). Other corridors such as Derby's Eland with 64.53% difference and Buffalo (70.73%) have experienced a decline in animals in five years but not accelerated as in other corridors.
On the other hand, the numbers of Buffalo Crab, Red-winged Dusky Beetle and Bubale increased respectively in the Derby Eland Corridor, from 27 individuals in 2010 to 56 in 2015, an increase of 51.79% for Buffon's Cobe, from 5 individuals to 19 individuals, that is, 73.68% increase and 4 individuals to 14 individuals in 2015, an increase of 71.43%. This can be explained by their high reproduction and also at a season very conducive to their mating, their diet and their living environment.
It should be noted that there is not only a decline in the number of animals in the corridors but also the rarity and even disappearance of some species in the corridors. The population explains this by the fact that human activities (poaching, planting of fields, breeding, uncontrolled cutting of wood and many other threats) have intensified over time, leading to the destruction of wildlife habitat. This drop in the number of animals in the corridors can be explained by the increase in population, due in part to the arrival of migrants from the Far North in search of fertile land. Another reason may be the inadequacy of personal surveillance, the means at their disposal and the lack of motivation of community guards who have becomeare corrupted by poachers.
Analysis of the integrity of the wildlife passage corridors established in the BNP hunting areas to facilitate the mobility of wildlife leads us to question its effectiveness in the context of human pressure. The main threats are: agricultural activities, extensive livestock rearing, firewood cutting, coal production, and artisanal gold panning. This last activity is very recent. All other threats have been identified by Siroma (2007) and Vounserbo (2010). It should be noted, however, that these threats have intensified to the extent that some corridors are completely transformed into growing areas and grazing areas. The occupancy map that we produced shows the extent of the degradation of these corridors.
The presence of fields in the corridors limits their attendance; in fact, the WWF studies since 2002, by Vounserbo (2010) and our field observations enabled tracing the evolution of the number of wildlife in the corridors. . The result is a decrease of wild animals in the corridors. The number of animals in the corridors increased from 1,735 individuals in April 2002 (WWF et al., 2002) to 1243 individuals in 2006 (WWF/PSSN, 2010), a difference of 492 individuals in four years. Between 2010 and 2015, there was a decrease of 1024 individuals, a decline rate of 83.38% in five years. Moreover, there is not only the quantitative but also qualitative decrease. Indeed, it has been noted that many species no longer frequent the corridors, for example the Orebi, the Buffalo and the Green Monkey. These species were observed in 2010 by Vounserbo.
The review of our results has some limitations that merit further analysis to restore these corridors. This is for example, the tracking by night cameras of animals present in the corridors; systematic evaluation of the roles of conduits for the movements played by these corridors; but also the role of the habitat (source or sink), barrier or filter as well as the source of biotic and abiotic elements for the neighboring matrix (Forman and Godron, 1986; Santos et al., 2018). This in-depth reflection will also help to redefine the minimum size to maintain or restore so that these corridors can play their full role (West et al., 2016; FAO, 2006). These limits are similar to those highlighted by Berges [9] for whom the good functioning of an ecological corridor remains difficult to demonstrate because it is necessary to verify if the species is present in the corridor and to make sure that it moves from one end of the corridor to the other. A comparison of the respective frequency of passages through and outside the corridors prove that this displacement improves the survival of the population in the connected fragments and thus show a gene exchange between populations (Diren, 2008; Harris and Scheck, 1991).
This article aims to assess the viability of corridors for wildlife passage by identifying the main threats to their integrity, land use mapping (2016), characterization of their flora and wildlife inventory, and to frequent these corridors in order to propose measures for their sustainable management. The main threats are: agricultural activities, extensive livestock rearing, firewood cutting, coal production, gold washing, poaching and bushfire. The dominant plant formation is the wooded savannah; in total, 2869 woody individuals divided into 99 species, while 70 genera and 36 families were inventoried. The corridors are very diversified and the corridors located in the north (Cob de Fassa, Eland de Derby, Hypotrague) are distinguished from those located in the south (Buffalo, Gallery forest and Giraffe). These corridors are also characterized by a strong regeneration of ligneous plants in the site. The horizontal structure of the vegetation is dominated by individuals with a diameter between 10 and 20 cm. The ecological monitoring of corridor use shows a worrying drop in the number of animals, if nothing is done to stop this decrease, there is a risk of a downgrading of the corridors. Faced with this difficulty of managing biodiversity, many measures in terms of management and conservation plans must be taken. In particular, rigorous monitoring of migration is required; it is also necessary to develop communication mechanisms between actors such as natural resource managers, migrants, pastoralists, indigenous peoples and NGOs. Llastly, it is important to encourage more and more the recruitment of community eco-guards made up of village natives and the reduction of livestock pressure on the fodder of the corridors (FAO, 2006).
The authors have not declared any conflict of interests.
REFERENCES
|
Aoudou DS (2010). Suivi de l'évolution de la végétation ligneuse de la savane soudanienne dans haute vallée de la Bénoué au Nord-Cameroun. Thèse de Doctorat, Université de Ngaoundéré 307 p.
|
|
|
|
Béné BCL, Lawan A (2006). Suivi des espèces clés ou menacées dans le Parc National de la Bénoué et sa zone périphérique. Rapport d'étude WWF/PSSN Garoua 25 p. Ministère des Forêts et de la Faune. Avalable at:
View
|
|
|
|
|
Bennett AF (1999). Linkages in the Landscape: The Role of Corridors and Connectivity in Wildlife Conservation. Available at:
View
|
|
|
|
|
Bonnin M (2008). Les corridors biologiques : vers un troisième temps de la conservation de la nature. Paris, L'Harmattan, coll. Avalable at: View
|
|
|
|
|
Carrière S.M, Andriamahefazafy F, Dominique H, Méral P (2003). Les corridors, passage obligé?: l'exemple malgache. Available at:
View
|
|
|
|
|
Danah R (2001). Utilisation des corridors par la faune sauvage dans les zones Périphériques du Parc National de la Bénoué : Cas des Corridors de la ZIC N 01 en cours de négociation. Mémoire présenté en vue de l'obtention du diplôme d'Ingénieur des Eaux, Forêt et Chasse. Dschang (Cameroun). Département de foresterie UDs. 70 p.
|
|
|
|
|
Diren R (2008). Scot et Corridors Biologiques : Exemples d'intégration dans Quelques schémas de cohérence territoriale. 208 bis, rue Garibaldi 69422 LYON CEDEX 03.5-52 p. Available at:
View
|
|
|
|
|
Food and Agriculture Organisation (FAO) (2006). Comment concilier les activités humaines et la conservation de la faune sauvage. Commission des forêts et de la faune sauvage pour l'Afrique. Groupe de travail sur la gestion de la faune sauvage et des Aires Protégées.
|
|
|
|
|
Forman RTT, Godron M (1986). Landscape Ecology. John Wiley and Sons Ltd., New York. Available at:
View
|
|
|
|
|
Harris LD (1985). Conservation corridors: A highway system for wildlife. Florida Conservation Foundation, Environmental Information Center 10 p.
|
|
|
|
|
Harris LD, Scheck J (1991). From implications to applications: the dispersal corridor principle applied to the conservation of biological diversity. In: Nature conservation 2: the role of corridors Saunders DA Hobbs RJ (eds.), (Surrey Beatty) pp. 189-220.
|
|
|
|
|
Kiffner C, Nagar S, Kollmar C, Kioko J (2016). Wildlife species richness and densities in wildlife corridors of Northern Tanzania. Journal for Nature Conservation 31:29-37.
Crossref
|
|
|
|
|
Kindlmann P, Burel F (2008). Connectivity measures: a review. Landscape Ecology 23:879-890. Available at:
View
Crossref
|
|
|
|
|
Le Floch S (2007). Qu'entend-on par "fermeture du paysage" ? Paris, Ministère de l'Ecologie et du Développement Durable-Direction de la Nature et des paysages 26 p.
|
|
|
|
|
McArthur RH, Wilson EO (1967). The theory of island biogeography.Princeton, Princeton University Press. 203 p. Avalable at:
View
|
|
|
|
|
Narké JC (2017). Fragmentation des habitats et rupture de la connectivité écologique entre les parcs nationaux de la Bénoué et du Faro. Mémoire de Master II, Université de Maroua 144 p.
|
|
|
|
|
Ndamè JP (2007). L'aménagement difficile des zones protégées au Nord Cameroun pp. 145-161. Avalable at:
View
Crossref
|
|
|
|
|
Saleh A (2012). Un modèle et son revers: la cogestion des réserves de la biosphère de Waza et de la Bénoué dans le Nord-Cameroun. Thèse de Doctorat, Université Le Mans (France). Avalable at:
View
|
|
|
|
|
Santos JS, Leite CC, Viana JC, dos Santos AR, Fernandes MM, de Souza Abreu V, do Nascimento TP, dos Santos LS, de Moura Fernandes MR, da Silva GF, de Mendonça AR (2018). Delimitation of ecological corridors in the Brazilian Atlantic Forest. Ecological Indicators 88:414-424.
Crossref
|
|
|
|
|
Siroma J (2002). Identification des couloirs de passage de la faune sauvage dans les ZIC 7, 8 et 14 du Complexe du Parc National de la Bénoué 35 p
|
|
|
|
|
Siroma J (2007). Impact des activités humaines sur les aires protégées de la province du nord: cas des corridors dans le complexe du parc national de la Bénoué; mémoire de fin d'étude en vue d'obtention du DESS; UDs; CRESA FORET- BOIS, Cameroun 87 p.
|
|
|
|
|
Tsakem SC (2006). Contribution à l'aménagement du parc National de la Bénoué et au Développement Rural des Zones Cynégétique à Cogestion (N° 1 et 4) au Nord- Cameroun. Mémoire DES en Gestion des ressources animales et végétales en milieux tropicaux. Université de Liège 68 p.
|
|
|
|
|
Vounserbo E (2010). Etat des lieux des corridors des zones d'intérêt cynegetiques 1 et 4 peripheriques au parc national de la Bénoué (nord, Cameroun) 80 p
|
|
|
|
|
West S, Cairns R, Schultz L (2016). What constitutes a successful biodiversity corridor? A Q-study in the Cape Floristic Region, South Africa. Biological Conservation 198:183-192.
|
|
|
|
|
WWF, SNV, FAC, MINEF (2002). Parc national de la Bénoué : plan d'aménagement du parc et de gestion de sa zone périphérique. Garoua-Cameroun 125 p.
|
|
|
|
|
WWF/PSSN (2010). Braconnage : Arrêtons le massacre ; trimestriel d'information No003 ; projet WWF savane soudaniennes du Nord ; Garoua-Cameroun 11 p
|
|