Full Length Research Paper

ABSTRACT
In many African countries, spatial inequalities in the provision and distribution of social services can be explained by a myriad of factors including the development approaches adopted in their colonial history. This paper explores the spatial inequality among cities in Northern and Southern Ghana as evident in the availability of infrastructural facilities such as health, education, telecommunication, and potable water. Using secondary data from various government documents, the paper sought to explain the contours of spatial inequality among six major and strategically located cities in Ghana- three each in northern and southern parts of the country. The paper uses Lorenz curve as the main technique in establishing spatial inequalities among the selected cities. The paper reveals that provision of and access to schools, hospitals and other social services tend to favour the southern parts of the country hence influencing the spatial distribution of population. This dichotomy took its roots from the colonial administration, which favoured the development of the mineral rich parts of Ghana to serve the interests of their metropolitan markets. Unfortunately, this skewed spatial development approach has been perpetuated by all post-independence governments due to their subtle but continuous dependence on their colonial masters. The paper recommended investments in intermediate settlements in the three northern regions to serve as service centres to stimulate the development of Northern Ghana.
Key words: Spatial inequalities, disparities, infrastructural facilities, cities.
INTRODUCTION
UNDERSTANDING THE NATURE OF SPATIAL INEQUALITY
Spatial inequality refers to a “condition in which different spatial or geographical units are at different levels on some variable of interest, usually (average) income” (Lall and Chakravorty, 2004). Spatial inequalities can also be defined as the uneven distribution of economic and social indicators of human wellbeing within or among geographical units such as countries, cities, rural/urban areas, and regions (Aryeetey et al., 2009). Aryeetey et al. (2009)’s definition of spatial inequality relates more to the socio-economic states of wellbeing and condition pertaining to a geographical unit and not the mere measurement and comparison of the indicators depicting those states. However, spatial inequality in this sense requires a deeper understanding and explanation of the concept of space and spatial differentiation.
The concept of space began to feature in the study of inequality in limited ways (DeVerteuil, 2007; Gotham, 2003; Lobao, 1990; Lobao et al., 2008; Tickamyer, 2000). The various theories of economic geography provide different causal explanations for spatial inequality and elicit different policy responses to combat inequality. In general, spatial inequality is the net result of the balance of forces of concentration and dispersion. For example, location and landscape features shape the distribution of infrastructure and public goods, which leads to spatial inequalities between regions (Escobal and Torero, 2005). Kim (2008) argues that spatial inequality is fundamentally determined by the location decisions of the state. Kim’s assertion reflects the case in most African countries where most locational decisions are spearheaded by state and responded to by private individuals, households and businesses. He argues that firms choose locations to maximize profits whereas households do so to maximize job market outcomes and utility (Kim, 2008).
Spatial inequalities are multidimensional. This is because aside the traditional forms of inequalities, new forms of inequalities have emerged. The traditional forms range from different levels of human capabilities and opportunities, participation in political life, consumption, and income, to disparities in living standards and access to resources, basic services and utilities (UN-HABITAT, 2008a). The newly emerged forms of inequalities according to the UN-HABITAT (2008a) include disparities in access to communication technologies and skills, which have led to “digital exclusion” resulting in the marginalization of regions within a globalizing economy. Overlapping reasons such as historical and cultural development, differential endowments in natural resources, human capital and local political economy have all been identified as contributory factors for the existence of intra-national spatial inequality. These could be broadly grouped into socio-cultural, economic and political factors of inequalities among spatial units.
Socio-cultural factors such as values and traditions either encourage or discourage innovation and entrepreneurship, and social and economic mobility leading to inequalities (United Nations Economic and Social Council, 2001). For instance many rural regions and communities offer only agricultural and primary opportunities that limit the productive capacities of their people. Within these poorly endowed rural regions limited socio-economic opportunities and traditional methods of production lead to continuous stagnation or retrogression of the local economy. Residents of these deprived rural areas are therefore forced to depend on well-endowed urban regions for support. Since most rural families are engaged in agriculture, climatic conditions largely affect their income levels. These families therefore constantly keep contacts with their extended families to reduce vulnerability and spread the economic risk. With its larger population size, urban society is characterized by more diversified but less personal relationships leading to people living and working together without developing their level of sentimental and emotional ties characterized in rural areas (United Nations Economic and Social Council, 2001). However, social values and norms change and can be changed over time due to the fact that population sizes of rural areas usually increase with time resulting in a more urbanized society.
Political factors may also account for inequalities among spatial units particularly between rural and urban areas. Policies formulated and implemented in urban areas usually have far-reaching ramifications on rural areas. Continuous investments in urban areas, usually by governments in developing countries, widen the development gap between rural and urban regions. The impacts of such urban-biased development approaches have dire consequence for rural areas which always lag behind fast developing urban areas. This political factor of spatial inequality also presents a development paradox in many developing countries. Thus, while governments in these countries always stress the importance of developing the agricultural sector and improving the living conditions in the rural areas, the still direct most of their investments to the urban areas due to their potentials for rapid growth (United Nations Economic and Social Council, 2001). This results in the concentration of infrastructural facilities and services in urban areas, which ultimately lead to improved access to social and economic services and opportunities. As a result, rural areas become less endowed leading to the widening gap of inequality. Even though urban areas are generally known to be better developed than rural communities, there are higher income inequalities in cities. This implies that inequalities at the country level therefore do not necessarily reflect the nature and extent of inequalities across cities and between rural and urban areas. For example, income inequality in Maputo is significantly higher than the national average, making it the most unequal city in Mozambique (UN-HABITAT, 2008b).
The next major factor of spatial inequalities is economic, manifested in trade and the movement of people, goods and services. According to Kim (2008), unless regions and their cities have identical exposure to trade and similar comparative advantage, foreign trade is likely to increase spatial inequality. More likely, regions and cities that have natural resources for exports or natural advantages such as proximity to rivers, coasts, and transportation networks are likely to benefit from external trade whereas those in remote areas are not (Kim, 2008). Inequalities resulting from natural factors such as natural resource endowments are largely invariable and therefore much more difficult to address.
Although a boom in trading activities could translate into economic growth and thus lead to inequalities, recent evidence suggests that economic growth does not necessarily lead to spatial inequalities but rather the inability on the part of government and relevant actors to implement the appropriate development interventions. In this regard, lessons can be picked from China and India, which both regard export and service-oriented activities in their cities as the sources of their fast growing economies. China, which had extremely low levels of inequality in the 1980s and 1990s, was able to lift more than 500 million people out of $1-a-day poverty between 1981 and 2004 (UN-HABITAT, 2008b). On the contrary, India, which had higher levels of inequality during this period, only managed to raise 60 million people above the poverty line between 1983 and 2000 (UN-HABITAT, 2008b). This situation can be attributable to the fact that in India, there is a bias for the implementation of industrial development policies at the expense of the provision of public goods whereas in China attention is paid to both, particularly in urban areas (UN-HABITAT, 2008b).
Spatial inequalities also exist in Ghana, often reflected in disparities in the distribution of infrastructural facilities among rural and urban areas and between the North and South. Using data from the 1960, 1970, 1984 and 2000 census, the paper analyses the dimensions of spatial inequalities that exist in Ghanaian cities. According to Songsore (1989), colonial dependency is at the root of the inequalities so evident in the Ghanaian space economy. He argues that during the colonial era, Ghana was developed as a satellite nation to export food and raw materials to Britain and to consume manufactured products from the latter (Songsore, 1979). Hence, prior to the 1980s, differential policies were pursued in the North (Northern, Upper-East and Upper-West Regions) and the South (the rest of Ghana) to ensure labour flows from the former to facilitate the export industry in the South. Songsore (1989) argued that dependency and capitalist penetration, which under colonialism shaped the internal structure to fit the needs of the colonial metropolis, continue under neo-colonialism to distort the internal patterns of production, and the spatial organization of economic and social activity. His sentiment underlies most studies undertaken on spatial inequality in Ghana.
The above discussions provide the basis for the paper. The paper explores spatial inequalities in terms of access to social services between cities in northern and southern Ghana. It aims at establishing the nature of inequalities in the provision and distribution of educational, telecommunication and health services among selected cities in northern and southern Ghana.
Trends and causes of spatial inequalities in Africa
Spatial inequalities in the provision and distribution social services present significant economic and political challenges for the governments of many developing countries, especially in Africa.The manifestation of this phenomenon has been seen in rural-urban and regional disparities in social and economic indicators. For instance, Venables (2005) argues that for 50% of African countries, the percentage of people lacking access to basic facilities in rural areas is double that of urban areas. According to Kim (2008), this trend seems to increase with economic growth and development. On regional basis, Latin America and Africa continue to experience higher levels of inequalities with about just 5% of the population receiving a quarter of all national income, compared to South-eastern Asian and Western developed countries, where the wealthiest 5% receive 16 and 13%, respectively (UN-HABITAT, 2008b). In Africa, inequalities are more pronounced in Sub-sahara Africa than in North Africa. For instance, access to basic social services among urban areas in North African countries is higher than in Sub-saharan African countries. For example, urban access to potable water level in Sudan and Mauritania was 78 and 59% for respectively, which is very substantial compared to the 29 and 21% levels recorded in Guinea Bissau and Sierra Leone respectively (UN-HABITAT, 2008b).
Spatial inequalities in Africa vary among sub regions, countries, cities, and rural and urban areas as can be seen in Table 1.

From Table 1, the highest level of inequality in rural and urban areas of Africa was recorded in rural areas of Namibia with the incidence being more pronounced in urban areas than in rural areas. The available economic opportunities in urban areas and the already high urban population sizes have led to high in-migration rates and natural population increases which further translate into high population growth rates. With limited available resources to satisfy the needs of the growing population in terms of health, education, potable water supply and adequate shelter among others, the phenomenon assumes an alarming proportion.
High economic growth rates are not the only factors, which account for rising inequalities in Africa but also inability of national governments to develop pro-poor policies to alleviate inequalities. Countries such as Ghana, Mozambique and Tanzania, which have been experiencing rapid economic growth in recent years as well as countries experiencing slow growth, such as Cameroon and Côte d’Ivoire, have all recorded rising spatial inequality in terms of access to social services (UN-HABITAT, 2008b). According to the UN-HABITAT (2008b), inequalities in African cities can be traced to their colonial past, but are also reinforced by post-colonial institutions, which are characterized by corruption, fragile and ineffective local governments, poor governance and monopolized access to assets, particularly land, which is often in the hands of the political and economic elite. It is therefore not surprising that measures, which have been taken by governments to address inequalities, have usually proven futile. Structural Adjustment Programmes (SAP) aimed at alleviating poverty and subsequently inequalities especially in urban areas have rather aggravated urban poverty and inequalities as they took off subsidies for basic services. In urban Kenya, for instance, the gini coefficient rose from 0.47 in the 1980s to 0.575 in the 1990s largely as a result of SAPs, poor governance and other factors that adversely affected the urban poor (UN-HABITAT, 2008b).
The foregoing underlies the patterns of movements on the continent and continuous widening of the poverty gap between economically endowed cities/regions and less endowed ones. African governments continue to consolidate investments in economically active cities to the neglect of intermediate towns and rural areas. This state induced spatial inequalities between cities and regional areas in Africa sets the context for this paper.
APPROACH AND METHODOLOGY
The main technique used in this paper is the Lorenz curve and Gini coefficient analysis of access to social services among the six selected cities in southern and northern Ghana. According to the UN-HABITAT (2008b), the Gini co-efficient analytic is the most commonly used means of assessing inequalities in terms of incomes, provision and distribution of socio-economic facilities. The Gini ratio largely depends on the Lorenz curve, an analytic which explains the various proportions of the population that control the various proportions of incomes, resources as well as having access to which proportions of social services. Ideally the Gini ratio is expressed as an index or a percentage. As an index the Gini ratio ranges between 0 and 1; while as a percentage it ranges between 0 and 100%. There is perfect equality in a society/community where the Gini co-efficient is 0 and perfect inequality when it is 1 or 100%. Thus the closer the Gini co-efficient is to 0, the more egalitarian an area/region is and the closer it is to 1 (100%), then the more unequal income and resources are distributed among the various sections of society.
Again this study is based on documentary review of existing statistics on the distribution of social services among the major cities in Ghana. Hence the paper is based on a review of secondary data from the various censuses conducted in the country since 1960. In doing this six out of the ten regional capitals (3 each in the south and north of the country) were purposively selected namely: Accra, Sekondi-Takoradi, Kumasi in the south; and Tamale, Wa and Bolgatanga in the Northern part of Ghana (Figure 1).

The selection of these cities was based on the levels of investments and socio-economic activities they have received in the recent past. Accra is the national capital and has received and continues to receive the highest economic and social investments since independence. Kumasi is the second largest city, centrally located and known to be the main traditional and commercial hub of Ghana. Sekondi-Takoradi was Ghana’s first port and habour city and currently the oil production city of the country. Contrary to these southern cities, Tamale, Wa and Bolgatanga have received very little in terms of social and economic investments (Ghana Statistical Service, 2005a).
Using the six cities as cases, data on the demographic characteristics, availability and access to social facilities such as health, education, sanitation and water, among others was analysed to establish the dimension and extent of spatial inequality in Ghanaian cities. Analysis of the data is generally qualitative and deductive depicting the trend and dimensions of inequalities among Ghanaian cities. Lorenz curves have been used to show the extent of disparity as far as access to basic services is concerned. The analysis also helps explain the economic, historical, and political factors, which account for the disparities in population distribution, employment opportunities, and accessibility to basic services among the six major Ghanaian cities.
Dimensions of spatial inequality among Ghanaian Cities
Demographic characteristics
Table 2 presents the population sizes and the annual growth rates recorded in the study communities since 1960. From the table, it can be seen that the population of all the six cities increased from 1960 to 1970, at a decreasing rate. However, between 1984 and 2000, Kumasi and Accra experienced an increase in an increasing rate. The decline in the rate of increase recorded in almost all the study cities could be attributed to the harsh economic conditions experienced from 1970 to 1984, resulting in some people migrating to other African countries in search of greener pastures. In addition, the decline in the rate of population increased in the three Northern cities of Tamale, Wa and

Bolgatanga from 1984 to 2000 can be explained by the droughts and bush fires which occurred in Ghana in the mid 1980s. These three cities experienced intense magnitude of the drought and bush fires due to the vegetation, which is grass, and dry. This resulted in the working population of these cities migrating to the Southern cities of Accra and Kumasi (Ghana Statistical Service, 2005a).
The uneven distribution of population among these six cities is accounted for by the colonial government’s spatial development policy of the creation and development of ports and harbours, good road network and infrastructural facilities in the mineral-rich areas and forest belts to facilitate raw material production for feeding industries in the United Kingdom (Ghana Statistical Service, 2005a). This led to the triangular network of railroad linking Kumasi to Accra -Tema and to Sekondi-Takoradi. Although this network is largely not efficient now, the location still accommodates the bulk of Ghana’s trade and exchange activities as well as providing the highest of social and economic services. The unintended consequence of such a policy was that the southern and middle half of Ghana, principally around Accra-Tema, Kumasi and Sekondi-Takoradi, became more developed and, hence, attracted high population concentrations relative to the northern section of the country (Ghana Statistical Service, 2005b). Unfortunately, not much has been achieved to reverse this situation in the post-independence era even though successive governments have made various attempts. Since infrastructure provision is primarily influenced by population size, it suggests that the cities of Kumasi, Accra, and Sekondi – Takoradi have and will continue to enjoy a larger share of investment in infrastructure and services. In an attempt to reverse this emerging trend, the Government of Ghana has instituted the Savannah Accelerated Development Authority (SADA) Act 805 to consciously develop the three Northern Regions and parts of the Brong Ahafo region, which it hopes will help bridge the gap between the north and south of the country. Under the Savannah Accelerated Development program, the government intends to invest a total of US$ 1 billion over a period of 5 years. These investments will be channelled into the development of a comprehensive regional and ecological strategy, modernise agriculture, develop strategic infrastructure, create strong linkage between Northern Savanna and the Sahelian countries, and promotion of a vigorous private sector initiative that strengthen existing private operators. A number of preliminary activities are being undertaken under the program but their impacts in terms of bridging the spatial inequality gap is yet to be felt. The various indicators used to present spatial inequality of access to social services have been discussed below.
Distribution and access to social services
Health
Physical accessibility to health facilities is an important indicator of socio-economic wellbeing. Thus, physical access to health facilities motivates sick people to seek medical treatment whereas low physical access serves as a disincentive to seeking for medical care. Again, health facilities in highly accessible areas facilitate health sensitization exercises as health practitioners are able to reach out easily to the target beneficiaries. Using distance covered to access health facilities in the various cities as an indicator of spatial inequality, the study revealed a high level of bias towards cities in southern Ghana (Table 3 and Figure 2).

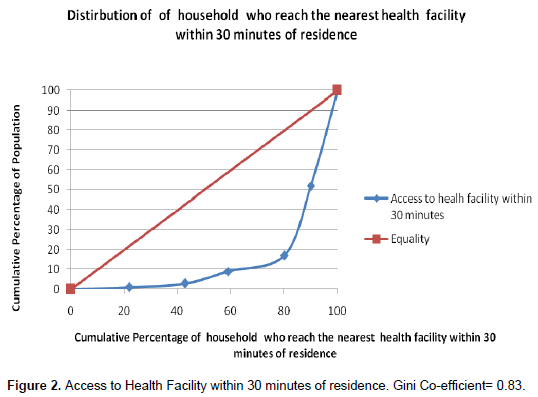
Table 3 indicates that accessibility to clinics, which is a lower order health facility, was very high in Accra and Kumasi but very low in Tamale, Wa and Bolgatanga. In these three northern cities, 20, 7.3 and 5.3% of the localities in Tamale, Wa and Bolgatanga respectively had access to clinics within their localities; whereas over 98.9, 100 and 36% of the localities in Accra, Kumasi and Sekondi-Takoradi respectively had clinics in their localities. In addition, while all residents of Accra and Kumasi have access to hospitals within their localities and 35.4% in Sekondi- Takoradi, Tamale, Bolgatanga and Wa have 12.9, 0.6 and 1% respectively of their residents accessing hospitals within their localities. This has also been depicted with the Lorenz curve in Figure 2.
The access situation to health facilities goes a long way to show the wide disparity among cities in Ghana, especially between those in the south and the north of the country. With gini co-efficient of 0.83, the access to health facilities within 30 min is skewed towards perfect inequality between cities in southern and northern Ghana (Figure 2). The foregoing situation has been largely caused by inadequate health facilities in the northern regions coupled with the dispersed nature of the settlements in that part of the country. The result of this situation has been that of very low health personnel-patient ratios, over-crowding and pressure on the few health facilities in the northern regions and general deterioration of such facilities.
Telephone Facilities and Services
There are also disparities in accessibility to telecommunication facilities including public telephone among the cities as can be seen in Figure 3 and Table 4. From Table 5, Kumasi and Accra have public telephones in each locality whereas Wa recorded the least access with 65.1% of its residents travelling over 20 km to access a public telephone. It must however be noted that with the advent of several mobile phone companies in the country, the impact of this indicator in the socio-spatial disparity in the country is gradually diminishing.


This notwithstanding, Figure 3 also depicts disparity with access to telecommunication facilities in the cities. Showing a gini concentration ratio of 0.85 on the Lorenz curve, there is almost total inequality in the spatial distribution of public telephone facilities within the cities selected for the study (Figure 3). As has been indicated earlier the impact of this on the overall development can be said to be minimal. However, due to the use of post offices as payment point for public utility services and money transfer, there is the need to help address the imbalances in the provision of post office facilities (Ghana Statistical Service, 2005b).
Education
Human resource development essentially relates to formal education, training and utilization of human potentials for social and economic progress and according to the Ghana Statistical Service (2005a), the five components of human resource development are education, health and nutrition, the environment, employment and political and economic freedom. These components are inter-dependent. However, education serves as the basis for the other four because it is an essential factor in the improvement of health and nutrition, for maintaining a high quality environment, for expanding and improving labour pools, and for sustaining political and economic responsibility (Ghana Statistical Service, 2005b). The Government of Ghana recognizing the key role education can play in development has implemented several programmes to improve particularly basic education. These include the Free Compulsory Universal Basic Education, the Capitation Grant and School Feeding programmes.
In spite of this however, there is inequality in the distribution of educational facilities among the six study cities resulting in varied level of accessibility. From Figure 4, it can be deduced that access to primary schools by children in the cities is unfairly distributed. At a gini coefficient of 0.77, it can be said that the spatial distribution and access to basic school as an indicator of equal spatial development among Ghanaian cities leaves much to be desired. This also results in disparities in the performance of pupils at the basic level. Again, basic schools in these deprived areas lack basic teaching and learning materials as well as teachers for the effective delivery of basic education.
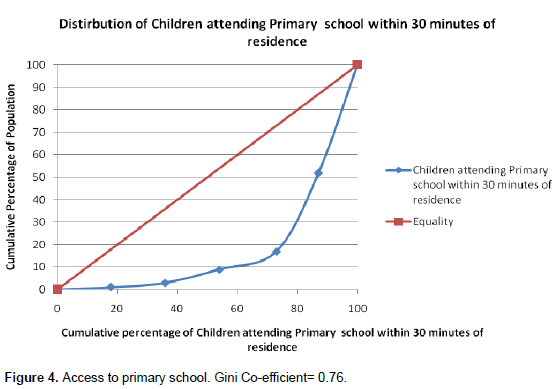
Following from this, basic school pupils in Kumasi, Accra and Sekondi Takoradi have enhanced access to quality basic education in their localities compared to those in Tamale, Wa and Bolgatanga. This has affected the number of children in school in these cities as well as literacy levels (Table 6).

From Table 6, it can also be seen that the cities of Accra and Kumasi recorded the highest level of accessibility to Junior High Schools (JHS) among the six cities as each locality in these cities had a JHS facility. From the Table, it can further be seen that in the northern cities of Wa, Tamale and Bolgatanga, each had less than a third of its localities having a JHS, implying longer distances to access a JHS. This is a major disincentive to the pursuit of basic education in the three northern regions especially among female children who are supposed to do various house chores in the morning before going to school. This situation also has adverse implication for literacy rates among women in the cities of northern Ghana (Table 7).

The situation is even worse in relation to Senior High Schools (SHS) with 0.5%, 0.25% and 9.3% of localities in Wa, Bolgatanga and Tamale respectively having the facility. The cities of Accra and Kumasi on the other hand had SHSs in all their localities as can be seen in Table 6. It can be deduced from Table 6 that there is an unconscious bias in the distribution of educational PPfacilities among the six major cities in Ghana, a phenomenon that is contributing to the widening gap of inequality among the Northern and Southern cities.
Water and sanitation
Tables 7 and 8 present the various sources of drinking water and sanitary facilities available to household members living in the six study cities. Table 7 indicates that with the exception of Wa, all the other cities are well served with potable water facilities as over two thirds of their respective populations rely on pipe borne water sources. In spite of this positive trend, 4.5 and 5.6% of households in the northern cities of Wa and Bolgatanga respectively rely on rain water for domestic use.
This situation gives much concern due to the erratic rainfall pattern in the northern part of Ghana. This presupposes that, access to water to these households is unreliable and may expose them to unhygienic water sources with their attendant health risk. This inference is given a pictorial view in the Lorenz curve presented in Figure 5. Depicting a gini concentration ratio of 0.56, it appears to be the only indicator considered this far with some nearness to spatial equality; though still skewed. This has been the result of the activities of government and non-governmental organization working to provide potable sources of water over the last decade. Again, the outbreak of various water related diseases in the three northern regions has created the awareness for more water intervention in the area.

Table 8 shows the households access to toilet facilities in the study cities. A key observation is the proportion of households in the three northern cities without access to toilet facilities. From the Table, it can be seen that 19.3, 39.8 and 28% of households in Tamale, Bolgatanga and Wa respectively had no toilet facility. Another observation is the proportion of households with access to water closet. From the table, it can be seen that a greater proportion of households in the cities of Accra, Kumasi and Takoradi have access to improved toilet facilities than their counterparts in Tamale, Wa and Bolgatanga.

KEY FINDINGS
From the analysis of information gathered thus far, the following can be inferred:
1. Socio-spatial inequality between cities in southern and northern Ghana is apparent from the data analysed from the year 2000 population and housing census. The dimensions of the inequality are manifested in the location advantages and importance, spatial distribution and access to basic social services in the cities studied. While the disparities in the distributions and access to health, basic education and telecommunication services appear to be very conspicuous, that of water and sanitation is reduced from the data available under the study. This has been explained by the number of water and sanitation intervention projects implemented over the last decade in the three northern regions including the study cities.
2. It therefore follows that the interventions in health and basic education in northern Ghana are not achieving the needed impacts in terms of bringing quality education and health delivery to the local people as well as bridging the spatial equality gap between the north and south of Ghana. The apparent lack of governmental urgency to provide telecommunication services in northern Ghana might have been exacerbated by the upsurge of mobile telecommunication companies in Ghana hence the high levels of disparities.
3. The dispersed and scattered spatial development of cities in the north may have played a key role in the spatial inequality analysis since this phenomenon makes the location of social services in localities with few residents uneconomical. This notwithstanding, it could be argued that most northern communities lack these facilities. And where these facilities are located, they operate below their intended capacities due to lack of qualified personnel, equipment and other operational logistics.
4. It appears that the release of the 2010 population and housing census may not significantly change the current spatial inequality scenarios. This is because the current spatial development trend seems to have towed the line of historical spatial development left behind by the colonialists reflecting the dualism in Ghana’s spatial economy (Songsore, 1989). Again, the initial summary of the population figures released in February 2011 did not provide any significant shift in the spatial distribution of populations and socio-economic services.
5. Spatial distribution and access to social services in the study cities appear to have a positive relationship with the spatial distribution of population among these cities. Thus, there appears to be better access to services in cities with higher populations. This could be related to the different functional hierarchies and level of services given to the various cities. For example, a teaching hospital in Kumasi will have wider spatial influence than a regional hospital in Wa or Bolgatanga.
6. The foregoing notwithstanding, the study shows a marked improvement in the spatial distribution of services from the colonial era through to the previous census results in 1970 and 1984 (GSS, 2005b). For instance, the establishment the University for Development Studies (UDS) in the mid 1990s and current upgrading of Tamale regional hospital to a teaching Hospital are examples of landmark infrastructural development in Ghana. In addition to this the improvement of Kintampo-Tamale and Wenchi-Bole-Bamboi roads which are the major linkages from the southern Ghana to the north have, to some extent, improved spatial development in the latter.
Conclusion
One major problem African governments face is the limited nature of available resources to satisfy the ever-increasing needs of their growing population. Governments are usually torn between investing in developed areas such as cities and towns, which provide security of higher returns on infrastructure investment, and investing in less developed areas such as rural areas, which cannot guarantee higher returns on investments. This has contributed to the disparities in income levels and the lopsided nature of infrastructure supply on the African continent. The paper has highlighted the issue of inequality among the six major cities in Ghana with the skewness being against cities in the Northern part of the country. This has happened because of past colonial policies and more importantly, the presence of the bulk of Ghana’s natural resources being concentrated in the South of the country. The dichotomy between cities in the Northern and Southern parts of Ghana is evident in surface accessibility to social infrastructural services such as health, education, water and sanitation facilities, among others. The effects of this disparity are enormous with the immediate effect being the attraction of more migrants from the northern part of Ghana to the south. The net effect of this high migrant population is that more pressure is exerted on available infrastructure and economic opportunities at the south.
RECOMMENDATIONS
As was indicated earlier in the study, it is revealed that past efforts, over the last two and half decades, at bridging the spatial inequality gap between the northern and southern Ghana have not yielded the needed impact since there still exists a marked development gap between the two areas. This thus calls for the design, planning and implementation of future development programmes to take into consideration this apparent north-south dichotomy. It must however be stated that the Savanna Accelerated Development (SADA) programme is in the right direction as a result recommendations made in this study is only to make an intellectual inputs to the discourse towards bridging the development gap.
From the foregoing, the paper recommends the provision of physical access and spatial connectivity in the form of providing transportation network to the northern cities. This will open up these cities and facilitate the transfer of other investment opportunities which will generate wealth. In doing so, the government of Ghana must make conscious efforts to provide social and economic infrastructure such as schools, hospitals, and telecommunication services in the northern parts of the country. This is likely to help stem the migration to the southern part of the country in search of better opportunities.
CONFLICT OF INTERESTS
The authors have not declared any conflict of interests.
REFERENCES
| DeVerteuil G (2007). Inequality Unpublished manuscript in preparation for Encyclopedia of Geography. Elsevier Press: University of South Hampton. | ||||
| Ghana Statistical Service (2005a). 2000 Population and Housing Census, Population Data Analysis Reports, Volume One, Policy Implications of Population Trends Data, Accra, Ghana. | ||||
| Ghana Statistical Service (2005b). 2000 Population and Housing Census, Population Data Analysis Reports, Volume 2, Policy Implications of Population Trends Data, Accra, Ghana. | ||||
|
Gotham KG (2003). Toward and understanding of the spatiality of urban poverty: the urban poor as actors. Int. J. Urban Regional Res. pp.723-737. Crossref |
||||
| Lall SV, Chakravorty S (2004). 'Industrial Location and Spatial Inequality: Theory and Evidence from India'. World Institute for Development Economics Research, United Nations University. Research Paper No. 2004/49. | ||||
| Lobao LM (1990). Locality and Inequality. Albany: The State University of New York Press. | ||||
|
Lobao LM, Hooksy G, Tickamyerz AR (2008). Poverty and inequality across space: sociological reflections on the missing-middle subnational scale. Cambridge J. Regions, Econ. Soc. 1:89–113 Crossref |
||||
| Songsore J (1979). Structural Crisis, Dependent Development and Regional Inequality in Ghana. Institute of Social Studies. Hague, Netherlands. | ||||
| Songsore J (1989). The Spatial Impress and Dynamics of Underdevelopment in Ghana. In: Swindell, K., Baba, J.M., Mortimore M. J. (Eds.), Inequality and Development: Case Studies from the Third World. Macmillan Publishers, London. | ||||
| Kim Sukkoo (2008). Spatial Inequality and Economic Development, Theories, Facts, and Policies. The International Bank for Reconstruction and Development, Washington. | ||||
|
Tickamyer AR (2000). Space matters: spatial inequality in future sociology. Contemp. Sociol. pp.805-813. Crossref |
||||
| UN-HABITAT (2008a). State of the World's Cities, 2008/2009: Harmonious Cities. Earthscan, London and Sterling. United Nations Human Settlements Programme. | ||||
| UN-HABITAT (2008b). The State of African Cities, A Framework for addressing Urban Challenges in Africa. Nairobi, Kenya. United Nations Human Settlements Programme. | ||||
| United Nations Economic and Social Council (2001). Policy Issues for the ESCAP Region: Balanced Development of Urban and Rural Areas and Regions within the Countries of Asia and the Pacific. Item 5b of the Provisional Agenda, Bangkok. | ||||
|
Venables Anthony J (2005). Spatial disparities in developing countries: cities, regions and international trade. J. Econ. Geogr. 5:3-21. Crossref |
||||
Copyright © 2024 Author(s) retain the copyright of this article.
This article is published under the terms of the Creative Commons Attribution License 4.0


