ABSTRACT
Education is the most powerful instrument to transform socioeconomic status of given society. However, education will be only more effective when its quality is sustained. Education without quality is a gun without bullet. In developing countries there are number of factors that affect education quality. However, little is known about those factors. Therefore, this study seeks to identify spatial and non-spatial factors affecting quality of primary education in in Emerging Regions of Ethiopia. As methodology, descriptive survey design was used as the research strategy. Key informant interview, focus group discussion and field observation were used to collect primary data. Secondary data were also collected from reports, policy documents and research outputs. Efforts have been made to triangulate the collected facts. In order to interpret spatial analysis of accessibility and service area coverage, maps were prepared using Geographical Information System (GIS). Based on the quantitative and qualitative analysis, this study found that low teachers’ qualification, low teachers’ motivation, limited teachers’ building capacity, ineffective school leadership, low participation of parents, lack of adequate school facilities, overcrowded classes, low quality of classrooms, high pupil teacher ratio, and lack of instructional materials were some of the non-spatial factors that lower education quality. The study further asserted that from the total area of the city, 32% was well accessible, 20% was moderately accessible, 5% fairly accessible and the rest 43% was not accessible at all. Based on all findings, it can be said that the Ethiopian government has a long way to go to deliver quality education to its citizens. Based on the results, it was recommended that to improve education quality efforts must be doubled on developing national and particularly regional educational system that are responsive to existing multiple challenges. Institutional, administrative and leadership reforms are mandatory to escape from this devastating situation.
Key words: Distribution, emerging region, elementary, Gambela, quality, schoo, service area.
Education is the main driving factor for economic, social and political transformation since human civilization (Islam et al., 2016; UNICEF, 2014). Education is a basic human right and it plays an indispensable role in bringing broader social, economic and cultural benefits (Tarc, 2013). In this regard, developed countries have been exerting massive efforts to assure quality education (Biggart et al., 2015). However, development of educational system in developing countries was not as good as that of developed countries (Birchler and Michaelowa, 2016). Empirical evidences vividly have shown that education quality in developing countries is discouraging (Jones, 2016).World development report (2018) also explains that sub-Saharan African countries are the most affected countries by education quality crisis. Particularly, ineffective leadership, poor teachers’ training program and low teachers’ salary are some of the non-spatial factors that influence education quality in emerging regions (Jana et al., 2014).
In other perspective, locational distribution, service area coverage and accessibility of schools are the basic spatial factors that affect education access and quality (Ogunyemi et al., 2014). Geographical location and spatial distribution of primary school in developing countries are characterized by uneven distribution that commonly limit the level of accessibility, which in turn affects education quality (Fabiyi and Ogunyemi, 2015). Uneven distribution of schools not only affect education access but it also affects education quality (Oluwadare and Olujimi, 2011). In conjunction with spatial distribution of the schools, availability of adequate physical infrastructure plays vital role in improving student’s educational achievement (Urwick and Junaidu, 1991). When schools lack physical infrastructures such as water supply, playfield, library and teaching equipment, students’ learning interest can be declined (Akomolafe and Adesua, 2016).
In the same line of thinking, education system of Ethiopia also shares the aforementioned challenges. In Ethiopia where 60% of its population belongs to pastoral and semi-pastoralist way of life, the issue of providing equitable, accessible and quality education is becoming challenging assignment for the local governments (FDRoE, 2015). Particularly, for emerging regions like Gambella Regional State education system is challenged by multifaceted problems. Despite remarkable achievements in expansion of educational institutions in the region, lack of access to quality education is one of the hot issue in the education sector. The true marriage between education access and education quality in schools were not met. Primary evidences showed that poor quality of education depends on a number of spatial and non-spatial factors, which are emanated from human, physical and material resources. Therefore, this study was aimed to analyze spatial and non-spatial factors that influence educational quality in emerging regions of Ethiopia by considering Gambela city as case study. Furthermore, the ambition of this study was to provide a policy options to improve and restore education quality in the emerging regions.
Description of the methodology
By their nature, factors that influence education quality emanate from spatial and non-spatial dimensions. The non-spatial factors are more associated to the existing economic, social, cultural and historical, religions, political and environmental contexts. Whereas, spatial factors are more associated with geographical location because education system can be positively or negatively influenced by the geographic location of education institutions. Distance to school, spatial distribution and accessibility of education institutions are some of the factors that influence education access and quality. Accordingly, data collection of this study was based on a qualitative and quantitative research approach. Qualitative data were used to assess perception of teachers, students, principals, parents and school administrators towards education quality. In contrast, quantitative data were used to measure distance, accessibility, distribution and service area coverage of the schools and their impacts on education quality.
Data sources
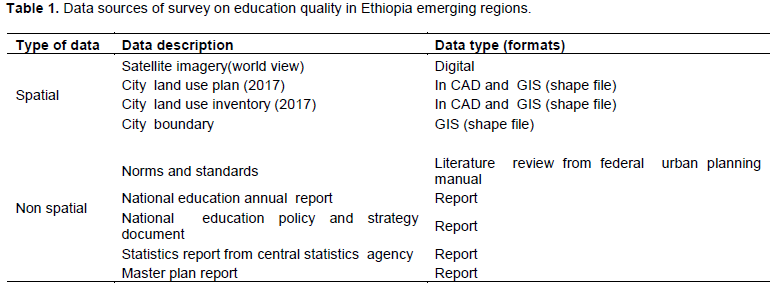
The data used this study were obtained from primary and secondary data sources. Primary data were collected from spatial and non-spatial data sources. The spatial factors were mainly collected from GPS reading, aerial photo and land use plan of the city, which was used to extract location of the existing educational institutions. Spatial information of education institutions have been converted into spatial data layers and stored in the Geographic Information System data database. Non-spatial primary data were collected using key informants interview, focus group discussion and field observations. The perceptions and reflections of key informants (teachers, students, principals and parents) were entertained by using focus group discussion, key informant interview and public hearing approaches. On top of this, a number of documents on nation-wide education policy and strategies regarding developing countries were reviewed. In addition to this, relevant education related reports, correspondences, minutes and archives of the local government of the study area were also analyzed (Table 1).
Method to identify factors affecting education quality
Non-spatial factors
As is clearly stated in the background, quality of education is influenced by multi factors. Nazluli et al. (2017) argued that factors that affect education quality are several and context dependent. As general conception, education quality can be influenced by non-spatial factors, which emanate from social, political, administrative, environmental and technological backgrounds. By their nature, non-spatial data are expressed in terms that are mainly expressed by reflections and perceptions of participants. Hence, during the course of this study, the perceptions and reflections of students, teachers, principals and parents were collected, using key informant interview, focus group discussion and public hearing meeting approaches. Field observations were also conducted in order to grasp experience on quality, functionality and overall performance of the education service delivery in the study area. Under this, evidences were gathered using photograph and eyewitnesses.
Spatial factors
Under this method, spatial factors that have direct and indirect impact on education quality were analyzed using geospatial tools. Here, spatial distribution, accessibility and service area coverage of the existing primary education institution were analyzed by using ArcGIS Network Analyst extension to identify which area of the city is well serviced and none serviced. In this regard, concentric service areas were generated to show how accessibility varies within a given distance. Once service areas were created, it was possible to identify how much of them were well, moderately or poorly served. ESRI also acknowledged that service areas created by network analyst helps to evaluate accessibility of given social services.
Analysis approach
The analysis was mainly rooted in identifying spatial and non-spatial factors that affect education quality in the study area. Hence, the objectives of this study were analyzed in terms of education quality indicators such as pupil-teacher ratio, class-student ratio, served population, availability of school infrastructures (toilet, bath, water supply, electricity and library). In addition to this, the quantitative data that deal with geographical location (distribution, accessibility, service coverage and distance from the center of the school) were analyzed using geospatial tools and administrative time series data. In order to interpret spatial analysis of accessibility and service area coverage, maps were prepared using Geographical Information System (GIS).
Software used
A set of analytical software were used to assist analysis of quantitative data. In this study, popular geospatial tools like arc GIS version 10.5 and CAD (computer-aided design) were used to analyze the spatial data. In the other hand, the qualitative data or the non-spatial data were analyzed using Microsoft Excel and SPSS. In such cases, calculation of percentages, proportions, ratios, averages, and comparison of figures with national standards
were used as approach to interpret the research findings (GIS Software, 2018).
Non spatial factors affecting educational quality
Reflections from key informants and focus group discussants
During discussion with key informants and focus group participants, it was underlined that there were potential factors that negatively influenced education quality in emerging regions. According to participants of the survey, the present education quality is at its lower level. Detailed survey specially made by the Ministry of Education of Federal Government of Ethiopia (2015) confirmed that education quality of primary education in emerging regions is not promising. From the same source, although encouraging results have been obtained in promoting access to primary education over previous decades in the contrary, education quality was not attained at expected level. Education Quality Assessment Report by UNICEF (2014) also indicated that the dramatic increase in enrolment in Ethiopia has resulted quality challenges including high student-teacher ratios, insufficient classrooms, inadequate learning materials and a lack of trained teachers. This is also more pressing issue in the emerging regions.
Qualitative interviews confirmed that there were different non-spatial factors affecting education quality. According to participants’ perception, the major non-spatial factors that negatively influence education quality emanate from cultural, economic, political and technological backgrounds. From the cultural perspectives early child marriage is mentioned as main cause for low performance of the students. Economic issues also play significant role in education quality. In the first place, teachers’ salaries are not attractive for most teachers. Secondly, students from poor families are the most disadvantageous as they cannot get additional reference material and teaching aid. Lack of technological inputs like radio, tape recorder and internet access were also raised as factors to lower education quality. Empirical
study also witnessed that primary schools in Ethiopia lacked technological inputs. As nation-wide evidence, 33, 67 and 89% of primary schools could not benefit, respectively, from radios, tape recorders and video recorders (FMoE, 2015).
Interviews with parents, students and principals asserted that shortage of instructional material, lack of qualified teachers, limited instructional inputs, shortage of classrooms, lack of school facilities and equipment were pointed out as underlying non-spatial factors affecting educational quality in the city. On top of this, the low-level standards in terms of teaching material, student desks and black boards were some the indicators challenging the education system in the city. According to Jana et al. (2014) “ineffective leadership, poor training of teachers, low salary of teachers, limited and often ineffective and problematic professional development opportunities for teachers, a focus on quantity rather than quality, a weak economic environment and low participation of parents” are underlying factors that affect educational quality.
Ngigi et al. (2012) also acknowledged that educational sector in developing countries was facing numerous challenges such as, lack of infrastructural and human resources, poor accessibility, imbalance between demand and supply, not enough school facilities. The other factor influencing quality of education in the study area was related to turnover of teachers and their least motivation. A number of studies also reported that teachers’ motivation was a crucial factor to assure education quality and it plays marvelous role for realization of the teaching objectives (AbazaoÄŸlu and Aztekin, 2016).
Factors affecting educational quality from empirical evidences
Number of educational institutions and served population
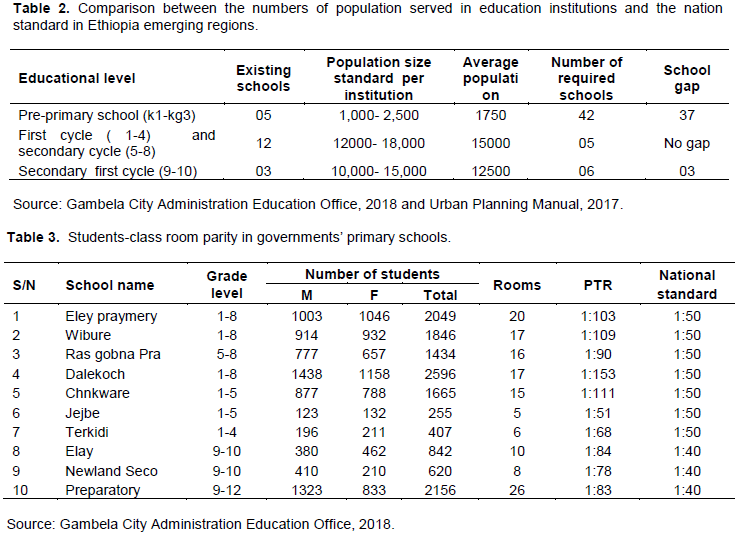
Experience has shown that capital cities of developing countries are recognized as primate cities. As matter of fact, today capital cities of developing countries are suffering with over crowdedness, high rate of unemployment, housing problem and lack of adequate social services, which mainly include health and education services. Gambela city, which is the capital city of Gambella reginal state, also shares the same characteristics. Theoretically, it is understood that when population size increases at alarming rate, local governments will be under pressure to supply adequate service to residents. Global reports also witnessed that urbanization in developing countries are posing substantial challenges. Particularly demographic pressure is creating huge burden in the education sector (UNISCO, 2017). In the same line of thinking, as Gambela city is one of the primate city in Gambella regional state, the number of educational institution were not in position to go with dramatic increase of the population size (Table 2).
As shown in Table 2, based on the national urban planning manual, 37 additional kindergarten were identified as gap. Besides, the city also need 03 secondary first cycle (9-10) schools to be built in the city to fill the gaps. This fact indicates that in addition to issue of education quality, there was also an issue of education accessibility problem in the study area. This implies that there is no balance between the growing population size and number of existing educational institutions.
Analysis of pupil-teacher ratio (PTR) as quality indicator
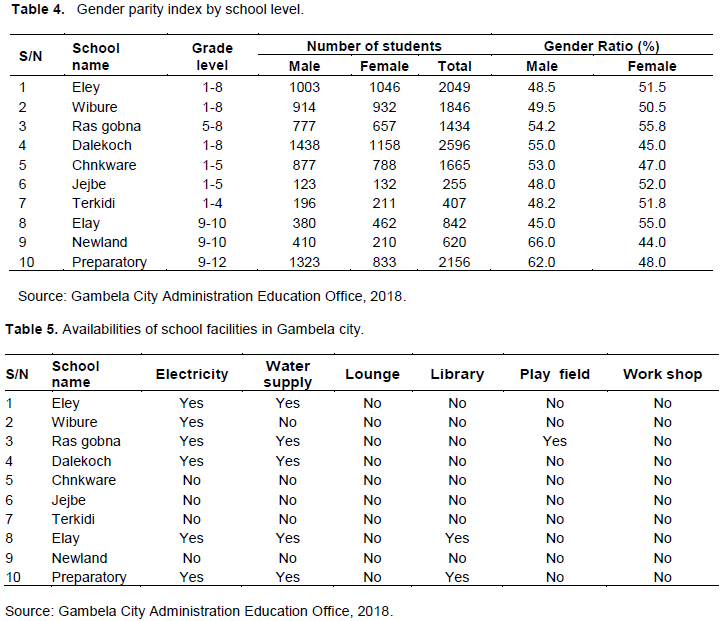
Educational quality is always measured by different indicators. Among those indicators, pupil-teacher ratio (PTR) is one of the most important indicator. According to Naisujaki et al. (2017) to ensure effectiveness in teaching and learning process supplying adequate and quality teachers is mandatory. UNESCO (2009) stated that ratio of pupil-teacher (PTR) in most developing countries is higher. Pupil-teacher ratio (PTR) in developing countries estimated that over 84% classrooms had over 40 pupils per teacher and this is more acute in Sub-Saharan Africa and Asia (Mulei et al., 2016). In Ethiopia, the standard set for pupil-teacher ratio (PTR) is 50 at primary and 40 at secondary level (FMoE, 2017). However, in actual condition it was beyond those limits. For example, Addis Ababa has the lowest PTR at 24 students for every teacher in primary school. Emerging regions like Ethio –Somali has the highest PTR at 63 students for every teacher (FMoE, 2017). In similar context, this study has found that pupil-teacher ratio (PTR) in Gambela city ranges from 50:1 to 60:1. This was happening because students’ enrolment have grown without supply of adequate teachers. Accordingly, this high ratio of PTR is becoming one major factor that affects education quality in the study area. According to Gökçe et al. (2016), highest pupil-teacher ratio (PTR) affects student’s self-confidence, co-operation, and sense of belonging and behavioral changes; while small pupil-teacher ratio (PTR) promotes participation and confidence of the students.
Analysis of pupil section ratio as quality indicator
Having pleasant outdoor education environments and classrooms are prerequisite for achieving efficient and effective educational system. Figueroa et al. (2016) and Blatchford et al. (2011) argued that the number of students in a class is a primary factor affecting the quality of education. In Ethiopia, pupil section ratio (PSR) has disparities among all regional states. For example, Gambella regional state has the biggest variation between cycles, with 114 in the first cycle compared to 77 in the second cycle. Pupil section ratio (PSR) is lowest in Addis Ababa indicating that students in this region have better access to class room and so are for quality education. Nationally, the average pupil section ratio (PSR) is 43 for primary school (FMoE, 2017). However, as it can be seen in Table 3, the student-class room ratio in Gambela ranges from 1: 50 to 1:153. This implies that there were limited number of classrooms in each school. In actual sense, during the field visit, it was noticed that classrooms were overcrowded and there was competition for the resources (book, chair and facilities). Blatchford et al. (2011) clarifies smaller classes led to pupils to get attention, support and can create active interaction among pupils and teachers. In the contrary, higher students in class cannot participate in the class and interact with their teachers. This all conditions can result lower performance of the students and hence education quality.
Analysis of gender parity index as quality indicator
In this contemporary era, having balanced gender parity index is considered as indicator for good education access and education quality (White et al., 2016). With regard to Ethiopia, still the gender parity index (GPI) issue has visible disparities. For example, currently Gambella regional state has gender parity index of 0.92, Ethio somali 0.78 and Oromiya 0.87 (FMoE, 2017). In similar way still in Gambela city there is gender disparity in the primary schools (Table 4).
Analysis of physical conditions and facilities of schools
Physical condition of classrooms and their internal facilities have direct and indirect impact on teaching and learning process (King’oina et al., 2017). However, schools in developing countries are suffering from lack of school facilities and substandard class rooms (Ngigi et al., 2012). When schools are not equipped with facilities like play fields, recreational areas and other outdoor services social bonds among students will be declined (Nepal and Maharjan, 2015). This situation will harm students’ effort to share knowledge and to work in team spirit in the teaching and learning process (Button et al., 2013) In Ethiopia government’s reports witnessed that education institutions lack adequate infrastructures and this is more acute in emerging regions. For example, only about 33% of all primary schools have electric supply, 67% have radios, 33% have tape recorders and 11% have video recorders (FMoE, 2017). In similar way in Gambela city, key informants were stated school environment was not attractive for being schools were not equipped with necessary facilities like toilet, bath, library, recreational space and office facilities. As it can be seen in Table 5, out of the ten schools only 60% have electricity, 50% have water supply, 100% have not launch, 80% have not library, 90% have not play field and 100% have not workshops. This implies that lack of those facilities has great impact on the education quality.
Spatial analysis of education institutions (spatial distribution and accessibility)
Spatial distribution of primary schools
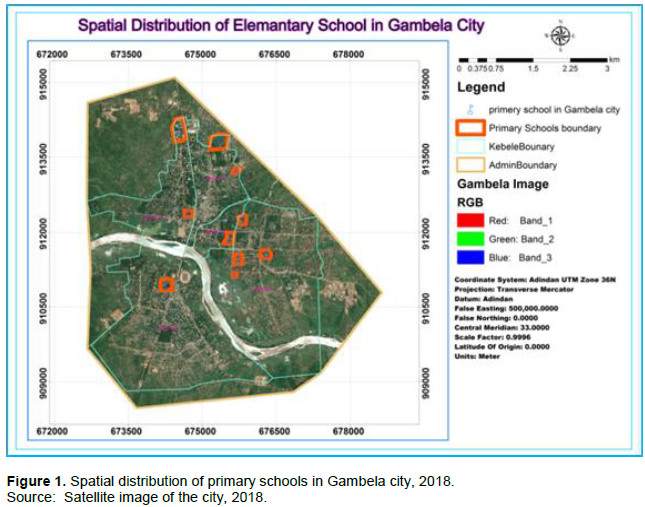
Locations of schools are advised to be located with reference to population density, proximity and accessible to target population (Mustapha et al., 2016). However, Fabiyi and Ogunyemi (2015) conformed that spatial distribution of primary school in developing countries are characterized by uneven distribution that commonly limit the level of accessibility which in turn affects education quality. It is also true for Gambela city that primary schools are unevenly distributed (Figure 1) about 70% of the primary schools are located in the central part of the city. This vividly indicates that some segment of the community are more advantageous while others are suffering due to absence of adequate access to education institutions. As per the key informants, there were significant number of students that travels more distance to access the nearest school. For this reason, many students were came late to classes. Bramasta (2015) witnessed that uneven distribution of educational institutions not only deny accessibility but also greatly affects education quality.
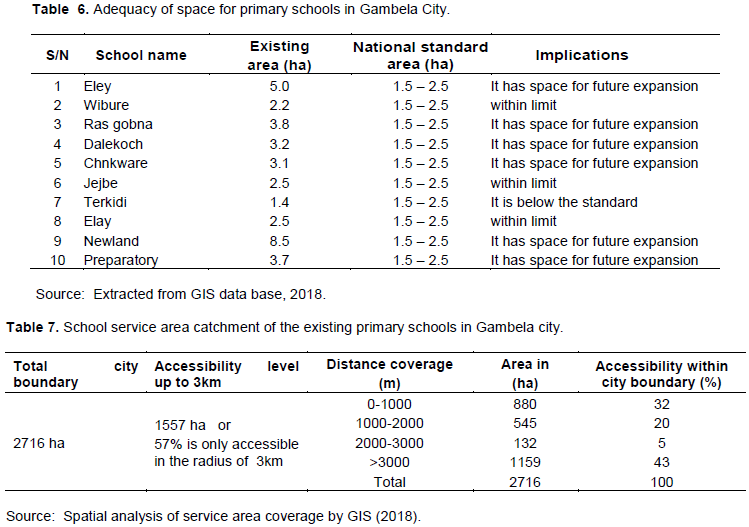
Adequacy of space for primary schools
Ministry of Works and Urban Development (MWUD) (2017) in its urban planning implementation manual issued that 1.5- 2.5 ha land is required for placing primary school. This space is required not only for the hard landscape (building and road) but it is also for facilities like play field, green area and other outdoor services. In this perspective, most of the existing schools in Gambela city have met the national standard except one school (Table 6).
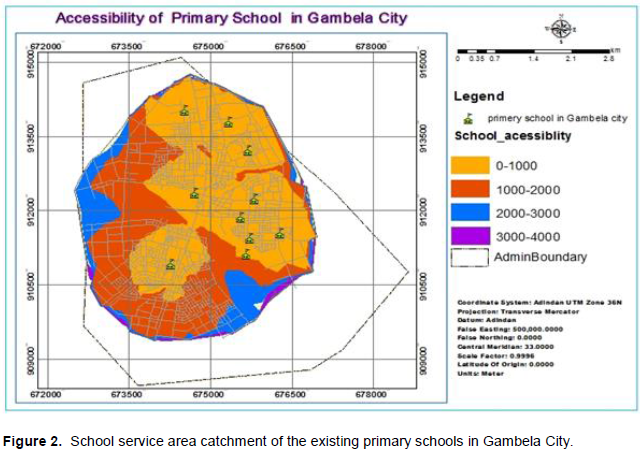
Analysis of primary school service area catchment/ accessibility
In urban planning, catchment area is an area from which service providing institution attracts service demanders. Accordingly, school catchment area is geographic radius from which students are eligible to join schools. Urban planning institutions and firms often used catchment area as criteria to locate new schools. In Ethiopian urban planning practice, distance to school is measured by catchment area. For example, primary school is said to be accessible when students travel less than 3 km (MWUD, 2017). Cunningham et al. (2014) and De la Fuente et al. (2013) also argued that effective planning requires better understanding of available resource, targeted population and spatial distributions of needs and service coverage that can show where services are matched to needs and where there are coverage gaps. Pengfei et al. (2014) also argued that spatial accessibility is an important index to evaluate distribution of educational facilities. Hence, this study also found that spatial distribution and service area catchment of the existing schools were not matched with the total settlement pattern and population density. According to key informants, each school has priority service areas in which students can get admission. However, in real practice schools suffer to accept students out of the predetermined service area catchment. This is happening due to different factors. The first factor was there was rural- urban and urban –urban migration to the city and the students’ enrolment were increased from time to time. The second factor is the awareness to send children to school has shown tremendous increase. The last, but not the least, reason was the number of schools do not grow parallel with the population growth of the city. This all conditions have direct impact on education quality. If student cannot get education access in her or his neighboring, it always has economic, social and cultural impact on the student learning process, which in turn has also significant impact on education quality. In the same context, in Gambela city there were considerable students that get education access out of their service area. This is mostly demonstrated in students coming from periphery of the city (Table 7 and Figure 2). As it can can be seen in Figure 2 and Table 7, 57% of the total city boundary is accessible up to 3 km, whereas 43% of the city boundary is beyond the maximum service area. According to urban planning manual (2017), the maximum service area for primary school is 3 km radius. When school service area stretches beyond 3 km, it will not be accessible to students. The study further asserted that from the total area of the city, 32% was well accessible, 20% was moderately accessible, 5% is fairly accessible and the rest 43% was not accessible at all.
Education is a corner stone for all socio economic transformations. Especially, primary education system plays indispensable role to harvest responsible, ethical and competent future citizens. It is true that the positive impact of education is only achieved when there is quality education system. However, there are visible indicators that education quality has not been still fully achieved in developing countries particularly in emerging regions where most communities belong to pastoral and semi-pastoralist way of life. Despite remarkable achievements in expansion of educational institutions in the region, lack of access to quality education is one of the hot issue in the education sector. The true marriage between education access and education quality in schools were not met. The study evidence showed that poor quality of education depends on a number of spatial and non-spatial factors, which are emanated from human, physical and material resources. This study found that low teachers’ qualification, low teachers’ motivation, limited teachers’ building capacity, ineffective school leadership, low participation of parents, lack of adequate school facilities, overcrowded classes, low quality of classrooms which were seemingly deteriorating, high pupil teacher ratio, lack of instructional materials, shortage of textbooks and uneven school distributions were the underlying causes for the low education quality in the study area. Based on all these findings, it can be said that Ethiopian government has a long way to deliver quality education to its citizens. Based on the results, it was recommended that improving education quality must be based on developing national and particularly regional educational system that are integrated and responsive to those multiple challenges. Institutional, administrative and leadership reforms are mandatory to escape from this devastating situation.
The authors have not declared any conflict of interests.
The author appreciate the support from the Gambela city administration and the helpful suggestions during the course of this research from colleagues.
REFERENCES
|
AbazaoÄŸlu Ä°, Aztekin S (2016). The Role of Teacher Morale and Motivation on Students' Science and Math Achievement: Findings from Singapore, Japan, Finland and Turkey. Universal Journal of Educational Research 4(11):2606-2617.
Crossref
|
|
|
|
Akomolafe CO, Adesua VO (2016). The Impact of Physical Facilities on Students' Level of Motivation and Academic Performance in Senior Secondary Schools in South West Nigeria. Journal of Education and Practice 7(4):38-42.
|
|
|
|
|
Arc GIS Network Analyst extension tutorial (GIS) (2018). ArcGIS Network Analyst extension tutorial. Available at:
View
|
|
|
|
|
Biggart A, Järvinen T, Parreira do Amaral M (2015). Institutional Frameworks and Structural Factors Relating to Educational Access across Europe. European Education 47(1):26-45.
Crossref
|
|
|
|
|
Birchler K, Michaelowa K (2016). Making aid work for education in developing countries: An analysis of aid effectiveness for primary education coverage and quality. International Journal of Educational Development 48:37-52.
Crossref
|
|
|
|
|
Blatchford P, Bassett P, Brown P (2011). Examining the effect of class size on classroom engagement and teacher–pupil interaction: Differences in relation to pupil prior attainment and primary vs. secondary schools. Learning and Instruction 21(6):715-730.
Crossref
|
|
|
|
|
Bramasta D (2015). Comparison and Analysis of Spatial Elementary School Distribution and Teacher Certification by Digital Mapping Based on Geographic Information System. Dinamika 7(2):53-70.
|
|
|
|
|
Button B, Trites S, Janssen I (2013). Relations between the school physical environment and school social capital with student physical activity levels. BMC Public Health 13(1):1191.
Crossref
|
|
|
|
|
Cunningham M, LaMois P, Mapala Y, Inglis A (2014). Using Participatory Mapping to Assess Service Catchment and Coverage. Guidance from the Iringa Participatory Mapping Exercise. Available at:
View
|
|
|
|
|
De la Fuente H, Rojas C, Salado M, Carrasco J, Neutens T (2013). Socio-spatial inequality in education facilities in the Concepción metropolitan area (Chile). Current Urban Studies 1(4):117-129.
Crossref
|
|
|
|
|
Fabiyi OO, Ogunyemi SA (2015). Spatial Distribution and Accessibility to Post Primary Educational Institution in Ogun State, Southwestern Nigeria: Case Study of Yewa South Local Government Area, Nigeria. Journal of Scientific Research and Reports 5(7):542-552.
Crossref
|
|
|
|
|
Federal Ministry of Education (FMoE) (2015). Education Statistics Annual Abstract, 2015. Available at:
View
|
|
|
|
|
Federal Ministry of education (FMoE) (2017). Education Statistics Annual Abstract, 2016/17 Available at:
View
|
|
|
|
|
Figueroa LL, Lim S, Lee J (2016). Spatial analysis to identify disparities in Philippine public school facilities. Regional Studies, Regional Science 3(1):1-27.
|
|
|
|
|
Gökçe N, Kaya E, AktaÅŸ SG, Kantar YM (2016). An Overview of Equal Educational Opportunities i n Turkey: A Spatial Analysis of Classrooms in Rural and Urban Primary Schools. Journal of Education and Training Studies 5(1):67-78.
Crossref
|
|
|
|
|
Islam R, Ghani AB, Kusuma B, Theseira BB (2016). Education and Human Capital Effect on Malaysian Economic Growth. International Journal of Economics and Financial Issues 6(4):1722-1728.
|
|
|
|
|
Jana M, Khan A, Chatterjee S (2014). Issues in Quality of Primary Education in Backward Areas of Jhargram Sub-Division: An Exploration of Policy Options for Adjustment, Revitalization and Expansion. Available at:
View
Crossref
|
|
|
|
|
Jones S (2016). How does classroom composition affect learning outcomes in Ugandan primary schools?. International Journal of Educational Development 48:66-78.
Crossref
|
|
|
|
|
King'oina JO, Kadenyi MM, Mobegi FO (2017). School Climate as a Determinant of Pupils' Academic Performance in Public Primary Schools in Marani Sub-County, Kenya. International Journal of Education and Research 5(5):265-278.
|
|
|
|
|
Ministry of Works and Urban Development (MWUD) (2017). Urban planning implementation manual (Mathos Asfaw) Addis Ababa, Ethiopia 120 p. Available at:
View
|
|
|
|
|
Mulei KO, Waita JK, Mueni BK, Mutune JM, Kalai J (2016). Pupil-Teacher ratio and its impact on academic performance in public primary schools in central division, Machakoscounty, Kenya. International Journal of Research in Engineering, IT and Social Sciences 6:62-80.
|
|
|
|
|
Mustapha OO, Akintunde OS, Alaga AT, Badru RA, Ogbole JO, Samuel PO, Samuel SA (2016). Spatial Distribution of Primary Schools in Ilorin West Local Government Area, Kwara State, Nigeria. Journal of Scientific Research and Reports 9(6):1-10.
Crossref
|
|
|
|
|
Nepal B, Maharjan R (2015). Effect of School's Physical Facilities on Learning and Outcomes of Students in Nepal. Journal for Studies in Management and Planning 1(6):266-279.
|
|
|
|
|
Ngigi MM, Musiega D, Mulefu FO (2012). Planning and Analysis of Educational Facilities using GIS: A Case Study of Busia County, Kenya. AGSE 2012–FOSS4G-SEA, 261.
|
|
|
|
|
Ogunyemi SA, Muibi KH, Eguaroje OE, Fabiyi OO, Halilu AS (2014). Geospatial approach to evaluation of accessibility to secondary educational institution in Ogun State, Nigeria. Earth and Environmental Science 20:1-13.
Crossref
|
|
|
|
|
Oluwadare OI, Olujimi J (2011). Regional analysis of locations of public educational facilities in Nigeria: The Akure region experience. Journal of Geography and Regional Planning 4(7):428-442.
|
|
|
|
|
Pengfei TA, Jingjing XI, Jing LU, Guolei CH (2014). Spatial accessibility analysis of primary schools at the county level based on the improved potential model: A case study of Xiantao City, Hubei Province. Progress in Geography 36(6):697-708.
|
|
|
|
|
Tarc P (2013). What Larger Conditions and Logics Are in Play? Responding to" Education as a Human Right in the 21st Century". Democracy and Education 21(1):1-9.
|
|
|
|
|
The Federal Democratic Republic of Ethiopia (FDRoE) (2015). Education Sector Development Programme V (ESDP V) 2008 - 2012 E.C. 2015/16. Federal Ministry of Education. Available at:
View
|
|
|
|
|
The United Nations Children's Fund (UNICEF) (2014). Education.
|
|
|
|
|
United Nations International Children's Emergency Fund (UNICEF) (2014). Education: The case for support. UNICEF 2014 Annual report on Education.
|
|
|
|
|
United Nations Educational, Scientific and Cultural Organization (UNESCO) (2009). World Conference on Higher Education: The New Dynamics of Higher Education and Research for Societal Change and Development.
|
|
|
|
|
Urwick J, Junaidu SU (1991). The effects of school physical facilities on the processes of education: A qualitative study of Nigerian primary schools. International Journal of Educational Development 11(1):19-29.
Crossref
|
|
|
|
|
White G, Ruther M, Kahn J (2016). Educational Inequality in India: An analysis of gender differences in reading and mathematics. In IHDS Working Paper 2016-2.
|
|
|
|
|
World Development Report (2018). Learning to Realize Education's Promise.
|
|


