ABSTRACT
The Densu River basin is one of the most import water resources in Ghana. It is a source of drinking water to more than half of the five (5) million populations of Accra and seven other communities within the basin. Rapid population growth and increasing development pressure within the basin is changing the basin land cover into settlement. This study examined the trend in land use and land cover changes that occurred within the basin from 1986 to 2018. The results show that between the years 1986 and 2018, the area within the basin covered by settlement and bare land increased from about 3% to about 25%. Within the same period, the forest area reduced from nearly 49% to about 17%. Shrub and grassland increased from 27% to about 49%, farmland decreased from nearly 20% to about 8% and the water bodies changed only marginally, from 1.02 to 1.15%. In general, the most significant changes in land use and land cover occurred between 1986 and 2002. After 2002 the land use and land cover changes either slowed down or changed course. This can be attributed to the establishment of the Densu Basin Board in 2003. Through the board a riparian Buffer Zone Policy was developed with the aim of protecting and maintaining the vegetation cover within the basin so as to improve water quality.
Key words: River Basin, land use and land cover changes, water resources management.
Land use refers to human actions on the land surface that modifies the land cover and it defines how lands are used while land cover is the characteristic physical covering on the land surface that describes an area (Food and Agriculture Organization, 1997). Studies have suggested that 83% of the earth's land surface has been affected by human settlements and activities, leaving only 17% in the wilderness (CIESIN, 2002). In most cases, an anthropogenic influence on biophysical factors results in land use and land cover changes (Addae and Oppelt, 2019). The alteration of the world’s land surface has reached an unprecedented pace and magnitude and this has resulted in changes in land use (human purpose or intent applied to these attributes) and land cover (biophysical attributes of the earth’s surface) (Lambin et al., 2001).
The driving force behind land use and land cover changes is several. Ayivor and Gordon (2012), stated that land use and land cover changes are mostly driven by the rural economy of an area and hence it is place specific. Geist and Lambin (2002), concluded that land use and land cover changes are driven by forces that have varying geographical and historical contexts and their influences are mostly due to their proximity to the area. Several researchers have also concluded that land use and land cover changes, especially urbanisation, is mostly driven by population growth and rural-urban migration as a result of human needs for economic prosperity and unequal distribution of social amenities (Addae and Oppelt, 2019; Kuma and Ashley, 2008; Geist and Lambin, 2002). The problem of rapid urbanization as a result of high population growth in Ghana is putting a great deal of pressure on land use and land cover (Asamoah et al., 2018).
Land use and land cover (LULC) changes resulting in environmental degradation and deforestation threatens the sustainability of water resources (Africa Commission Report, 2000). Changes in LULC are very important as they influence the flow of water on the land surface and different LULC changes generates different hydrological responses. Urbanization generates negative hydrological responses because it mostly results in flooding, high sediment transportation resulting in siltation and water pollution (Aduah et al., 2015). The conversion of forest land to other land uses such as agriculture or grassland has resulted in an increase in infiltration and a decrease in run off and stream discharge at Shalamulun River watershed in China (Yang et al., 2012).
A study by Attua et al. (2014) found a signiï¬cant correlation between increases in an urban/bare land to turbidity and dissolved oxygen (DO) in the Densu River and also concluded that a changes in agricultural lands were signiï¬cantly correlated with the pH, nitrate and phosphate concentration in the water. Kuma and Ashley (2008) concluded in their studies that between 1980 and 2007, precipitation and potential evapotranspiration within the Weija reservoir area reduced annually at a rate of 0.93 and 0.14%, respectively. The combined effect of the two is that natural runoff should possibly be decreasing. However, runoff into the Weija reservoir increased as a result of vegetation loss within the same period which generally increased runoff rate into the reservoir. The increasing urbanisation activities within the Densu River basin reduced the vegetative cover along the river, the reservoir and the delta making soils more vulnerable to erosion into the river, the reservoir and the delta, with serious implications on channel morphology and sedimentation (Kusimi, 2009).
Most of the communities within the basin depend on the Densu River for their survival. The Densu River has many uses such as for fishing especially along the reservoir, for irrigation farming specially around Nsawam and as a source of drinking water. The Densu River has eight water supply schemes that provide portable water to the communities within the basin and some communities outside the basin. Five of the water supply schemes depend directly on the Densu River while the remaining three are supplied with groundwater.
The current capacity of the Weija Dam drinking water treatment plant is 54.2 MGD. This treatment plant supplies water to more than half of the five million population in Accra-the capital city of Ghana (mostly in the western part of Accra, that is, Korle-Bu, Dansoman, Accra Central, Darkuman, Sowutuom, Achimota, Mallam, Bortianor) and Kasoa in the Central Region. The river is therefore very crucial in terms of its drinking water supply, irrigation farming and fishing. Any negative effect on the Densu River is likely to cause a major problem to many people who depend on the river for their daily survival.
This study therefore investigated the trend of land use and land cover change in the Densu River Basin from 1986 to 2018 and its impact on the water system. The speciï¬c objective is to:
(1) Develop historic land-use/cover maps for multiple years using Landsat images of 30 m × 30 m spatial resolution;
(2) Conducting change detection and analysing trends in land use/cover changes from 1986 to 2018 for the Densu basin, the Weija reservoir and the Densu Delta (Sakumo I lagoon) site;
(3) Assessing impacts of land use/cover change on the Weija reservoir and the Densu Delta (Sakumo I lagoon) site.
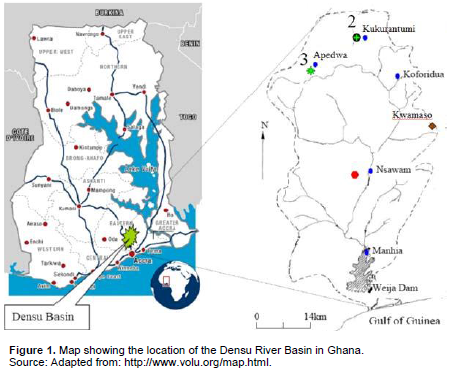
The study was conducted for the Densu River basin. The basin is part of the Coastal River System group in Ghana with an estimated total area of about 2,600 km2. It is located between latitude 5°30’N - 6°17’N and longitude 0°10’W - 0°37’W (Figure 1). The river covers a distance of about 116 km from the Atiwa Mountains where it takes its source to the Weija Dam and then it enters the sea through the Densu Delta Ramsar site also known as Sakumo I Lagoon at Bortianor in the Ga Municipality. The basin spans three administrative regions of Ghana, namely, the Central, Greater Accra and Eastern regions. It covers 10 administrative districts in Ghana, most of which are in the Eastern Region. In terms of land area, 72% of the basin is within the Eastern region, 23% is within the Greater Accra and 5% is within the Central Region. Data from the 2000 Ghana population and housing census indicate that the average population density within the basin is 387 pop/km2, which is five (5) times higher than the national average population density of 77 pop/km2 (WCR, 2007). This high population density within the catchment has resulted in the over exploitation of the Densu River. In fact, the Densu River is one of the most exploited rivers in Ghana (WRC, 2007).

The original ecology of the Densu Basin was moist semi-deciduous forest with thick undergrowth featuring rich flora and fauna. The basin has two protected forest reserves within the East Akim district namely the Atewa and Apedwa forests. There are also two other small reserves located in the Fanteakwa and Yilo Krobo districts.
The Densu Delta site also known as the Sakumo I Lagoon is where the Densu River enters the sea. The site constitutes one of Ghana’s internationally declared protected wetland areas (Ramsar site) because of its sanctuary for migrating seashore bird species which utilise the delta site for roosting and as nesting grounds.
Protection activities in the area are undertaken by the Wildlife Division of the Forestry Commission, in close consultation with Panbros Salt Company, which owns part of the Ramsar site. A large portion of the Sakumo I Lagoon has been lost due to urban development. Most of the protected vegetation along the lagoon have been cleared for urban development resulting in the flooding of some parts of the area around the lagoon during parts of the raining season (May-July). The flooding becomes worse when the spillway at the Weija dam is opened because of the encroachment of the waterway from the dam and the area of the Densu delta which normally serves as a receptor to the flood water from the dam.
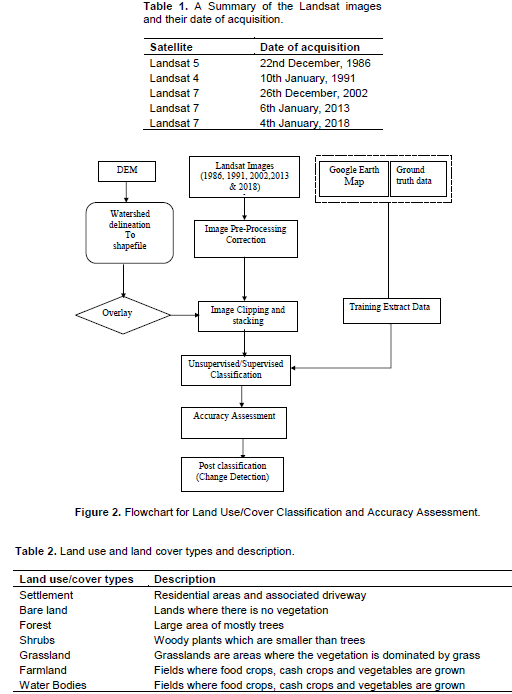
A Landsat Thematic Mapper (TM) image for the years 1986, 1991, 2002, 2013 and 2018 were acquired for the land use and land cover classification maps. The idea was to determine the land use and land cover changes for a minimum period of 30 years. The images were freely downloaded from the United States Geological Survey Earth Explorer webpage (https://earthexplorer.usgs.gov). A summary of the Landsat images and their date of acquisition is shown in Table 1.
The sensors on board Landsat 4 and 5 have a spatial resolution of 30 m×30 m for bands 1 to 5 and band 7 while the thermal band 6 has a spatial resolution of 120 m×120 m. Landsat 7 carries the Enhanced Thematic Mapper Plus (ETM+) with a 30 m×30 m spatial resolution for band 1 to 5 and Band 7, and a 60 m×60 m spatial resolution for thermal band a 6 and 15 m×15 m spatial resolution for Panchromatic Band 8.
The flowchart in Figure 2 indicates the processes of obtaining the Land Use/Cover maps within the Densu River Basin using QGIS and ENVI. The selected downloaded Landsat images used for the land use/cover were with less or no cloud cover as cloud cover can lead to mis-classification of land use/cover. The images were pre-processed for atmospheric correction using QGIS. After the pre-processing of the images, the Area of Interest (AOI) which is the Densu River basin area was obtained from the images using the Densu River Basin Shapefile in QGIS. The extracted images were then stacked depending on the Landsat satellite used in acquiring the image. For Landsat 4, 5 and 7 images of Band 1 to 5 and then Band 7 were stacked together. The stacked image was then processed in ENVI for the land use/cover classification. Both supervised and unsupervised classifications were performed in ENVI. The unsupervised classification was performed first and the aim was to identify areas with similar classes to aid supervised classification.
The supervised classification was undertaken using ground truth data that were obtained by driving across the basin and taking coordinates of different LULC classes, with the aid of a handheld Global Positioning System (GPS). The history of the extent and trend of land use and land cover changes were also obtained by talking to chiefs and opinion leaders in towns and villages within the basin. This helped in determining the previous LULC at different locations in the basin. The land use/cover classes for which data were obtained are summarized in Table 2.
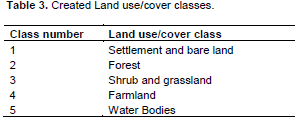
The supervised classification was done with ENVI using the ground truthing data as the training data for the different classes. The five created LULC classes are shown in Table 3.
This was done by deï¬ning training areas for the various classes of Settlement and Bare land, Forest, Shrub and Grassland, Farmland and Water Bodies using the ground truth data obtained from the basin. The maximum likelihood classification algorithm was selected. This is because the maximum likelihood classification algorithm is the least affected by the size of training data sets and when a small-sized training data set is used, it still performs well (Li et al., 2014).
Densu River basin
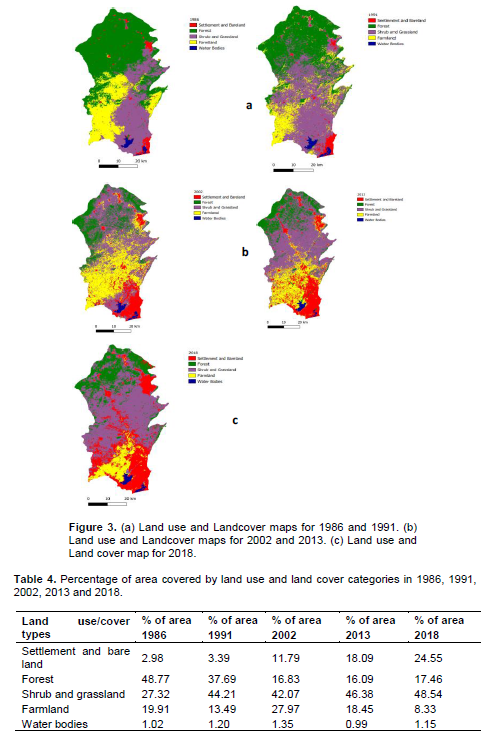
The derived land use and land cover maps for the Densu basin for the years 1986, 1991, 2002, 2013 and 2018 are shown in Figure 3a, b and c.
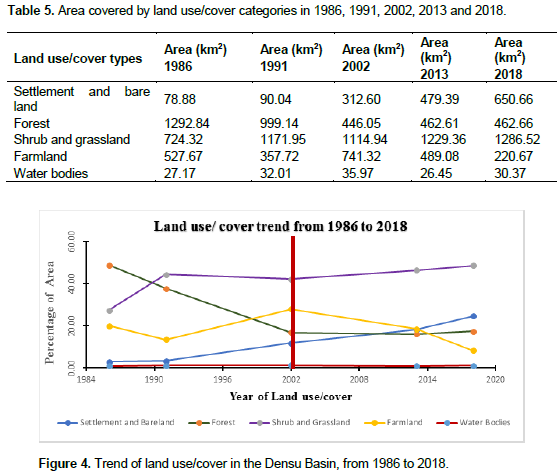
The distribution of the land use and land cover classes in terms of percentage in area and the total area are shown in Tables 4 and 5.
The trend in land use and land cover changes is also shown in Figure 4. The land use/cover class that increased most within the period is settlement and bare land whilst the land use/cover class that reduced most within the period is forest.
Between the year 1986 to 2018, the area within the basin covered by settlement and bare land increased from about 3% to about 25%. Within the same period, the forest area reduced from nearly 49% to about 17%. Shrub and grassland increased from 27% to about 49%, farmland decreased from nearly 20% to about 8% and the water bodies changed only marginally, from 1.02 to 1.15%.
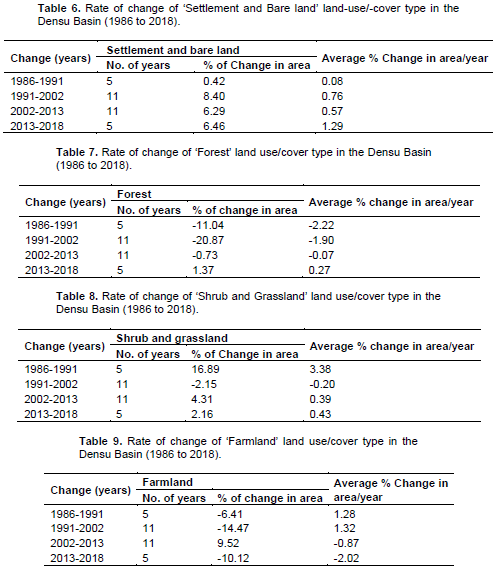
The area of settlement and bare land consistently increased throughout the period from 1986 to 2018. This is mostly due to the increasing urbanisation in Accra, Kasoa and the other major towns within the basin such as Koforidua, Nsawam, Suhum and Adeiso. Table 6 shows the trend in increasing settlement and bare land from 1986 to 2018. The highest average yearly increase in settlement and bare land occurred between 2013 and 2018 while the lowest rate occurred between 1986 and 1991.
There was a general decreasing trend in the forest area between 1986 and 2013 (Table 7). However, the rate at which the forest area was reducing slowed down significantly to an annual rate of 0.07% between 2002 and 2013 from a rate of 1.90% between the years 1991 and 2002. The forest area then increased slightly by an average yearly rate of about 0.27% between the years 2013 and 2018.
The shrub and grassland area increased, on average, from 1986 to 2018. The most significant increase occurred between 1986 and 1991 at an annual rate of 3.38% (Table 8). This was followed by a marginal reduction between 1991 and 2002 at a rate of 0.20%. The trend changed to an increase between 2002 and 2013 at an annual rate of 0.39%, with a further increase between 2013 and 2018 at an annual rate of 0.43%.
The area for farmland generally reduced from 1986 to 2018 (Table 9). Between 1986 and 1991, the farmland area reduced yearly at a rate of 1.28%. On the contrary, there was an increase between 1991 and 2002, at an annual rate of 1.32%. It then decreased again between 2002 and 2013 at a rate of 0.87% and further decreased by 2.02% per year between 2013 and 2018. This therefore shows that farming activities decreased within the basin. Table 9 shows a summary of the trend of farmland within the Densu River basin from 1986 to 2018.
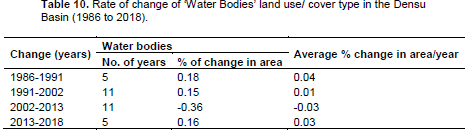
The area occupied by water bodies did not change significantly between 1986 and 2018 (Table 10). The year on year changes in area occupied by the water bodies were not significant. The average rate of change is 0.01%. A summary of the rate of change in the area occupied by water bodies between 1986 and 2018 is shown in Table 10.
In general, the most significant changes in land use and land cover occurred between 1986 and 2002. After 2002 the land use and land cover changes either slowed down or changed course. The settlement and bare land and shrub and grassland changes that occurred between 1986 and 2002 is about three times that which occurred between 2002 and 2018. Forest area reduced by about 66% between 1986 and 2002 but increased slightly by about 4% between 2002 and 2018. Farmland increased by about 40% between 1986 and 2002 but reduced by about 70% between 2002 and 2018.
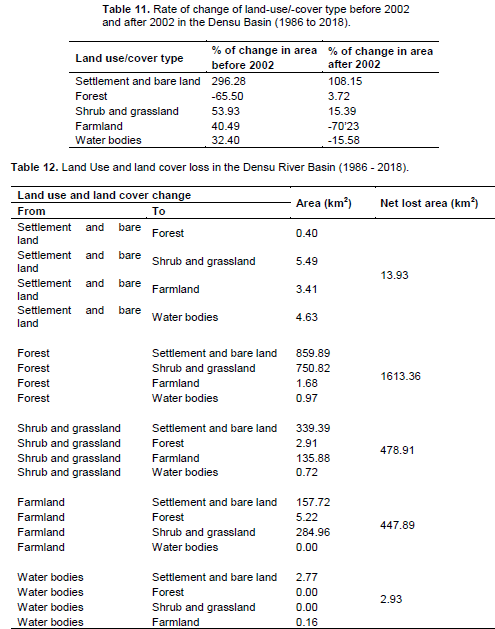
Table 11 shows the changes in land use and land cover that occurred before 2002 and the changes that occurred after 2002.
The difference in trend can be attributed to the establishment of the Densu Basin Board (DBB). The DBB was established in 2003 but officially inaugurated in March 2004. It included all interested parties and the key stakeholders (including interest groups and traditional authorities) within the basin with the aim of sustainably managing the water resources within the basin. Through the Board a riparian Buffer Zone Policy was developed with the aim of protecting and maintaining the vegetation cover within the basin so as to improve water quality. The Densu Integrated Water Resources Management (IWRM) Plan was also put together in 2007 with an action plan for implementation.
Table 12 shows the trend in land use and land cover losses within the Densu River basin from 1986 to 2018. Forest lost the largest area. Between 1986 and 2018, about 1,613 km2 of forest cover changed to other land use/cover types. This means that, within the period of 32 years, more than half of the area covered by forest within the basin changed to other types of LULC. The depletion of the forest will have a significant effect on the Densu River as most forests tend to serve as a cover for rivers and shield them from a high rate of evapotranspiration.
Shrub and Grassland and Farmland also lost a significant area between 1986 and 2018. Shrubs and Grassland lost a total area of about 479 km2 while farmland lost about 448 km2 (Table 12). This implies that farming activities have reduced significantly in the basin. Shrubs and Grassland also tend to shield the water bodies. Their loss therefore exposes the water bodies to high evapotranspiration levels.
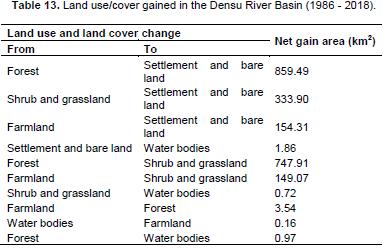
Table 13 shows a summary of the LULC gained between 1986 and 2018 within the Densu River basin.
The biggest gainer was settlement and bare land. Within the period, settlement and bare land gained an area of 859.49 km2 from forest, 333.90 km2 from shrub and grassland and 154.31 km2 from farmland. However, settlement and bare land lost an area of 1.86 km2 to water bodies.
Forest land use and land cover was the biggest loser within the period. Forest lost 859.49 km2 to settlement and bare land, 747.91 km2 to shrubs and grassland, and 0.97 km2 to water bodies. Forest gained only 3.54 km2 from farmland within the period.
Shrub and grassland lost 333.90 km2 to settlement and 0.72 km2 to water bodies. It however gained 747.91 km2 from forest and 149.07 km2 from farmland. Farmland lost 154.31 km2 to settlement, 149.07 to shrub and grassland and 3.54 to forest. It however gained 0.16 km2 from water bodies. Water bodies gained 1.86 km2 from settlement and bare land, 0.72 km2 from shrub and grassland and 0.97 km2 from forest but lost 0.16 km2 to farmland. The biggest loser in terms of the land use and land cover area is the forest and the biggest gainer is the settlement and bare land.
The Weija reservoir
The construction of the dam for Weija reservoir started in 1974 and it was completed in 1978 (Anon, 1997). The source of water to the reservoir is the Densu River. The dam covers a total area of 20.5 km2 with an effective storage capacity of 133 million m3. The maximum design height is 15.25 m and the normal water level is 14.33 m (WRC, 2007; Kuma and Ashley, 2008). The projected daily inflow into the reservoir is 315,000 m3 and the projected daily upstream water consumption is 40,500 m3 (Anon, 1997).
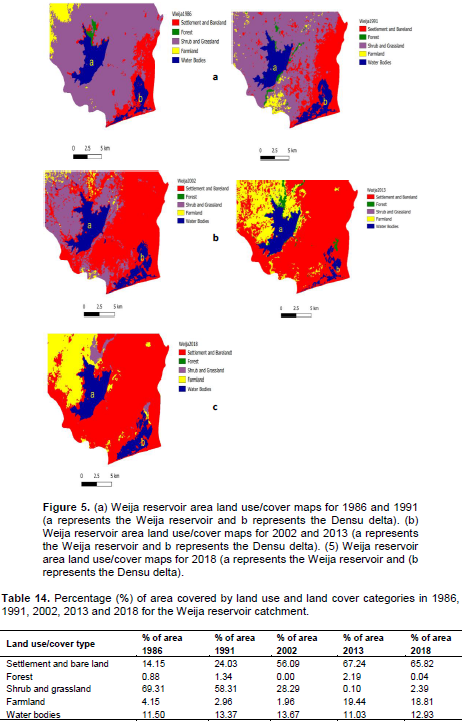
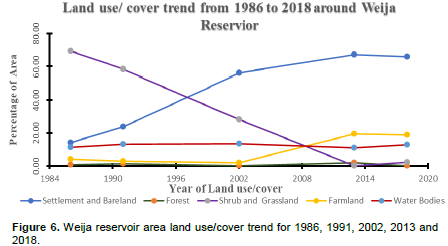
Land use/cover trend in the immediate surroundings of the reservoir is needed to analyze the impact of urbanization on the reservoir. The derived land use/cover maps for 1986, 1991, 2002, 2013 and 2018 for the Weija reservoir and its immediate area are as shown in Figure 5.
The distribution of the land use and land cover classes in terms of percentage of area for the catchment of the Weija reservoir are shown in Table 14
It can be observed that much of the area around the reservoir and the delta has been converted to settlement and bare land. The trend in the land use change within the environment of the Weija reservoir is as shown in Figure 6.
The biggest gainers are settlement and bare land and the biggest loser is the shrub and grassland. It can be observed that the shrub and grassland used to surround and protect the reservoir have been converted into settlement. The area for farmland and the water bodies did not substantially change. In terms of percentage, settlement and bare land increased from about 14% in 1986 to about 66% in 2018 while shrub and grassland reduced from about 69% in 1986 to 2% in 2018. Farmland also gained marginally from 4% in 1986 to 18% in 2018. The area covered by water remained almost constant.
The Densu Delta (Sakumo I lagoon)
The Densu Delta known as Sakumo I lagoon is an internationally declared protected wetland area (Ramsar site). The site is already a source of conflict between Ghana Water Company Limited (GWCL) who are managers of the dam and the owners of the salt industry at the delta and the fishing communities (WRC, 2007). The flow of water into the delta area is controlled by GWCL at the dam site. Fishermen’s catch and salt production is also determined by the level of water at the delta site. Peak salt production occurs when the delta is a dry site and fishermen’s catch also is reduced drastically when the water level at the delta is high (WRC, 2007).
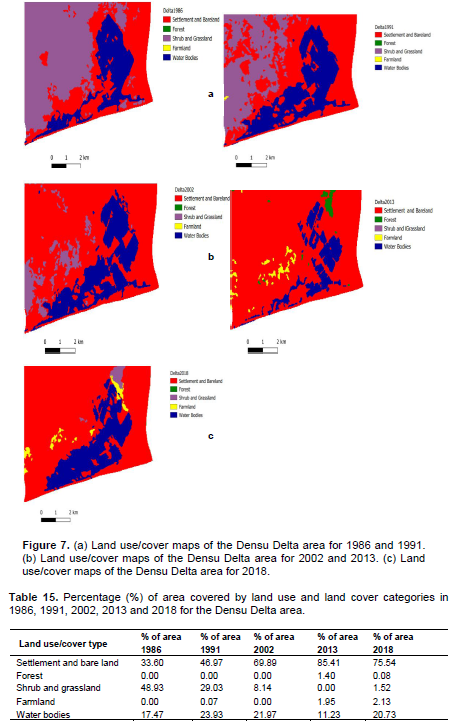
Any time GWCL opens the spillway at the Weija Dam site, a lot of homes get flooded at the delta. The derived land use and land cover maps for 1986, 1991, 2002, 2013 and 2018 within the area of the Densu Delta are as shown in Figure 7.
The distribution of the land use and land cover classes in terms of percentage in area for the Densu Delta area is shown in Table 15.
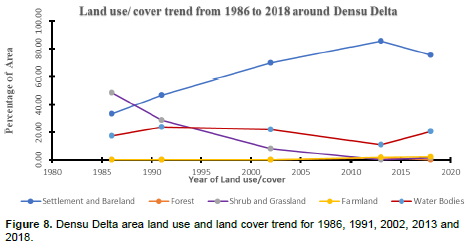
The lands around the Densu Delta area are also changing to settlement and bare land. The changing trend is shown in Figure 8.
The area for settlement around the Densu Delta increased from about 34 to 76% between 1986 and 2018. This mostly came about as a result of the loss in area for shrub and grassland. In the same period, the area for shrub and grassland reduced from about 49% in 1986 to 2% in 2018. This means that the shrub and grassland used to serve as a reservoir for the spilled water for the Weija Dam is being converted into residential area. This has become a problem because anytime the spillway at the Weija Dam is opened, a lot of residential area around the Densu Delta gets flooded. Within the same period, farmland increased slightly from 0 to 2.13%. The area for water bodies however remained almost constant.
The study concluded that land use and land cover have significantly changed from 1986 to 2018 within the Densu River basin. It was observed that the area for settlement and bare land was the highest gainer while the area for forest was the highest loser. Within the period, more than half of the forest area was lost while the settlement and bare land increased more than seven fold. Most of the areas from forest, shrub and grassland, farmland and water bodies changed into settlement and bare land. A significant area of forest also changed into shrub and grassland. The area covered by settlement and bare land and shrub and grassland increased between 1986 and 2018 while the areas covered by forest and farmlands decreased within the same period. The area covered by water bodies did not significantly changed within the period.
The increasing trend of settlement and bare land within the Densu River basin and especially around the river is a worrying situation for the water quality of the river. The 35 m buffer along the river for its protection has been encroached upon.
The land use and land cover have also significantly changed around the Weija reservoir between 1986 and 2018. Most of the shrubs and grassland used to protect the lake have been converted to settlement and bare land and this is likely to affect the sustainability of the reservoir. Between 1986 and 2018, settlement and bare land area around the Weija reservoir more than quadrupled whiles the area for shrub and grassland almost became extinct. As a result of the increasing urbanization around the reservoir, the Water Resources Commission in 2010 inaugurated the Weija Lake protection association with the sole aim of protecting the lake against the high level of pollution.
The Densu Delta is an internationally declared protected wetland area (Ramsar site) as it is recognized for its role as a sanctuary for migrating seashore bird species. The area was therefore supposed to be conserved. However, the shrub and grassland around the delta have been converted mainly to residential area. This will greatly affect the ecosystem of the Densu Delta and hence affect the sustainability of the delta. Between
1986 and 2018, settlement and bare land area around the Densu Delta are more than double while the area for shrub and grassland almost became extinct.
The establishment of the Densu Basin Board in 2003 and the implementation of the Densu Integrated Water Resources Management (IWRM) helped in slowing down the changes in land use and land cover within the basin.
The authors have not declared any conflict of interests.
REFERENCES
|
Addae B, Oppelt N (2019). 'Land-Use/Land-Cover Change Analysis and Urban Growth Modelling in the Greater Accra Metropolitan Area (GAMA), Ghana. Urban Science 3(1):26.
Crossref
|
|
|
|
Aduah MS, Warburton ML, Jewitt G (2015). Analysis of land cover changes in the Bonsa catchment, Ankobra Basin, Ghana. Applied Ecology and Environmental Research 13(4):935-955.
Crossref
|
|
|
|
|
Africa Commission Report (2000). The Africa Water Vision for 2025: Equitable and Sustainable Use of Water for Socioeconomic Development'.
|
|
|
|
|
Anon (1997). Consultancy for the study of the ATMA development and Investment programme and of the Rehabilitation/Replacement of Kpong-Tema-Accra water pipeline pp. 4-21.
|
|
|
|
|
Asamoah JN, Osei EJ, Amoah AS, Acquah PC (2018). Assessment of a Landsat 8 image of Atiwa District in Ghana using ECHO, Random Forest, Minimum Distance and Maximum Likelihood Classification Algorithms. In International Conference on Applied Science and Technology Conference Proceedings 5(1):183-193.
|
|
|
|
|
Attua EM, Ayamga J, Pabi O (2014). Relating land use and land cover to surface water quality in the Densu River basin, Ghana. International Journal of River Basin Management 12(1):57-68.
Crossref
|
|
|
|
|
Ayivor JS, Gordon C (2012). Impact of land use on river systems in Ghana. West African Journal of Applied Ecology 20(3):83-95.
|
|
|
|
|
Center for International Earth Science Information Network (CIESIN) (2002) Last of the Wild Project, Version 1 (LWP-1): Global Human Footprint. Dataset (Geographic). Wildlife Conservation Society (WCS) and Center for International Earth Science Information Network (CIESIN), Palisades, NY. URL Available at:
View
|
|
|
|
|
Food and Agriculture Organization (FAO) (1997). '"AFRICOVER land cover classification". Technical Document on the AFRICOVER Land Cover Classification Scheme: A Dichotomous, Modular-Hierarchical Approach.' Available at:
View
|
|
|
|
|
Geist HJ, Lambin EF (2002). Proximate Causes and Underlying Driving Forces of Tropical Deforestation. Tropical forests are disappearing as the result of many pressures, both local and regional, acting in various combinations in different geographical locations. BioScience 52(2):143-150.
Crossref
|
|
|
|
|
Kuma JS, Ashley DN (2008). Runoff estimates into the Weija reservoir and its implications for water supply to Accra, Ghana. Journal of Urban and Environmental Engineering 2(2):33-40.
Crossref
|
|
|
|
|
Kusimi JM (2009). Analysis of sedimentation rates in the Densu river channel: The result of erosion and anthropogenic activities in the Densu Basin. West African Journal of Applied Ecology 14:1-14.
Crossref
|
|
|
|
|
Lambin EF, Turner BL, Geist HJ, Agbola SB, Angelsen A, Bruce JW, Coomes OT, Dirzo R, Fischer G, Folke C, George P (2001). The causes of land-use and land-cover change: moving beyond the myths. Global Environmental Change 11(4):261-269.
Crossref
|
|
|
|
|
Li C, Wang J, Wang L, Hu L, Gong P (2014). Comparison of classification algorithms and training sample sizes in urban land classification with Landsat thematic mapper imagery. Remote Sensing 6(2):964-983.
Crossref
|
|
|
|
|
Water Resources Commission (WRC) (2007). Water Resources Commission, Ghana Densu River Basin - Integrated Water Resources Management Plan.
|
|
|
|
|
Yang X, Ren L, Singh VP, Liu X, Yuan F, Jiang S, Yong B (2012). Impacts of land use and land cover changes on evapotranspiration and runoff at Shalamulun River watershed, China. Hydrology Research 43(1-2):23-37.
Crossref
|
|