There is an emerging debate in the literature of urbanism that public open space is in crisis in the cities of developing countries due to the increasing trends of urbanization and in-migration. With the significant growth of the urban population and rapid expansion of the city, the land demand for housing and other infrastructure development is very high. The high rate of urbanization due to which encroachment, high speculation, use change, etc. are the major reasons for decreasing public open spaces. There are many inferences that public open spaces are decreasing in Kathmandu Metropolitan City (KMC) as Tundikhel; an important public open space located in the heart of Kathmandu is decreasing in its size and has changed in its use over time. At present, KMC does not have a sizable public open space for emergency uses such as evacuation, relief, recovery, and reconstruction during the catastrophic hazards. Analysis of historical imagery and the changing patterns of land use reveal that the decreasing trends of open spaces may lead more vulnerable to the city as it does not have public open space for disaster management in an emergency need. Moreover, it may have adverse impacts on sociability and well-being as people do not get space for public life activities.
Public open space is a place that is not closed or blocked up and provides access to people for enjoyment, social gatherings, organizing political events, religious, sports, commercial activities, and is controlled and managed for the public interest (Madanipour, 2003; Wooley, 2003). There is a clear distinction between public open space and open space. Open space can be accounted for all types of open spaces including private and public open areas, whereas public open space is the open space that is accessible to all people without any restrictions. It means all public open areas are open space but all open areas may not be the public open space. In the urban contexts, open spaces contribute to the urban residence that underpins many social, ecological, and economic activities, and are essential to the healthy functioning of urban life and environment (RECPHEC, 2016; UN-Habitat, 2018). These spaces are valuable for urban residence as it provides commonplace for recreation, health enhancement, developing social networking, and enhancing peoples’ well-being. There is increasing debate among the academicians that public open spaces are the essential assets of urban life. But with a rapidly increasing population causing a high growth rate of urbanization has been demanding more land for housing, infrastructure development in the cities of developing countries which
has led to decreasing public open spaces. Evidence reveals that public open spaces in the cities of developing countries are very limited which may result in limiting public life as people do not get space for public interactions, recreations, and organizing public events (UN-Habitat, 2018). Cities in developing countries are facing a public/open space crisis. High population growth and in-migration leading to urbanization in the cities like KMC are the major causes of decreasing the public/open space. So discussions about urbanization and land-use trend are pertinent to present how these impact in diminishing public/open space in KMC.
Urbanization refers to the process of growth in the proportion of the population living in urban areas with the structural shift in employment from agriculture to non-agriculture pursuits (Sharma, 2003). The structural shift which is expected in urbanization is always in question in the contexts of Nepal’s urbanization process. As the government declared 293 municipalities in the process of the promulgation of the new federal constitution in 2015, most of these municipalities are still having a reliant base of an agricultural economy. Rural areas are converted into urban areas which are lacking not only the basic infrastructures but are lacking employment in other sectors and heavily dependent on agriculture. Due to which migration still exists between towns and regions from the less potential towns to high potential towns and cities (Devkota, 2018; Suwal, 2014). Kathmandu Valley (KV) is still a potential destination of migrants as it poses a high opportunity for employment, education, and better services there. Due to this, potential cultivable lands are converting into built-up forms leaving no proper public open spaces for recreation and sociability. Furthermore, such a scenario has posed many implications associated with the society linking it with well-being, disaster risk reduction, and the environment.
Kathmandu valley is one of the highest populated, and it has been rapidly expanding its settlement areas from the core to its fringes. Valley’s urbanization is highly dynamic in its spatial pattern, complex in its nature, and expanding built-up areas from the core to its fringes converting agriculture land use into urban use (Thapa, 2009). Development in the valley was taking place with uncontrolled infill development and individual housing in the past. Some planned development initiatives have been ongoing in the later stages to make cities reasonably healthy and sustainable with some provisions of open spaces. However, with increasing population inflow in the valley, land value is highly increasing due to which there is high pressure on open space including the agriculture field (KVDA, 2015; Thapa, 2009). Due to its rapid urban expansion, public/open spaces are decreasing in such a way that the government now does not get public land for public infrastructure development in the city. It has also been corroborated that in case of a catastrophic disaster hit, the government would not get essential open space for treatment, emergency relief, rescue, and recovery in Kathmandu.
Despite the conversion of agriculture land into built-up form, there is a trend of decreasing available public land for different uses in Kathmandu. Studies show that Tundikel, a public open space of the heart of Kathmandu has been decreased almost half in the past 60 years in the name of different uses (Shrestha, 2018). Evidence shows that use change, uses transformation, encroachment, etc. are the major reasons for the loss in pubic open space. Similarly, the encroachment of river corridors and some public open spaces in the inner part of KMC is due to the increasing trends of squatter settlements (DUDBC, 2010). Increasing squatter settlements may cause of decreasing public open spaces in Kathmandu. This paper explores urbanization trends and rapid urban expansion in the valley and in KMC to assess how these processes affect to decreasing public/open space and its implications.
This research paper is based on a review of existing literature on open space, urban development, migration, and urbanization of Kathmandu Valley and KMC. Population censuses from 1981 to 2011 and other published secondary data were collected through different sources. Some map data were collected from published and unpublished articles and theses. Data from various institutions such as National Society for Earthquake Technology (NSET), Kathmandu Valley Development Authority (KVDA), Kathmandu Metropolitan City (KMC) were collected, and reviewed and found out the urban expansion pattern in the valley and KMC. Historical images were collected by Google Earth’s historical images and archive data of secondary sources. Similarly, the latest, land use map of KMC was prepared by using the latest Google Earth images in the GIS environment and then further analyzed with image interpretation methods. The GIS data then overlaid with KMC’s previous GIS dataset, 2011 to get changes in urban development trends and patterns to see how changes are occurring to threaten the public/open space. Likewise, empirical data such as research findings and excerpts were used to interpret on encroachment, uses change and transformation of the open area into built-up form. All the data were thoroughly categorized, interpreted, and then analyzed to get the intended objectives. The details of the methods for collecting data and analysis are presented in Figure 1.
Kathmandu Valley and KMC: Brief overview
Kathmandu Valley comprises three districts namely Kathmandu, Lalitpur, and Bhaktapur together which cover an area of 899 km2, whereas the area of the Valley is 721.87 km2. The Valley encloses the entire area of Kathmandu and Bhaktapur districts and 50% of Lalitpur district. Geographically, the valley is situated between 27°31′55″ to 27°48′56″ North Latitude and 85°11′11″ to 85°31′52″ East Longitude. The valley comprises 18 units of municipalities (2 Metropolitan Cities and 16 Municipalities) with some portion of Bagmati and Konjyoson Rural Municipalities of Lalitpur district. The valley extends from 1,425 m in its lowest height to 2,732 m highest height. Kathmandu Metropolitan City is the federal capital city of Nepal which is located in the central part of the valley. It is not only the capital of the Federal Democratic Republic of Nepal but it is the historic, political, commercial, cultural, and tourist center of the country (EMI, 2010). The city is the urban core of the Kathmandu Valley with a total area of 50.67km2. It is situated at an average altitude of 1,350m above sea level. The city is located at 85°19’14” East longitude and 27°42’06” North latitude. Divided into 32 wards, KMC is bordered with Lalitpur Metropolitan City and Kritipur Municipality in the South, Nagarjun Municipality in the West, Tarkeshwor, Tokha and Budhanilkantha Municipalities in the North and Gokarneshwor, Kageshwari Manohara and Bhaktapur Municipalities in the East (Figure 2).

Urbanization trends in Kathmandu Valley
Urbanization is taking place rapidly with a share of 62.6% of the urban population in the total population of Nepal (MoFAGA, 2017) that has been found to increase from 4.88% in 1991 to 62.6% in 2015. The Kathmandu Valley is the most populated urban region and one of the fastest-growing urban agglomerations in South Asia (Muzzini and Apericio, 2013) which has a huge impact on the social and economic pattern in the valley. At present, the Valley accounts for 24.11% of the total urban population of Nepal with a share of 36.06 in KMC (MoFAGA, 2017) alone in the Valley’s urban population. Table 1 shows the urbanization trend and urban growth rate of the KV. In 1981, there were only 3 municipalities with 77,038 population in the valley. After 10 years in 1991, the total number of municipalities in the valley reached 5 with a total of 1,105,379 population. The population of the valley increased by 871,932 with an annual growth rate of 5.3% in 2011 even though the number of municipalities was only 5. The growth rate increased by 5.89% in 2019/2020. During the state restructuring in 2015, the number of municipalities in the valley increased by almost four times with a total of 18 municipalities (including two metropolitan Cities). In-migration is one of the reasons for the increasing population trend in the valley as it is the most common destination of inter-district current migrants as nearly 38% of current migrants go to the central hill, out of which 34% are based in the three districts of KV (Suwal, 2014).
Urbanization trends in KMC with compare to other urban areas
The population of KMC has been increasing rapidly over the past ten years. In-migration towards the city is increasing due to the income and employment opportunities, available urban facilities and services, and of course being the Federal Capital City of Nepal. Likewise, boundary readjustments at different times also played a role in the increase of the city’s population. KMC is one of the major destinations of migrants as it has several potentialities to cater to migrants’ populations here in different economic sectors. As a result, KMC’s population has grown by about 48% over ten years (2011-2019), from 975,453 people in 2011 to 1,442,271 people in 2019 (CBS, 2011; World Population Atlas, 2020). Historically known as Newar settlement (Slusser, 1982; Malla, 1978; Kirkpatrick, 1969; cited in Subedi, 2010), KMC is the most densely populated city in Nepal with a density of 132.34 person per hectare which is higher compared to the aggregate urban population density of all the cities of Nepal recorded at only 3.77 persons per hectare (Subedi, 2010; Muzzini and Apericio, 2013).
Historical trends of population growth in KMC have been observed comparing it with KV and the overall urban population of Nepal. The highest growth rate among the censuses 1952/1954 to 2011, census 1991 poses the highest one with 7.91% of the annual growth rate. After 2001, the growth rate is slightly dropping down but its share in the valley’s population is also shrinking from 67.5% in 2001 to 39.2% in 2011 which implies population concentration is slightly shifted towards nearby towns of KMC. However, after state reconstruction during the implementation of the Federal Constitution of Nepal, there were drastic changes in local government bodies, and the number of municipalities in Nepal reached 293. Now the share of the urban population in the country reached 62.7% and its share in the population of the valley decreased to 24.11%. The demographic situation and trends of population growth of KMC is presented in Table 2.
The unprecedented population increase in Kathmandu over the last few decades is not only due to a higher rate of natural increase but also due to a high level of in-migration and immigration in the valley (Subedi, 2010) and KMC. Being Federal Capital, KMC is the central attraction for services and economic opportunities that contributed to in-migration. Expansion of built-up areas Ishtiaque et al., 2017). KMC experiences a high rate of and rapid conversion of agriculture land into built-up is caused by massive rural-to-urban migration (Rimal, 2011; in-migration with people coming from municipalities and districts outside of the valley (EMI, 2010). As there was 975,453 population in the 2011 census, it has now reached to 1,442,271 and it is projected to be 1,855,000 by 2030 (Muzzini and Apericio, 2013). Among the major causes of increasing rural-to-urban migration in the valley in general and in KMC in particular, are job searching, easy lifestyle, education/training, natural disaster family reasons, political reason in the area of origin. This is obvious that such external migrants are mainly concentrated in KMC as the migrants mainly choose to work and livelihoods (Timalsina, 2011), business, schooling, and diplomatic purposes. Though there is an increasing trend of migrants’ priority at nearby towns of KMC in the later years (Subedi, 2010), there is still a huge bulge of migrants who choose to migrate because of the high probability of getting jobs.
Land use change in KMC
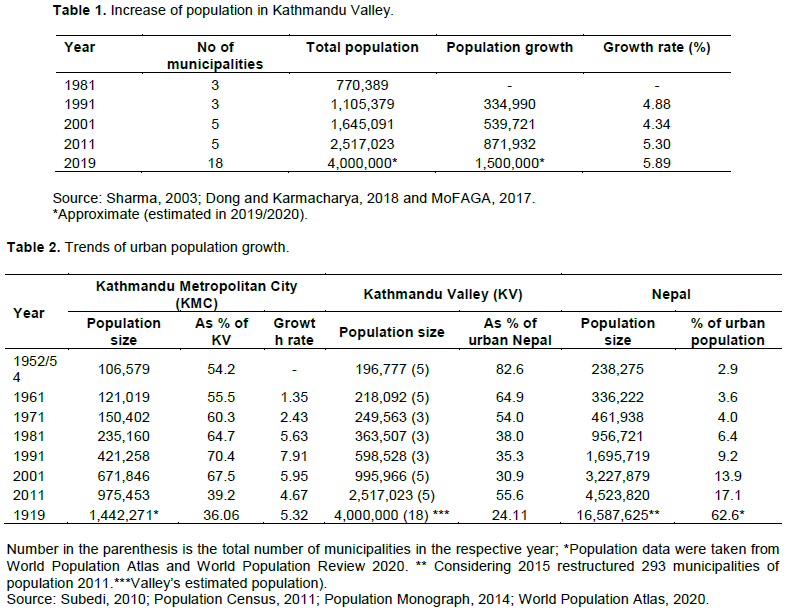
The scenario of land use changes over 40 years reveals that the built-up area in KMC has been increasing tremendously. Evidence shows that there has been a significant land-use change in KMC, converting agriculture and open spaces into the built-up form. This significant urban growth and rapid urban expansion coupled with unmanaged settlement development which has led to various socio-environmental challenges (Thapa, 2009; Rimal, 2011; Ishtiaque et al., 2017) including increase informal settlements, ineffectiveness in implementation of land use zoning, decreasing public resources and poor governance and service delivery (MoUD, 2013; KVDA, 2015). The land-use change from 1980 to 2019 in KMC is observed that within 40 years’ time period, cultivable land is almost disappeared and a significant decrease in open areas (Figure 3). Such changes in land use are the result of rapid in-migration which has resulted in encroachment, depletion of public open spaces, and resulting in its associated consequences.
Land-use changes of KMC comparing with the land use data of 1980, 2011, and 2019 is presented in Table 3. It reveals that in 2019 KMC occupies 58.77% area as mixed-use (residential, commercial) whereas only 5.47% area is under cultivation. Similarly, 8.5% area as road, 7.74% area as institutional, 3.22% area as a recreational area. Changes in land use/cover from 1980 to 2019 reveal a huge change with 40% growth in the built-up area whereas cultivation decreased by almost 53%. Changes have also occurred in an open space which decreased by 1.76% in the same period.
One of the tools for regulating urban growth is by implementing land-use zoning by-laws. However, the land-use zone as prescribed by building by-laws of KVTDC (2007) with 9 zones such as: 1) Old city zone, 2) Residential zone, 3) Institutional zone, 4) Industrial zone, 5) Protected zone/recreational zone, 6) City expansion zone, 7) Surface transport zone, 8) Airport zone, 9) Sports zone has not been translated into implementations so that the development and urban expansion is haphazard (KMC, 2011; MoUD, 2015). Present land use in KMC is predominantly mixed land use which comprises mostly of combined residential and commercial land uses and there is no specific zone that could be viewed in the ground but poses messy urban growth. Reviewing the urban development and growth trends, it reveals that both the agriculture area and open spaces are decreased both in the valley and in KMC. On the one hand, the land use picture of KMC is a kind of messy that has not been regulated by the proposed land-use zoning, on the other hand, open areas have been converting into built-up forms heading to haphazard urban development that ruins the remaining public open space in the days to come.
Trends of increasing built-up area
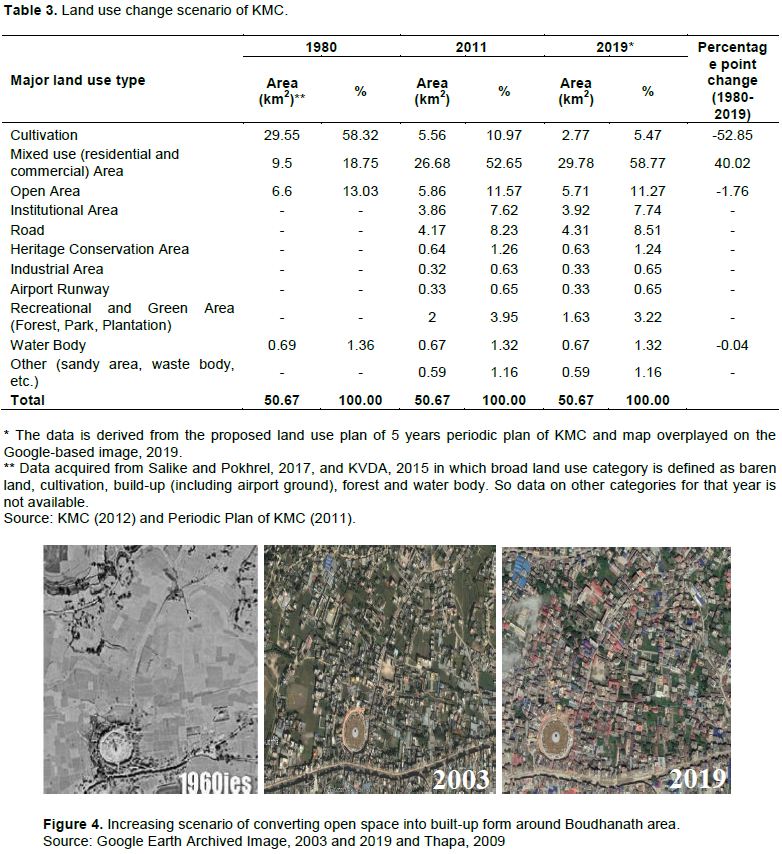
Looking at the trends of change in the built-up area of Kathmandu, it is apparent that the growth trend is increasing in the later decades. The different points of time historic data reveal the growth of the built-up area in KMC is witnessed an unprecedented increase in recent decades. As discussed earlier, decreasing open spaces is the result of increasing in-migration and urbanization in Kathmandu Valley in general and KMC in particular which is justified that urbanization growth in KMC in 1990 was the highest with 7.91. But the decades of 1990 and 2000 also show a significant increase in the built-up areas with a high concentration in the fringe areas (KVDA, 2015) such as Sitapaila, Gongabu, Balaju, Nayabazar, Pepsicola, Sinamangal, Buddhanagar Kapan, Baudha, etc. These decades received a large flow of in-migrants due to political unrest affecting mainly in rural areas of Nepal.
Historical images of different areas of KMC reveals a tremendous growth converting agricultural land into the built-up area. This scenario illustrates to the researcher and urban authorities that open space in KMC will no longer be available due to such unprecedented urban growth. The following figures show how urban growth from some historical point of time taking place resulting in decreasing open spaces in KMC. Figures 4 to 6 reveal different areas of changing built- up form in Kathmandu over time and give a picture of how the urban expansion is taking its pace leading to higher densities in the city causing decreasing open areas. Archive images of different periods reveal that the open agriculture fields have changed into a built-up form with an increasing trend of building construction. Settlement development is taking place with a high concentration in the fringe areas as the city core already became very dense. These scenarios present rapid urban expansion with changing agriculture/open field into built-up that leads to public open space crisis in KMC.

Loss of public open spaces: Ruin to all
As defined above, public spaces are all places publicly owned or of public use, accessible and enjoyable by all for free and without a profit motive (Amanda, 2017; UN-Habitat, 2018), and it contributes to urban residence a place for social interactions and well-being. Public squares, parks, gardens, courtyards, Chautara, barren lands, ponds and lakes, roads, etc. are considered public spaces. There is a growing interest in looking at various implications of public open spaces in the urbanism.
Dense cities like KMC where per capita open space is about only 2 m2 which is quite less than the 9m2 per capita according to WHO standards (UN-Habitat, 2018). Public open space is more valuable in the dense cities of developing countries where individual households do not have open spaces and people use public open space as a place for enhancing social capital and well-being for social interactions and establishing relations in the society (Bordieu, 1986). However, looking at the nature of public open spaces, some open spaces are very limited to public access and some others are having more access to them (Low and Smith, 2006). Therefore, accessibility patterns of public open spaces vary according to the types, functions, and uses of public open spaces in the urban contexts vary according to its location, urban forms, and the settlement structures.
Public spaces play a vital role in the social life of urban communities as these provide space for interactions and establishing relations. Society acts as a self-organizing public service with a shared space in which experiences and values are created, shared and interactions among the community people established (Wooley, 2003; Stavrides, 2016; Massey and Massey, 2005). The public places of different scales at the community level can be a place for sharing feelings, experiences, knowledge, physical exercise for improving their health. Moreover, public open spaces in the urban areas provide a place for economic earnings, livelihoods to urban poor in Kathmandu (Timalsina, 2011). Evidence shows that public open spaces are decreasing rapidly with increasing built-up areas in the valley which has now become a central concern of researches, academicians, urban planners, and urban authorities.
There is a tendency that various cities in the world, countries, and organizations have different practices of provisioning the open spaces in urban development and planning. High dense cities such as New York, Hongkong, Johannesburg, etc. use per capita; cities like London, Singapore, Sidney, Vancouver, Stockholm use distance from the residence to open space. Organizations like WHO use per capita whereas ECI (European Common Indicators), US EPA (US Environment Protection Agency) use distance to open spaces and Un-Habitat uses both per capita and distance to open spaces. Table 4 reveals the major provisions and practices in world towns and agencies to make open space functional in the cities.
The data reveals that Johannesburg seems the highest per capita open space then followed by New York among the developed countries. However, cities in developing countries like Mumbai and Kathmandu have the least open space availability. Mumbai has below 2 m2 per capita open spaces whereas KMC has 2.05m2 per capita (UN-Habitat, 2018; KMC, 2011). It implies that public open spaces are important for urban life as many developed countries are giving high attention to make the cities lived and functional with sufficient public open space provisions for healthy living.
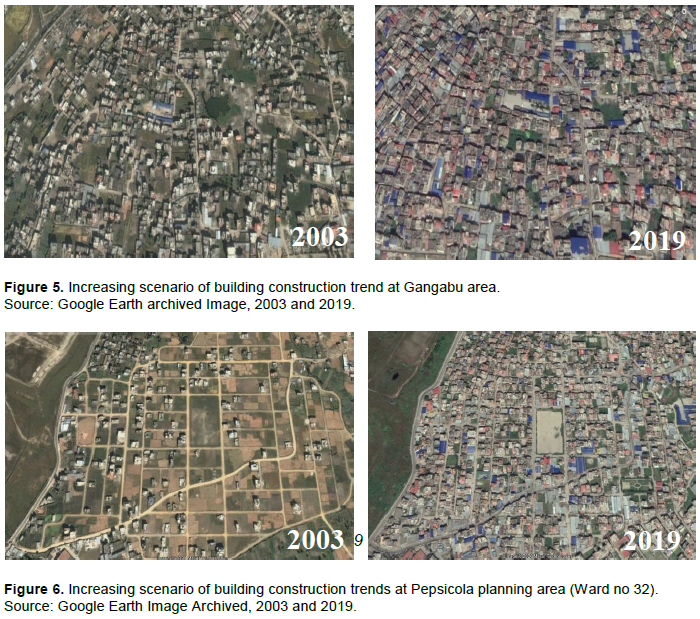
Altogether 887 open spaces were identified by the Kathmandu Valley Development Authority (KVDA) in the Kathmandu Valley among which, 488 are in Kathmandu, 346 are in Lalitpur, and 53 are in Bhaktapur Districts, and out of 488 open spaces of Kathmandu district, 266 are located in Kathmandu Metropolitan City (KVDA, 2015). These open spaces are of different sizes and types including institutional, government, private, educational institutions, religious, hospital, and others. Open spaces including private ownership are included in the identified open spaces. The types and status of open spaces in Kathmandu are presented in Table 5, which reveals that among the available 5.71 km2 of total open area, 76.5% is occupied by the Nepal government ownership including the government office coverage areas. About 51.6% of total open spaces are identified as useable in case of emergency need. The distribution of open spaces is presented in Figure 7. There is evidence in Kathmandu that public land has been converted into built-up infrastructures as many public areas have encroached. River corridors; both Bagmati and Bishnumati rivers, Tundikhel, Koteshwor area have encroached for different uses. River corridors are mostly encroached by the informal settlements whereas the decrease of Tundikhel was mainly because of expansion of road, uses changes (Dasharath Rangasala, Army headquarter in the past and conversion Khulla Manch into buss park recently) whereas the decrease of Koteshwor temple area is due to encroachment by a school and government office (Tiwari, 1989; Poudel, 2017) There are other many examples that cause decreasing the public open spaces in Kathmandu (Box 1). Thus, the open spaces are shrinking by encroachment, development of infrastructures, sub-division of land for uses changes. Unprecedented urbanization, the rapid expansion of settlements are the major causes for tempting to loss of public open space in KMC.
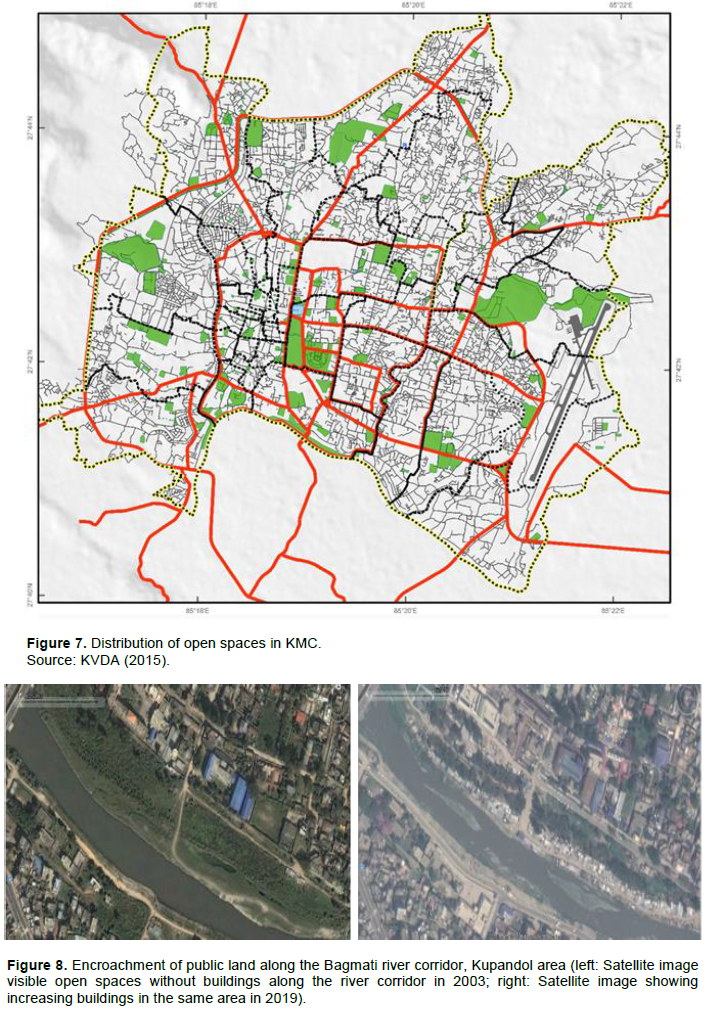
Data reveals that there are 2,333 squatter households with 11,473 population residing encroaching 183,495.96 m2 public land in KMC (DUDBC, 2010) including river corridors and other public lands. Some government-owned open spaces like river corridors are shrinking by the encroachment of informal settlements and squatters. The encroachment began in Kathmandu Valley in the name of landless squatters 26 years ago, but there was a spike in the numbers after the pro-republican movement of 2006 (Chitrakar, 2020) and there is an increasing trend of encroachment by the squatters. Figure 8 presents the encroachment of public land (open spaces) of Bagmati river corridor by the squatters and some inferences of decreasing open spaces in Kathmandu have also been presented in Box 1.

Hence, public spaces are the assets for cities to create sociality to give a feeling of togetherness among the community people through interaction, establish relations between space and people, recreation and well-being, people’s health improvement, public gathering and social networking, safer place for sheltering during and after disasters (MoUD, 2015; KVDA, 2015). However, decreasing such invaluable open spaces may result a number of problems in Kathmandu making cities chaotic, disaggregated, less sociability, and environmentally vulnerable (Joshef Rountree Foundation-JFR, 2019). Social life in KMC is squeezing sociability as there has a decreasing trend of social gatherings, interactions, and networking among people. Decreasing the public realm is one of the causes as people have losing public spaces to gather, talk, and enjoy sharing a common information-sharing platform. Therefore, such a crisis of public open spaces may degrade the sociability and community well-being in dense cities like Kathmandu.
The empirical research findings as excerpts on decreasing public open space in KMC have been cited in Box 1. It reveals that Tundikhel, one of the important public open spaces located in the heart of KMC is reduced by almost half as the spaces have been converted into institutional uses for Nepal Army and event management (Sharma, 2019; Chitrakar, 2020 and Chhetri, 2020). Similarly, a part of Tundikhel (Khulamanch) now has been converted into a bus park operation as another uses. Previously the old Buspark, located nearby Tundikhel is now has been going to convert into a modern multi-story building that is now under construction by Kathmandu Metropolitan City. It means KMC itself is converting the public open spaces into various uses. These open spaces would be useful to accommodate the whole population in the past but today all these open spaces have been converting into the built-up form or have been changed into other forms which indicate public open space diminishing in KMC. This will ruin public life activities in KMC by limiting people in daily public life activities.


