Full Length Research Paper

ABSTRACT
Land use/land cover change is a general term for the modification and conversion of the earth’s surface by human and natural factors. Land cover is the physical and biological cover of the surface. Land use covers the results of human activities for the exploitation of it. The objective of this study was to detect land cover/use changes in Andasa Watershed between the years 1995 to 2015. The study has used ArcGIS10.1 and ERDAS IMAGINE 2010, land sat images of 1995 and 2015 and socio-economic data to analyze land cover and landuse changes of Andasa watershed. The study has found that due to the population increase and improper agricultural activity forest and bush lands have declined whereas farm and bare lands expanded between the study years. Forest land and shrub land jointly decreased by 14349.23 hectare which is 23.87% of the total watershed area, whereas, cultivated land and bare land jointly increased by16010.32 hectare of land which is 26.63% of the total watershed area between the study periods, respectively. The rapid expansion of croplands and bare lands were entirely attributed to the alarming rate of depletion of forests, woods and shrubs. There is an urgent need to limit the population growth rate and implementing appropriate land use policy in the Andasa watershed.
Key words: Andasa watershed, land use land cover, landsat image.
INTRODUCTION
Land use/land cover change is a general term for the modification and conversion of the earth’s surface by human factors and natural events such as, flooding, fire, and climate fluctuations (Prakasam, 2010). Interpreting and conceptualizing the land cover/use changes contribute to complex dynamics of land cover, and is important for policy and planning actions (Knorr et al., 2011).
Land use changes are caused by both natural and socio- economic factors (Campbell et al., 2005). Land use is terms of human activities such as agriculture, forestry, building construction. Land use and land cover is dynamic in nature and it provides a comprehensive understanding of the interaction and relationship of anthropogenic activities with the environment (Lewoye, 2014). Changes in land use/land cover are the direct and indirect consequences of human actions to ensure essential resources (Lambin et al., 2006).
To understand how land use land cover (LULC) affects and interacts with global earth systems, information needed on what changes occur, where and when they occur, the rates at which they occur, and the social and physical factors that drive the changes (Krauer, 1988). The global or local change in LULC can be monitored using Geographical Information System (GIS) and remote sensed data in combination with ground survey. The technique has been used extensively in the tropics for generating valuable information on the forest cover, vegetation type and land use changes. Remote sensing techniques are important for studies aimed at understanding land use/land cover dynamics, its driving forces and impacts on the society (Lewoye, 2014).
The relationship between land cover and use change, and its causative factors is complex and dynamic. The land cover and use change is mainly manipulated by both natural and socio-economic factors. Some studies suggested that demographic dynamics contribute more than any other process to land cover changes (Mather et al., 2000) while others suggested the superiority of economic factors (Geist and Lambdin, 2001). Other socio-economic factors of land cover change include poverty, tenure security, and availability of market and credit facilities.
Accurate information on land-cover changes and the forces and processes behind is essential for designing a sound environmental policies and management. The land-cover analysis provides the baseline data required for proper understanding of how land was used in the past and the types of changes to be expected in the future. This research was therefore, aimed at analyzing the link between land cover changes and its causative factors in Andasa watershed (AW). Identifying the driving forces behind land use changes, and developing appropriate measures to minimize their ecological effects have great deal of importance for land use planning. Specifically, this study determines land cover and use status with special reference to its causes and evaluation of their consequences through time in AW.
METHODOLOGY
Study area
The study was conducted at Andasa watershed which is found North Western Ethiopia. The watershed encompasses three districts that are found in West Gojam Administrative Zone of Amhara National Regional State and near to the region’s capital city, Bahir Dar. It is spatially located between latitude 11°23'20"N to 11°31'6"N and longitude 37°13'16"E to 37°29'48"E. Andasa watershed is a collection of small seasonal streams and few perennial streams originated from hills of Adama Mountain. It is one of the tributaries of Blue Nile River and covers about an area of 601.1 square kilometers. The elevation ranges from 1715 to 3217 m. The mean annual rainfall and temperature for the whole watershed was 1408.75mm and 22.20C, respectively. According to CSA (2008) there are about 268,736 people in Watershed, and about 90% of the population live in rural areas and primarily depend on agriculture (Figure 1).

Sources of data, method of collection and data analysis
The most important thing in doing a GIS research is source of data. This research used both primary and secondary data’s which are collected from different sources. Secondary data such as meteorological data, and others were collected from different governmental and non-governmental organizations. Land sat satellite image were downloaded from USGS (United States Geological Survey) freely. Frequent field observations using GPS (Global Positioning System) were carried out to generate primary information regarding the ground truth points for image classification and accuracy assessment.
To collect these data, the researcher used different techniques of data collections. Primary data were collected using expertise discussions and filed survey or ground truth observations and verification using GPS instruments. This gives real information about what condition that exists on the study area. In obtaining primary data (land reference data), purposive sampling data were conducted, because of rough topography and obtaining data from different land use types of the watershed.
The samplings were taken by considering the geo-morphological units of the study area that were mapped before field work. Secondary data includes satellite image, topographic map, and others which are desirable to the study purpose were collected from various governmental and non-governmental organizations which were stated above. Land sat images were acquired freely from earth explorere.usgs.gov. They were retrieved from path and row (170, 52) respectively, in addition all of the pictures considered to be in dry season, because in these season cloud cover effect were assumed to be minimum and there is a probability of obtaining true color of objects which is helpful in image classification. Additionally secondary data, published and unpublished materials such as research reports, census reports, and journal obtained from several sources were used.
During the field work, training samples for supervised land use/land cover classification were collected using purposive sampling techniques using (GPS) Global Positioning System instrument for training sample from the existing LULC types for the year 2015 and using information from the local people about the previous land use land cover types and taking GPS points on each land use types for the year 1995. Accordingly, a total of 200 training sample points were collected, of which 100 for the year 1995 and 100 for the year 2015.From this 35 points for cultivated land, 20 points for forest, 20 points forwood and shrub land, 15 points for grazing land and 10 points for bare lands were collected using hand held GPS.
In addition to the spatial data, the researcher selected sample household respondents from the watershed community by using simple random sampling technique. From the total 908 watershed households, 109 sample households were selected randomly who are living in the watershed.
After collection of all the necessary data’s, data analysis and processing were made by digitizing, calculating and classifying the necessary information of each thematic layers using ERDAS IMGINE 2010 and ArcGIS 10.1 software. Finally all parameter influences were weighted using the necessary steps. Furthermore, some simple statistical methods, such as percentage, average and graphic tabulation were also employed for the analysis and interpretations of the results of the analysis. . The procedure followed during the selected layer analysis is discussed as follows:
Micro watershed delineation
The watershed under study was delineated by automatic delineation option using Arc Hydro tools Extension with in ArcGIS 10.1 for the delineation of the watershed, from 30m*30m resolution DEM, Fill, Flow direction and flow accumulation were generated respectively. As shown in Figure 2, about 28 micro-wub-watersheds were delineated by increasing the threshold value in the stream definition. Thus, the boundary and total area of the watershed was determined for further analysis.
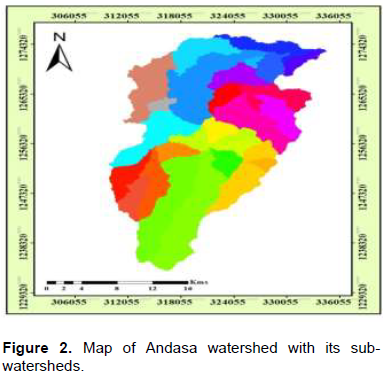
Image rectification and restoration (pre-processing)
In their raw form, as received from imaging sensors mounted on satellite platforms, remotely sensed data generally contain flaws or deficiencies (Lillesand and Kiefer, 2000). Some of the distortions are radiometric distortions, geometric distortion and noise or atmospheric effect. Such errors can be corrected by using pre-processing techniques like radiometric correction, geometric correction and noise removal or atmospheric corrections, which should be applied in raw imageries.
In this study, the image was perfectly corrected by applying the necessary pre-processing techniques. And also all images were geo-referenced into appropriate datum and projections of Ethiopia because datum conflict utmost may distort the data or limit the use of overlay techniques. The next work was classifying the images with supervised image classifications technique after the collection of training sample in field survey. In supervised image classifications, after assigning (creating) the signature editor, a maximum likelihood parameter was used. Finally, the different land use/land cover classes were classified (grouped) and maps were analyzed using ERDAS IMAGINE 2010 and ArcGIS 10.1 software. During image classification both images of the year n1995 and 2015 were classified individually based on major land use land cover types such as cultivated land, forest land, wood &shrub land, grazing land and degraded land.
After classification of images of the year 1995 and 2015 using supervised image classification techniques using ERDAS IMAGINE 2010 software, the changes in LULC was detected. Hence, the results of image classification and changes in LULC between the 1995 and2015 were expressed using tabulation and percentages and finally the results were interpreted accordingly. The reason for the selection of the year 1995 as a starting is, because of that, the Amhara national regional government implemented major land redistribution in the region since, 1995 to 1998 due to the increasing pressure of landless people to the regional government (Samuel and John, 2001). Due to this reason more communal lands has been changed to private ownership.
In this study, forest land category includes natural forests, roadside plantation, woodlots, and orthodox Church forests, cultivated land includes croplands, harvested croplands, orchards and irrigation farm lands, grazing land includes all areas which have continuous coverage of grassland, wood and shrub land includes areas which have open coverage of trees with grasses, bushes and shrubs, whereas bare land includes bare exposed rocky areas which are degraded seriously have no any biophysical coverage, which is adopted from James et al. (1983).
In this study, the confusion matrix method was applied to estimate the accuracy of supervised land use/land cover image classification of the study area for the year 2015 using ERDAS IMAGINE 2010 software.
RESULTS AND DISCUSSION
Analysis of land use/Land cover change
Land use /Land cover class of the year 1995
The major land use/land cover classes of the watershed which was identified by supervised image classification during the year 1995 were forestland, cultivated land, wood and shrub land, grazing land, and bare land as indicated in Table 4.
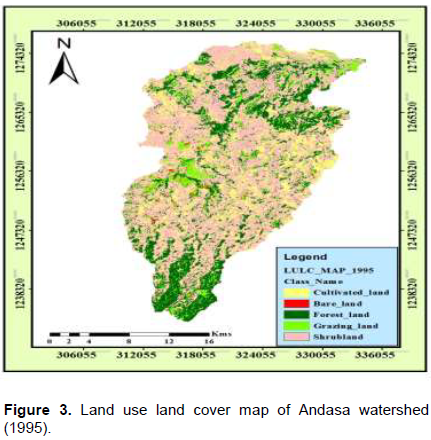
Based on the classification result, as indicated earlier, the share of forest land from all classified land use/land cover types was12406.7ha which contributes to 20.64% from the total watershed area, wood and shrub land was also possessed an area coverage of 25758.43 ha which contributed to 42.85% share, whereas, cultivated land, grazing land and bare land covered an area of 14034.23ha,7528.04ha, and 372.7ha with the percentage of 23.35, 12.5, and 0.62%, respectively. During this year, most middle to lowest and the upper parts of Andasa watershed were covered by forest land. This implies that, during the year 1995 most part of the watershed was covered by forest and wood and bush land use types, especially most central, upper and lower parts of the watershed (Figure 3).
Land use /Landover class of the year 2015
The major land use/land cover classes of the year 2015 was also classified into cultivated land, grazing land, wood and shrub land, forest and bare land. As indicated in the Figure 4, the greatest share of land use/land cover from all classified types was cultivated land, which covers an area of 26963.3ha with coverage of (44.86%) the total watershed area. Whereas, wood and shrub land, forest land, grazing land and degraded lands covered an area of land 15113.3ha, 8702.3ha, 5908ha and 3413.1ha with the percentage of 25.14, 14.48, 9.8s and 5.6%, respectively. Cultivated land was expanded to most middle and to the northern parts of the watershed as a result of human activity. This result implies that, during the year 2015 most of the watershed was covered with cultivated lands and bare lands which are highly susceptible for erosion. Also much of the forest land and wood and bush lands have been converted to cultivated lands as a result of demand for farm land.

Land use/Land cover changes between 1995 to 2015
Finally, the land use/land cover maps of two different years (1995 and 2015) were developed to examine the change in land use/land cover and to assess its impact on the extent of erosion rate under the assumption that, other variables remains with constant values (Figures 3 and 4). So that, the comparisons of land use/land cover changes of the year (1995 to 2015) has been detailed in Table 1.

As clearly depicted on Table 1, the land use/ land cover analysis result showed that the total share of forest and wood &shrub lands jointly (which have low susceptibility for rain drop impact) during the year 1995 was 38,165.13 ha which is 63.49% of the total watershed area. Whereas, cultivated land and bare lands (which are high susceptibility for rain drop impact) jointly covered an area of land 14,361.93ha which is 13.12% of the total watershed.
On the contemporary, the land use/ land cover analysis result of the year 2015 showed that, both forest and wood & shrub lands jointly covered only an area of land 23,815.6 ha which is only 39.6% from the total watershed. While, cultivated land and bare land jointly increased to 30,376.4 ha which is 50.66% from the total watershed area? From this we can interpret that, from the year 1995 to 2015 forest land and wood and shrub land jointly decreased by 14.349.23 hectare which is 23.87% of the total watershed area, and cultivated land and bare land jointly increased to 16,010.32ha of land which is 26.63% of the total watershed area. Hence, we can conclude that, there was 12,894.92 ha and 3115.4 ha of land with mean annual increment of 644.74 ha and 155.77 ha crop and bare lands respectively associated with 3704.15 ha, 10645.13 ha and 1659.74 ha of land with mean annual loss of 185.2 ha, 532.25 ha and 82.98ha forest, shrub and grazing lands respectively.
Likewise, the study of Mengistu and Waktola (2014) showed that, that only 7.5% of the 1972 riverine trees were detected in 2004. About 92.5% of the riverine trees were converted into another LULC types. In contrast, the conversion of other LULC types into riverine trees was only 8.7%. Furthermore, not more than 10% of land under shrub-grassland in 1972 was detected on the 2004 map. The remaining 90% of the study area was converted into various LULC types. The area that was converted from other LULC types into shrub-grassland accounted only for 29%.
Additionally, another study which was conducted in the Semenen mountain highlands reveled that, grassland is the most important land cover class, and it ranges between 33 and 67% of the total vegetation cover. This is, however, decreasing around Sankaber (−4%) and Imet Gogo (-9%), where grassland is removed in favor of woody vegetation. Beside grassland, rocky outcrop is also decreasing in most sites. On the other hand, cropland increased in the Kona-Sona lowlands (+1%) and also in the highlands in Gich (+2%) and around Bwahit (+2%) area. Also Decadal changes) indicated an increase in the dense forest in all areas except in Gich. There, the dense forest decreased with a rate of −1.4% of the total area per decade and also the area covered by grasslands is decreasing, while cropland is the most important growing class (+1% per decade) (Jacob et al., 2017 ).
From the results of LULC change we can interpret that, as LULC increase towards cultivated land the amount of soil loss increases, because forests have canopy coverage that enables them to resist the erosive power of rainfall and reduce the occurrence of runoff by providing time the rainfall drop to infiltrate downward to the earth.
Accuracy assessment
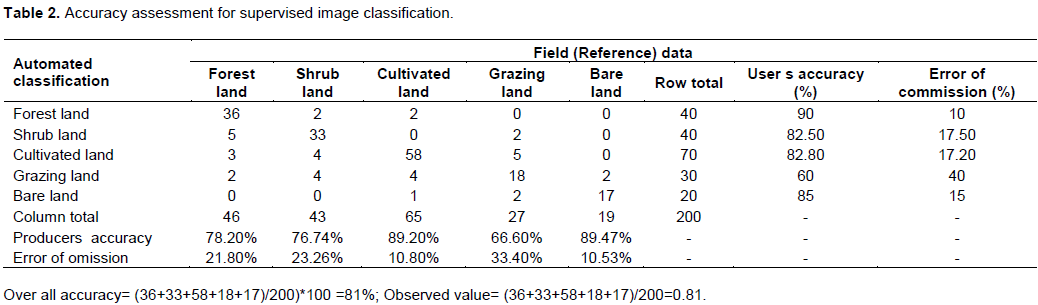
As discussed earlier, the accuracy of the supervised image classification was checked by using error matrix. The confusion matrix is a table with the columns representing the reference (observed) classes and the row classified (mapped) classes (Rossiter, 2001). Generally, 200 training sample points were taken purposively, of which 70, 40, 40, 30, and 20 for cultivated land, forest land, shrub land, grazing land and bare lands respectively (Table-2) as indicated in the appendix1, 2, 3, 4 and 5 respectively. The table above shows that, in the case of forest land from the field collected 40 GPS sample points 36 were within the correct class, for shrub land from the collected 40 GPS sample points 33 were within the correct class, for cultivated land from the collected 70 GPS points 58 sample points were within the correct class, for grazing land from the collected 30 GPS points 18 were within the correct class, and for the bare land from the collected 20 GPS points 17 were within the correct class. The overall accuracy result was 81%, which means 81% of LULC types were classified accurately, and only 19% of the LULC types were classified inaccurately. Accordingly, the overall classification accuracy was obtained to be 81%, almost all land use/land cover types were mapped with a very good accuracy (Congalton, 2001).
Causes for LULC change in the study watershed
According to the study of Amare (2013) which was conducted in Infranze watershed (which is nearest to Andasa watershed) found that, many people in the watershed have to get living income from other sources such as selling fire wood, cow dung and others that are obtained from exploitation of environmental resources.
These activities in turn degrade the land and expand the land cover and use change in the Watershed.
In addition, farmers started to cultivate chat by clearing bush and wetlands. The plant requires more water to grow so that farmers plant it near the springs and add chemical to protect it from insects. This process is linked to improper agricultural practices, population pressure and poverty in a complex web of cause and effect.
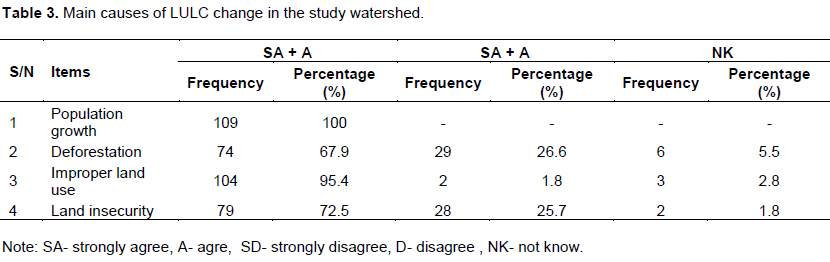
Intensive interview and focus group discussion was held with community in the study watershed to find other causes of land cover change other than population in-crease. As indicated in Table 3, the researcher founded from the interviewed respondents that, all of the respondents agree that the main causes for LULC change 109 (100%) and 104(95.4%) of the respondents in the watershed believed that population pressure and improper land use are the main causes for LULC change. Whereas, about 74(67.9%) of the respondents agree that deforestation initiate is the key for the conversion of land use types and 79(72.5%) of the respondent farmers agree that land insecurity makes the farmers to change from one type of use to the other. All these causes of are categorized in to anthropogenic causes because all of them were created by day today activities of the community who are living in the study watershed.

These results are in agreement with the study Sonnevel (2003), the drastic expansion of croplands and bare lands were entirely attributed to the alarming rate of depletion of forests, wood &shrubs and grazing lands. The main causes for this depletion of forests, wood &shrubs and grazing lands is mainly associated with the ever increasing of population growth and lack of appropriate land use policies in relation to the population growth of in the watershed, insecure land property rights, miss-land management practice, the need of forests for fuel wood, construction and fence. As Gete (2000) mentioned, unwise redistribution of land without due consideration of the whole environment and unsystematic economic strategy that is cultivating mainly based on maximum exploitation of available productive potentials of the soil without appropriate protection and conservation measures are also the major driving forces for the expansion of bare and croplands.
Additionally, land registration faces challenges because of the complexity of inheritance practices, the increasing number of landless youths in the village resulting from shortage of land and lack of other means of livelihoods such as job opportunities in small industries in nearby areas and farmers' suspicion about how the registration may affect their rights. For example, participants reported that some wereda and kebele administrators were saying ‘After all, land belongs to the state’, which did not instil confidence in them that the land was actually under their control. Some farmers also refused to have their landholding registered in the first phase of land registration. The second-level certification process, however, has improved farmers' sense of security as they came to better understand the goals of land registration and learned from the first phase of land registration that the government does not take the unregistered land (Yami and Snyder, 2016 ).
Consequences of change in LULC
Land use change has been acknowledged as one of the prominent trigger of world’s environmental shift. It is emerging as one of the most urgent issues especially related to soil erosion. The vegetation cover is able to neutralize the effect of precipitation on soil erosion. The change in land cover has caused the acceleration of the erosion, such as the clearance of dense forest into agricultural land has increased soil erosion 3000 times (Morgan, 2005).
From data collected through interviews, the researcher founded that, 102 (93.5%) of the respondents responded that about 78(71.5%) of the respondents confirmed that when a given land converted from forest and bush land to cultivated and grazing lands increases the rate of soil erosion, whereas about 24(22%) of the respondents agreed that the micro climate of the area was changed as a result of destruction of forests and only 7(6.5%) of the respondents reported that when forest cover decreases productivity of land decreases.
This results are in line with the findings of Ellis (2011), land-use and land cover change are associated with large negative impacts onecosystems observed at local, regional and global scales. High rates of water, soil and airpollution are the consequences of observed LULCC. Biodiversity is reduced when land ischanged from a relatively undisturbed state to more intensive uses like farming, livestockgrazing, selective tree harvesting, etc.
Additionally, another study on the impacts of LULC change, revealed that the lower percentage of sand fraction in croplands and degraded lands than in the reference sites. Clay fractions were higher in degraded lands and croplands. Clay content, as opposed to silt and sand, varied significantly among LULC types. The LSD test showed significantly different clay content between soils of degraded lands and reference soils and finally resulted in change in soil texture (Mengistu and Waktola, 2014).
CONCLUSION AND RECOMMENDATION
As clearly showed and illustrated in the result and discussion part, this study concluded that there was land cover change in the watershed because of demand for agriculture and settlement land for increasing population, problems related to land policy and lack of land security.
Hence, creating and improving the awareness of local communities to adopt appropriate land use systems like multi-purpose agro-forestry systems, afforestation programs, woodlots etc, in order to increase the positive impact of trees for reducing erosion rather than expanding cultivating land by removal of trees and shrubs for fuel, fence and construction.
There should be also land use planning by identifying the proper land for specific purpose so that the marginal lands will not be put into use. Because sustainable land management pursues several goals simultaneously through multi-functional land use. It creates synergies that generate added economic and ecological value. Integration of crop production and livestock production is the core of multi-functional land use. This makes it possible to optimize on-farm and local nutrient and biomass cycles. Fallow land and harvest residue can be used as fodder, and animal dung can be applied as high-quality fertilizer.
Additionally, Agroforestry provides the landowner the opportunity to develop a portfolio of short- and long-term investments which, with the proper combination of trees/shrubs and crops/livestock, provides both economic and environmental benefits. Properly designed agroforestry systems patterned after natural ecosystems many benefits. Such systems require active manipulation of vegetation diverse Landscape diversification of crop-fields, through the establishment of windbreaks, shelterbelts, woody hedges, alley cropping systems, and others leads to: increased productivity during succession changes; decreased weed competition; increased self-maintenance and internal regulation; enhanced biological regulation of major insect problems; increased efficiency in use of solar, radiation; increased soil organic matter; increased biodiversity in agricultural landscapes; decreased wind and water erosion; increased uptake and fixation of atmospheric carbon dioxide; increased nutrient retention via greater exploitation of soil profiles; and improved economic efficiency.
Generally, integrated systems of plant and animal production practices having a site-specific application that will, over the long-term satisfy human food and fiber needs, enhance environmental quality and the national resource base upon which the agricultural economy depends, make efficient use of non-renewable resources and on-farm resources, integrate natural biological cycles and controls, sustain the economic viability of farm operations and enhance the quality of life for farmers and society as a whole. And also population increase has played a major role on land cover changes and there should be strategies that are proposed to strengthen family planning programs.
CONFLICT OF INTERESTS
The authors have not declared any conflict of interests.
REFERENCES
|
Amare S (2013). Retrospective Analysis of Land Cover and Use Dynamics in Gilgel Abbay Watershed by Using GIS and Remote Sensing Techniques, Northwestern Ethiopia, Int. J. Geosci. 4(7):1003-1008. |
|
|
Congalton RG (2001).Accuracy assessment and validation of remotely sensed and oher spatial information. Int. J. Wildland Fire 10:321-328. |
|
|
CSA (2008). Summary and Statistical Report of the 2007 Population and Housing Census Population Site by Age and Six. Federal Democratic Republic of Ethiopia Population Census Commission. Addis Ababa, Ethiopia. |
|
|
Campbell DJ, Lusch DP, Smucker TA (2005), "Multiple Methods in the Study of Driving Forces of Land Use and Land Cover Change: A Case Study of SE Kajiado District Kenya," Hum. Ecol. 33(6):763-794. |
|
|
Ellis F (2011). Rural Livelihoods and diversity in Developing countries. Oxford: Oxford University Press |
|
|
Gete Z (2000). Landscape Dynamics and Soil Erosion Process Modeling in the Northwestern Ethiopian Highlands.African Studies Series A16. University of Berne Switzerland. Geographic Bernensia. |
|
|
Geist HJ, Lambdin EF (2001), "What Drives Tropical Deforestation? A Meta-Analysis of Proximate and Un- derlying Causes of Deforestation Based on Sub National Case Study Evidence," LUCC International Project Of- fice, Louvain-la-Neuve, 2001. |
|
|
Jacob MA, Frankl AE, Hurni HB, Lanckriet SA, De Ridder MC, Guyassa EAD, Beeckman HC, Nyssen JA (2017). Land cover dynamics in the Simien Mountains (Ethiopia), half a century after establishment of the National Park. Regional Environ. Change 17(3):777-787. |
|
|
James R Anderson, Ernest EH, John TR, Richard EW (1983). A Land Use and Land Cover Classification System for Use with Remote Sensor Data.Geological Survey Professional Paper 964. |
|
|
Krauer J (1988). Erosivity &Iso-erodent Map of Ethiopia. University of Burme, Swetherland |
|
|
Lambin EF, Geist H, Rindfus R (2006). Introduction: Local process with global impact. In: E.F.Lambin & H.Geist (Eds.), Land use Land cover change (pp.1-8). Berlin, Germany; Springer Berlin Heidelberg. |
|
|
Lewoye T (2014). Analysis of Land Use and Land Cover Change and Its Drivers UsingGIS and Remote Sensing: The Case of West Guna Mountain, Ethiopia, Int. J. Remote Sensing GIS 3(3):53-63 |
|
|
Lillesand TM, Kiefer RW (2000). Remote Sensing and Image Interpretation. New York: John Wiley and Sons, Inc. |
|
|
Mengistu DAA, Waktola DKB (2014). Monitoring land use/land cover change impacts on soils in data scarce environments: a case of south-central Ethiopia. J. Land Use Sci. 11(1):96-112. |
|
|
Morgan RPC (2005). Soil erosion and conservation: Third edition. Victoria: Blackwell publishing. |
|
|
Prakasam C (2010). Land use and land cover change detection through remote sensing approach: A case study of Kodaikanaltaluk, Tamil nadu, Int. J. Geomatics Geosci. 1(2):150-158. |
|
|
Rossiter D (2001). Assessing the thematic accuracy of area-class soil maps.Enschede. |
|
|
Samuel B, John P (2001).Impacts of land redistribution on land management and productivity on Ethiopian highlands. Paper presented at the contributed paper session annual AAEA meeting, Chicago IL. |
|
|
Mather S, Needle CL (2000). "The Relationships of Population and Forest Trends, Geogr. J. 166(1):2-13. |
|
|
Knorr W, Pytharoulis I, Petropoulos GP, Go- bron N (2011). "Combined Use of Weather Forecasting and Satel- lite Remote Sensing Information for Fire Risk, Fire and Fire Impact Monitoring. Comput. Ecol. Software 1(2):112-120. |
|
|
Yami MAB, Snyder KAC (2016). After All, Land Belongs to the State: Examining the Benefits of Land Registration for Smallholders in Ethiopia. Land Degrad. Dev. 27(3):465-478. |
|
Copyright © 2024 Author(s) retain the copyright of this article.
This article is published under the terms of the Creative Commons Attribution License 4.0


