This study has investigated the implications of land use planning on the provision and management of public sanitation facilities in the Wa Municipality, using three zones (Zone 1-Jangbeyiri and Suriyiri; Zone 2-Kpaguri; Zone 3-Mangu) of different land use and socioeconomic characteristics. A mixed method approach was utilized. Field surveys including 374 respondents, key informant interviews, and spatial planning methods were employed to gather the primary data. The results revealed that local plans and building regulations were not available at the time the indigenous settlements (Zone 1) were developed, resulting in haphazard development in the area. The high-income residential area (Zone 2) had household toilet facilities and access to door-to-door waste collection services due to the adherence to building regulations and good access routes. Zones 1 and 3 had sanitary spaces with public sanitary facilities (communal containers and public toilets) provided by either the Wa Municipal Assembly or Zoomlion Ghana Ltd. However, the sanitary facilities in the two areas were found to be inadequate and not well spaced. Access to public sanitation facilities is very difficult for service providers as well as the beneficiaries of the services. The Wa Municipal Assembly should inform the public through radio programs and community fora on the need and procedures of obtaining building permits before developing their lands. The Municipality should also create and adopt urban renewal strategies to provide sanitary services for unplanned areas like Jangbeyiri and Suuriyiri.
Urbanisation and its associated challenges have become one of the major topics of global discourse. Land use planning, especially in the urban space, is imperative when it comes to solving the problems associated with rapid urbanisation in many cities in the world. Globally, there is a strong connection between urban land use planning (ULUP) and urban sanitation management as the two form crucial components of the 2015 Sustainable Development Goals (SDGs). While SDG 11 aims to “enhance inclusive and sustainable urbanisation and the capacity for participatory, integrated and sustainable human settlement planning and management in all countries,” SDG 6 seeks to “ensure availability and sustainable management of water and sanitation for all.” These two SDGs, therefore, underpin the link between land use planning and sanitation (UNCG-CSOP, 2017). According to the World Health Organization (WHO), sanitation deals with the provision of facilities and services for the safe management (treatment, reuse or safe disposal) of human excreta and sullage. However, in a broader context, sanitation encompasses both solid waste and animal waste (WHO, 2017). Public sanitation facilities are provided by either the Local Council or a non-governmental organisation (NGO) for the benefit of whoever wishes to use it (Heijnen et al., 2014). Land use planning is a systematic and repetitive process carried out to create favourable conditions for sustainable development of land resources which address the needs and demands of people (FAO-UNEP, 1999). While this definition emphasises systematic assessments, another definition by Gesellschaft für Technische Zusammenarbeit (GTZ) rather focuses on participation among all stakeholders in building a consensus on sustainable land use (GTZ, 2012). A combination of the two definitions thus, integrates the collaboration among all stakeholders in using procedures to ensure sustainable land use.
Theories of land use planning
ULUP dwells on three classical models namely, the Concentric Zone Model (CZM), the Sector Model and the Multiple Nuclei Model (MNM). The CZM, proposed by Burgess, describes the process of land development and urban growth by a series of concentric circles which expand drastically from the core Central Business District (CBD). The CBD has most of the economic activities because it is the focus of intra-city transport (Nakatudde, 2010; Yendaw, 2014). The Sector Model (Hoyt, 1939) argues that housing areas in a city develop in parts along the lines of communication, from the CBD outwards. High-quality areas run along roads and reflect the incidence of higher ground. Industrial sectors develop along canals and railways, away from high-quality housing. The MNM, proposed by Harris and Ullman (1945), views a city as growing and assumes that urban growth takes place around several distinct locations. These locations could include a market, a nearby village, a factory, a mine, or a railway terminal. Ultimately, all the locations would be combined into one urban area largely agglomerated by residential use and intra-city transportation. At the centre of the model is the CBD with light manufacturing and wholesaling located along transport routes (Nakatudde, 2010). These models have been criticised for being more applicable to cities in the United States of America than other nations’ cities. They have also been viewed as static: they only described patterns of urban land use in a generic city but do not describe the processes by which land use changes. Despite the criticisms, these models are still considered relevant to land use planners and have been applied in recent studies (Yendaw, 2014; Asamoah, 2010; Amponsah, 2011). The study reviewed these models to ascertain how land use planning can incorporate provisions for public sanitation facilities in the Wa Municipality.
Land use planning and sanitation in Ghana and the Wa Municipality
Land use planning is a useful tool in the development of infrastructure as well as the provision and distribution of public facilities (UN-Habitat, 2012). Land use planning affects the distance of public facilities (including educational, health, sanitation and emergency facilities) from most houses in a community (Yendaw, 2014). It equally influences a better road network with the presence of designated areas for loading and offloading. This encourages the operation of public vehicles in the community thereby making houses, facilities, and other land use easily accessible in the planned area (TCPD, 2011). Land use planning impacts physical development and, thus, generally ensures a cleaner and safe environment and aims at improving the lives, living environment and health status of the residence of a given urban area (Boamah et al., 2012). Land use planning can ensure the efficient use of urban land by providing control over the spatial structure of residential development; reducing the cost of providing some local public goods and providing valued neighbourhood quality (Owei et al., 2010; Cheshire and Sheppard, 2002). Land use planning has evolved over the years to adjust to the dynamic Ghanaian society. This evolution reflects the changes in the implementation of instruments and methods (Matey, 2016; Sliuzas, 2004).
During the early 1960s, the master plan approach formed the basis of land use planning in the country. However, little emphasis was placed on the local economy and social development to generate wealth, expertise, and the needed resources for a better environment. Other shortcomings of the master plan strategy included the long preparation time, the need for a strong administration system to oversee it, and the lack of coordination among development agents at different levels of government and the private sector. These challenges led to the adaptation of the Three-Tier planning system (Matey, 2016). The three-tier framework consists of three plans: the Spatial Development Framework (SDF), the Structure Plan, and the Local Plan. According to the TCPD (2011), the SDF is the spatial strategy that defines social, economic, and environmental policies. It addresses the spatial development implications of issues like housing,
infrastructure services, transportation, and the environment. The SDF shows the expected development over the twenty-year period, including the location of key components of the strategy aimed at achieving the desired development. The SDF must also be in coherence with the National Development and Medium Term Development Plans (MTDP) and other relevant national and regional-level policies, plans and programs. A structure plan serves as a guide to the future development of a district, town or city, or the development or redevelopment of a part of these areas. It defines all land uses, including residential, commercial, industrial and mixed-use areas, and major open space. It further provides a framework within which all local plans for the city or town complies. Some of the basic land uses identified in the structure plan are open space, residential, and areas of public facilities.
A local plan lays out the use of land by function, purpose and sustainable use of land. Local plans indicate that the use of land must conform with the permitted use of the land in the designated zoning classification. The local plan provides maps that show the precise land uses for each plot in the area covered by the plan and the type of buildings that can be built on each of the designated plots. It also shows the dimensions of any parcel and the permitted maximum ratio of built area to plot area and details of designs for each type of road or footpath, including pedestrian footpaths, cycleways, drainage and reserve for infrastructure lines (TCPD, 2011). Currently, the laws enforcing land use plans of a city in Ghana include the Local Government Act (Act 462), 1993, the National Building Code (LI 1630), 1996, and Land Use and Spatial Planning Act (Act, 925), 2016. Act 462 makes building permits a mandatory requirement for physical development in Ghana. The LI 1630 spells out the building permit application requirements, building densities, permissible land uses, site and spatial standards, the responsibility of the District Planning Authority (DPA) and the validity period of building permits. Improving access to public sanitation facilities in urban areas in developing countries is very significant, but a problematic issue for urban planners (Abubakar, 2017). However, in the Wa Municipality the standard and practice of effecting healthy and hygienic conditions in the environment to promote public health are not effective, contributing to the prevailing insanitary condition in the municipality (Zormal, 2016).
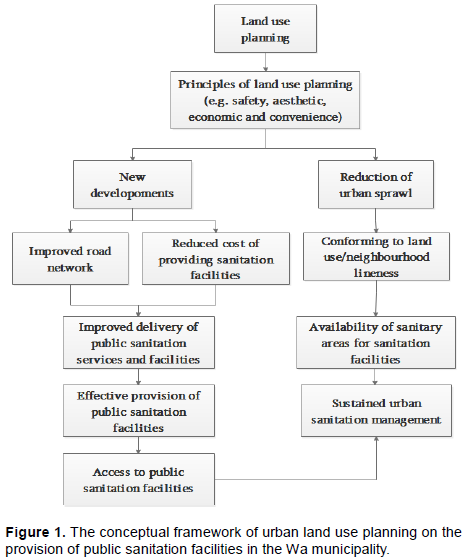
The Wa Municipality lacks specific disposal points for waste; and this has resulted in indiscriminate dumping of waste in street corners, in between houses, in gutters, drains, and waterways. Which in turn poses a serious challenge of municipal waste management in the municipality (Dongballe, 2016)? Figure 1 conceptualises the effects of land use planning on the provision of public sanitation facilities in the Wa Municipality. The framework indicates that effective land use planning focuses on principles such as safety, aesthetics, convenience, and economy. Effective land use planning ensures redevelopment in old residential areas and new residential development. These developments are characterised by improved road network or transportation and reduced cost of providing public sanitation facilities. The intent is to improve the public sanitation service or facilities delivery and adequate provision of public sanitation facilities. Consequently, it leads to access to public sanitation facilities and sustained urban sanitation management. Again, the framework shows that effective land use planning reduces urban sprawl and creates room for conforming land uses or neighbourhood lines resulting in planned residential areas. Planned residential areas achieve sustained urban sanitation management as they are characterised by the availability of sanitary areas, reduced cost of providing public sanitation facilities, and access to public sanitation facilities.
Studies on land use planning and sanitation in the Wa Municipality are lacking, as earlier ones have focused on land use and housing (Boamah, 2013), and land use and crop production (Kuusaana and Eledi, 2015). This study, therefore, sought to point out the effects of land use planning on the provision of designated sanitary areas and accessibility to public sanitation facilities, in order to provide relevant information to the relevant stakeholders of sanitation management in the area. To achieve this aim, the paper (1) examined the conformity of physical developments to land use plans, (2) assessed the effects of land use planning on the provision of spaces for sanitary areas and facilities, and (3) investigated the effects of land use planning on the accessibility of public sanitation facilities in the municipality. This study adopted the Sector Model because it describes the urban structure in the form of sectors or zones with regards to urban land development.
This study conceptualised the Sector Model by classifying ULUP of the Wa Municipality into three main zones, according to (Osumanu et al., 2016). Zone 1 is made up of indigenous areas, surrounding the CBD, classified as a low-class residential area that has been developed without local plans (unplanned suburbs). Zone 2 consists of newly developed areas, located far from the CBD, classified as a high-class residential area that is developed with local plans (planned suburbs). Zone 3 is a mixed settlement classified as a middle-class residential area. The purpose of this study is, therefore, to find out whether urban land use plans have created a provision for the establishment of public sanitation facilities in these zones for the proper management of sanitation in the Wa Municipality.
This study has been carried out in Ghana and the Wa Municipality of Ghana in 2018.
Study area
The Wa Municipality, located at latitude 10° 03' 60.00'' N and longitude -2° 29' 59.99'' W, is one of the eleven districts in the Upper West Region of Ghana, bordered by the Nadowli-Kaleo, Wa East and Wa West districts (Figure 2). It has a land area of about 579.86 km2. The Wa Municipality lays in the Savannah high plains, with an average elevation between 160 and 300 m above sea level. The annual rainfall of the area is between 840 and 1400 mm, and is characteristically erratic and punctuated by spells of prolonged droughts and heavy downpours sometimes causing floods is experienced (GSS, 2014). The population of the Wa Municipality is 120,884. The majority (58.3%) of the dwelling units in the municipality is compound houses; separate houses and semi-detached houses constitute 23.0 and 10.2%, respectively. More than half (55.4%) of the dwelling units in the municipality are owned by members of the household; 26.6% are owned by private individuals; 10.7% is owned by a relative who is not a member of the household, and only 3.6% are publicly, or government-owned (GSS, 2014). Wirth regards to sanitation, 37% of the households in the Wa Municipality use public toilets, whereas 41.8% of households practice open defecation (OD). 44.6% of households in the municipality dispose of solid waste in the communal containers, 4.3% patronise the door-to-door collection of solid waste, while 17.6% dispose of solid waste indiscriminately (GSS, 2014).
This study focused on three zones based on the land use characteristics in the Wa Municipality. Zone 1 is an indigenous area developed without local plans consisting of the Suuriyiri and Jengbayiri suburbs. Zone 2 (the Kpaguri Residential) is a newly developed area that has been developed with local plans. Zone 3 (Mangu), however, has a mixture of both indigenous and new developments; the newly developing area of Zone 3 is developing based on local plans.
Data collection
This study encompassed many forms of data collection, including: questionnaire surveys, key informant interview, Global Positioning System (GPS), satellite imagery and direct observation methods in the gathering of primary data. A proportional allocation of 374 houses was estimated as the sample size for the study area based on equation provided by Yamane (1967). Three hundred and seventy-four (374) structured questionnaires were administered to household heads or their representatives of the sampled households. The questionnaire sought to gain information about respondents’ demographic characteristics; building types, age and use; acquisition of permit prior to constructing their building; adherence to land use regulations; and the availability and accessibility to toilet and waste dumping facilities and services. In cases where the household head contacted was not the owner of the house, all possible avenues were exhausted to interview the owners of the selected houses. In addition to the household surveys, semi-structured interviews were conducted on three (3) heads of institutions: the Town and Country Planning Department (TCPD, 2018), the Wa Municipal Assembly (WMA) and Zoom Lion Ghana Limited. All administered questionnaires were cross-checked for completeness and accuracy in order to detect and eliminate errors.

The geographic coordinates of various public toilets and communal waste containers in the study suburbs were obtained with the help of a hand-held global positioning system (GPS) receiver. The points were overlaid with existing country shapefile, using the same projection. The points were plotted in a GIS (Geographic Information System) environment using a satellite image of the study area as a base map, to ensure the conformity of physical development to land use plans within the neighbourhood. Besides, direct field observations were conducted with the help of local plans to cross-check for the availability of sanitary areas in the selected suburbs.
Data analysis and presentation
The quantitative data was analysed using descriptive statistics that is, frequency distribution, percentage frequency distribution and cross tabulation. Additionally, a Chi-square test of independence was performed on the cross tabulation. The information gathered from the interviews of key informants were transcribed and summarised into statements and quotations, which was used to clarify some of the results obtained in the study. The geographic location points of public toilets and communal containers were plotted using ArcGIS (version 10.1), and the results were presented in maps to establish the spatial distribution of public sanitation facilities in the study suburbs.
Demographic characteristics and Land use planning
Table 1 shows the demographic characteristics of the respondents. The majority of the respondents (73.3%) were males while 26.7% were females. Also, 79.9% were married. This is likely due to the fact that marriage is held in high esteem in Ghana, and is considered as a symbol of a matured individual (age-wise) being responsible (Ahortor, 2016; Bogya, 2014). Most of the respondents were males because, within the traditional settings in Ghana, males are considered to be the household heads;
and the head makes household decisions (Klingshirn, 1973; Lloyd and Gage-Brandon, 1993). Females only assume leadership of the household in the absence of the husband. Even in such cases, she will require her husband’s approval upon his return. Therefore, it could be said that decisions relating to land use planning are male-dominated. However, the quality and accessibility of the neighbourhood affect the lives of both males and females. Females play a vital role in terms of ensuring the cleanliness of the household and the neighbourhood at large (Lloyd and Gage-Brandon, 1993). Therefore, incorporating female views in land use planning issues, particularly regarding sanitation needs critical attention.

The age of the household heads differed significantly across the zones. Older household heads dominated Zone 1 as compared to the other zones because the area is an old or indigenous settlement. In contrast, the majority among the younger household heads, such as those within the age group of 20 to 39 years, were found living in Zones 2 and 3. Also, most (55.6%) of the respondents were in the age group 40 to 59 years indicating that the majority of the respondents were within the economically active class. This observation explains why people are putting up buildings in emerging or new developing areas, as further highlighted in the next section. This is an indication that the economically active age groups live outside of the indigenous settlements, possibly due to their ability to afford the cost of constructing new houses.
Education plays a vital role in all aspects of the functional socioeconomic system of a society. An individual’s level of academic education determines how they will embrace and take part in crucial decision making (Klein, 1999). Of the 374 respondents, 31.6% had attained tertiary education while 24.8% had no formal education (Table 1). The level of education of the household heads varied significantly across the zones. 76.8% of the respondents in Zone 2 (Kpaguri Residential) were identified to have attained education at the tertiary level; but a sharp contrast was observed for Zone 1 (indigenous communities), where only 9.3% of the respondents had educational higher levels. Though the respondents have attained other levels of education, it is believed that tertiary education gives an individual the power to critically analyse and appreciate issues. Land use planning, with compliance to building regulations among others are determined by the individual level of understanding, and this is dependent on one’s level of education. Previous studies have opined that low educational attainment in the Wa Municipality results in residence inability to understand building standards, which significantly leads to noncompliance of building regulations (Boamah, 2013; Abugtane, 2015). This noncompliance of building regulations has considerable impacts on the provision of sanitary facilities in the municipality.
A vast majority (97.6%) of the respondents were employed in various sectors of the economy whereas 2.4% of the respondents were unemployed. Traders (businessmen and women) constituted most of the employed group (41.2%) while bankers (1.1%) were the least. Furthermore, traders (48.0%) and teachers (33.0%) dominated Zones 1 and 2 respectively, while the respondents without employment (6.0%) lived in only Zone 1. The Chi-square test indicated a significant relationship between the occupation of the household heads and their areas of residence (zones). The results also suggest that some occupational distributions are located in some residential areas when compared with others. For example, most of the formal jobs are concentrated in the high-class residential areas such as Zone 2 and middle-class residential area, Zone 3, while the informal jobs are concentrated in the low-class residential areas such as Zone 1. This finding agrees with Hoyt’s Sector Zone model which describes the urban structure to be in zones (residential areas) (Boamah et al., 2012). The low-class residents live very close or within the CBD where most of them work in informal jobs, shop, and cheaply commute to work, while the high-class residential areas live far from the CBD, and work in formal jobs.
Building age, type and usage in the Wa municipality
The respondents lived in both old and new housing structures, with ages from 1 year to 110 years (Figure 3). The majority of the houses across the zones were constructed in the year 1991 to 2005; the building age was averagely 25.5 years. Generally, the housing units in the indigenous settlements (Zone 1) were older (average = 33.3 years), but the houses in Zone 2 (average = 17.4 years) and Zone 3 (average = 16.4 years) had almost the same mean age. In addition, the maximum age of houses in Zone 2 is 25 years whereas that for Zone 3 was 27 years. Zone 3 is quite older because part of the area is an indigenous settlement. The fact that all the residential areas have a minimum age of 1 means that housing development is still taking place in all of them. However, the maximum age of 110 also suggested that some of the households were constructed before the introduction of physical development planning in the Wa Municipality. Most of the buildings sampled were used solely as residential facilities, with only about 5% serving as commercial or residential cum commercial facilities (Table 2). The results indicate that there are different kinds of residential units in the Wa Municipality, but compound housing facilities are the most common. In addition, the different zones had significantly different type of housing systems. As shown in Table 2, 58.3% of the respondents lived in compound houses, while 25.4, 15.8 and 0.5% of the respondents stay in detached, semi-detached and
story buildings, respectively. The results agree with that of the 2010 population census data (GSS, 2014) which indicated that the majority (58.3%) of the dwelling units in the municipality are compound houses; separate houses and semi-detached houses constitute 23.0 and 10.2%, respectively. Considering the three zones, 83.3% of the houses were compound houses, 12% of the structures are detached, and 4.7% are semi-detached houses in Zone 1. The dominance of compound houses contributes greatly to the congestion of the Zone. This buttresses the Sector Zone Model that the low-class residential areas live in a congested area or environment, while the high-class residential areas live in spacious environments (Hoyt, 1939).
Conformity of buildings to land use plans
Land uses in the local plan of parts of the Wa Municipality, and all land uses on the plan indicate the kind of physical development that is allowed as shown in Figure 4. The local plan indicates areas for residence, open spaces as well as sanitary areas (marked with grey colour in Figure 4). The local plan is used as a tool for controlling physical development to achieve conformity of buildings to land use plans. Yendaw (2014), noted that communities in Ghana with ineffective land use planning schemes (land use planning regulations not achieving their stated objectives) have poor access to sanitation facilities such as refuse bays and collection points, poor access to residential areas and haphazard siting of buildings; but this does not apply to Kpaguri Residential (Zone 2) of the Wa Municipality. It can be seen that blocks of land within parcels of land have been allocated for sanitation purposes. Perhaps the view of Owei et al. (2010) will be the case of the Wa Municipality. They argued that unsuccessful enforcement of land use plans is one of the challenges of urban sprawl in developing countries. This is due to the fact that the enforcement in these countries is often corrupt and intermittent. This brings up the discussion on household compliance with land use plans. The key issues discussed are the building type, obtaining of building permit and the extent of adhering to planning standards and regulation.

Act 462, enacted in 1993, and the National Building Code (LI 1630) prohibit any physical development without approval from the planning authority by the issuance of a building permit. However, from Table 2, most (70.1%) of the respondents built their houses without obtaining a building permit while only 29.9% had obtained building permits. This revelation supports the findings of Boamah et al. (2012), that most landlords constructed their facilities without securing building permits in the Wa Municipality. While no respondent (landlord) in Zone 1 and only 10.7% of the respondents in Zone 3 (Mangu) obtained a permit before putting up their buildings, 89.3% of the respondents in Zone 2 (Kpaguri Residential) obtained a permit before the construction. From Figure 3b, the majority of the houses in Zone 1 were built before the National Building Code was introduced, so it was not mandatory to secure permits before construction; hence, the observed outcome. The results also suggest that the residential areas in Zone 2 have higher compliance with the building regulations. The lack of acquiring building permits before constructing buildings is a major factor behind insanitary conditions in the Wa Municipality (Abugtane, 2015). Moreover, the type of residential areas significantly influenced the adherence to the building regulations. Generally, house owners in the newly developed areas, which are well-planned, complied with the building regulations such as obtaining permits before putting up buildings and provided sanitary facilities in these areas. On the issue of how the land use and spatial planning department assess compliance to building permits in the Wa Municipality, a key informant at the Town and Country Planning Department said: “The Town and Country Planning Department operates on statutory frameworks such as the Land use and Spatial Planning Act 2016 (Act 925) and National Building Regulation 1996 (L.I. 1630). The statutory frameworks mandate the department to ensure efficient use of land by way of planning. Building and development permits are what the department uses to ensure conformity of physical development to land use plans. However, there is no conformity to such development plans in the Wa Municipality because many land developers often fail to comply. Hence, some sanitary areas have been converted to other purposes.” Meanwhile, 85.9% of the respondents who did not obtain building permits indicated that they were not aware of building permit requirement when they were constructing their houses (Table 2). Those who were aware (6.4%) but still did not obtain the permit attributed their failure to the high cost of obtaining permits. The rest (7.7%) indicated that they were denied a building permit because they failed to provide the required information for obtaining a building permit. There is a sharp contrast between the explanations of the respondents and that of the TCPD regarding the non-compliance of obtaining permits prior to the construction of buildings. There seems to be less sensitising and ineffective enforcement of the land use plans by the municipal authorities and the Spatial Planning Unit. Meanwhile, factors such as the lack of an integrated central database system for permit processing, the lack of coordination between the relevant institution, and too many processing steps vis-à-vis bureaucratic delays, have been cited as reasons why people do not obtain building permits in Ghana (Agyemang et al., 2014).
Adherence to planning standards and regulations
Regarding the general adherence of house owners to the planning standards and regulations, only 29.4% of the respondents were affirmative; the rest admitted to noncompliance. As shown in Table 3, the levels of compliance with the standards and regulations of buildings among the zones varied significantly. Buildings in Zone 1 were non-compliant; those in Zone 2, however, exhibited a high level of compliance (80.4%); and only about 9% of the buildings in Zone 3 had low-to-medium compliance. The high compliance in Zone 2 is because it is a high-class residential area which was well planned (Figure 5b). On the other hand, as evidenced in Figure 5a, the households in Zone 1 are congested and not arranged in a regular pattern that allows for the provision of some sanitary services. This observation is because households in Zone 1 do not have planning guidelines that will demand compliance, as discussed earlier. This result relates to the finding of Mabaso et al. (2015) that the lack of urban planning or failure to adhere to the provisions of such land use plans leads to unplanned, uncontrolled urbanisation, also known as urban sprawl. Additionally, (Boamah et al., 2012) argued that the noncompliance to building regulations in the Wa Municipality is caused by other factors including socio-cultural practices, political interference and, generally, the lack of knowledge regarding the importance of physical development planning. As a result, areas demarcated for the development of social infrastructure such as the
construction of public toilets, siting of communal containers are often encroached and used for residential purposes (Abugtane, 2015). Consequently, the municipality is plunged into a ‘sanitation mess’ (Boamah, 2013; Osumanu et al., 2016). This sanitation problem is a clear indication that ULUP rationale has not been actualised in the Wa Municipality.
Provision of toilet facilities and spaces for toilet facilities
To ascertain compliance with the building standards and regulations in the study area, we further elicited information about the provision of sanitary facilities in the zones. Table 3 shows that the distribution of the types of toilet used among the various zones showed significant differences. Public toilets dominated Zones 1 and 3, whereas household toilets were typical of Zone 2. Figure 5 shows the distribution of public toilet facilities and Zones 1 and 3. As stated earlier, because Zone 2 is a newly developed, high-class residential area, every landlord is expected to incorporate a toilet facility in the house. Considering all the three zones, the public toilet facilities constituted the majority (58.3%) of sanitary facilities in the area followed by private facilities (37.2%); open defecation (OD) was practised in 4.5% of the households surveyed. The proportion of the households who practice open defecation in the study area is relatively smaller as compared to that reported by the GSS (41.8%) in the Wa Municipality. In Zone 1, public toilets dominated (92.0%); the remaining households (8%) had in-house toilets. All the households in Zone 2 had household toilets. Within the suburb of Zone 3, public toilet facilities served the majority of the population (71.4%), with 13.4% of the households having toilets facilities in their homes. A significant proportion (15.2%) of the households in Mangu has no sanitary facilities and, therefore, resorts to open defecation. This finding supports the argument of Oyinloye and Oluwadare (2015) that this lack of public toilet facilities results in the increase of open defecation in low-income residential areas and its associated health impacts. Specifically, Zormal (2016) also reported that the inadequacy of public toilets in the Wa Municipality had compelled some residents to resort to open defecation. However, a recent study indicated that the primary reasons for open defecation in the municipality is because it has been an age-long practice (57%) and financial constraints (18.6%) (Osumanu et al., 2019).
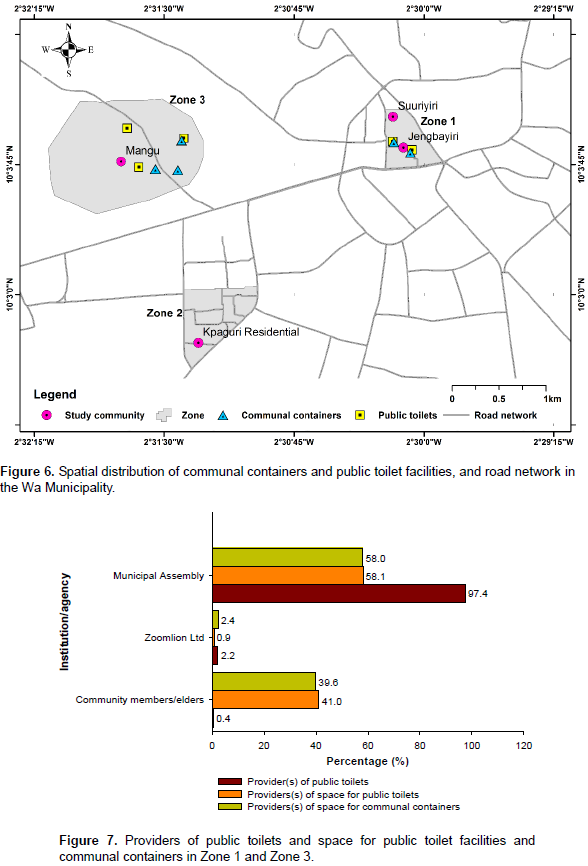
As presented in Figure 7, based on the responses, public toilet facilities are mostly provided by the WMA (97.4%), while Zoomlion Ghana Ltd. and community members/elders contributed to less than 3%. Moreover, 35.3 and 24.9% of the respondents said that the Municipal Assembly and community elders, respectively provided the spaces for the construction of the communal toilets facilities. Only 0.5% of the respondents said Zoomlion Ghana Ltd. provided spaces for the construction of the public toilets. This means that though the community members or elders do not provide public toilet facilities, they contribute significantly towards making land available for the building of such facilities. On the adequacy of the public toilet facilities, only 66.8% of the respondents provided answers. The majority (98.8%) of those that responded said the public toilets in their neighbourhoods were not enough, citing the unplanned nature of the suburbs as well as the negligence of the WMA in providing adequate facilities. Only 0.8% of the respondents were affirmative while the rest provided no answer to the question. However, according to a staff of the Environmental Health Department of the WMA,
“Liquid waste management requires all households to own toilets in their houses and the Municipal Assembly to provide public toilets for strangers or people on transit. This is lacking because many households in the Municipality do not have toilets and the Assembly has not been able to provide enough for the public. Therefore, there is pressure on the few that are available, and many people also practice open defecation.”
Thus, from both the WMA and the respondents, public toilets in the Wa Municipality are inadequate.
Provision of solid waste handling services and waste dumping facilities
From Table 3, the solid waste disposal facilities or methods used across the zones varied significantly. As shown in Figure 6, communal containers are placed at designated places in the Wa Municipality where households dump their waste. About 57% of the respondents indicated that their households dump their waste in communal containers; 33.4% had household waste bins which are collected by a door-to-door service provider; 2.1% of the respondents always burn their waste. Most (80%) of the respondents who reported dumping their waste in waste bins were found in Zone 2. However, almost all (96.0%) respondents within Zone 1 said they dumped their waste into communal containers. Though the communal container system was the most popular disposal option in Zone 3 (Mangu suburb), accounting for 61.9%, a quarter of the respondents indicated that they dispose of their waste at a dumping site. While Zones 1 and 2 use the communal containers and household bins, respectively, Zone 3 has a blend of the communal containers and waste dumping sites. The results confirm previous reports (GSS, 2014; Bowan, 2013) that the communal container system is the most prevalent waste collection option in the Wa Municipal. However, an earlier report suggested that spaces for communal containers have been encroached, compelling residents to travel a long distance before accessing communal containers in the Wa Municipality. Thus, some people are tempted to dump their waste at inappropriate locations (Osumanu et al., 2016). This may have deleterious sanitary ramification on the health of dwellers in the Wa Municipality. Therefore, there is a need for land use planners to make a provision for the siting of communal containers in building plans and enforce adherence to these plans. Furthermore, one of the informants intimated: “In the planning guidelines, local plans are to be prepared in blocks; each has a sanitary area. Sanitary areas are provided in the local plan for low-class and second-class residential areas, while that of the high-class residential areas, no provision is made for sanitary but rather every house must have toilet and waste facilities.” Since residents in Zones 1 and 3 fall in the low and middle-income brackets, respectively, affordability of the door-to-door waste collection service is a challenge; hence, the local authorities provide public sanitary areas and facilities. However, the local plans for the Kpaguri Residential (Zone 2), a high-class residential area, demarcated no sanitary areas (public container sites or dumping sites) because every house is expected to subscribe to a door-to-door waste collection service. The absence of sanitary areas and facilities in Kpaguri Residential implies that developments in the area have conformed to the local plans of the Wa Municipality. Moreover, the dominance of household waste bins in Zone 2 relates well with the sector model which argues that the wealthy class prefers to stay far away from the CBD, and are able of pay for other services such as transport and sanitation.
Access to sanitary facilities
On the general accessibility to sanitation facilities, most (68.2%) of respondents, all residents of Zones 1 and 3 indicated that they do not have full access to public sanitation facilities in their suburbs because of the unplanned nature. The remainder, mostly residents of Zone 2, said otherwise and pointed out that their suburbs are well-planned (Table 4). As discussed earlier, many households still have challenges in accessing sanitary facilities in the Wa Municipality primarily because the municipality has inadequate sanitary facilities, as earlier reported by other studies (Boamah, 2013; Dongballe, 2016; Zormal, 2016). Further, as presented in Table 5, we found that inadequate spacing of the available facilities, long distances from houses and conflicts in siting the facilities also pose challenges to the accessibility and sanitary facilities. A staff of the TCPD of the WMA noted: “In providing sanitary space in the local plans, the distance of every house to the sanitary place is considered to ensure easy access. Planned areas allow every house in all the residential areas to have good access to sanitary facilities. However, areas not planned face challenges in accessing sanitary facilities.” This implies that the TCPD are making efforts to facilitate residential areas access to sanitary facilities; however, this is only possible if the area is well-planned. As a result, the indigenous settlements, which were occupied before the development of the land use planning guidelines often, lack the opportunity to be provided with sanitary areas within their residences.
In addition to this, the proportion of homes accessible by vehicles and well-connected to roads, and the conditions of road networks were significantly different across the zones, as depicted by the Chi-square results in Table 4. The results show that in Zones 1 and 3, the lack of accessible roads and the poor conditions of the existing roads contributes to the difficulty of accessing sanitation facilities. Most of the houses in these zones are not well-connected to a road or have roads in a deplorable state. The lack of access routes hampers the delivery of door-to-door waste collection services by Zoomlion Ghana Limited. A staff of the company confirmed this assertion, saying “Our waste trucks have easy access to residential areas with roads network but have challenges in areas without roads and walkways. It is, therefore, not easy accessing communal containers in Suuriyiri and Jengbeyiri.” The poor road access has also culminated in the popularity of the communal containers and waste dumping sites in the two zones. The absence of roads network implies that residents have to walk for a long distance to access sanitation facilities elsewhere, or are living under poor sanitation conditions. The residents in these zones walk between 1 and 30 min to access sanitary facilities, with a significant proportion (about 30%) walking more than 10 min. This finding empirically illustrates the description by the Sector Model that low-class residential areas are highly inaccessible, have no open spaces (congestion) and are characterised by bad environmental issues like poor sanitation and air pollution (Hoyt, 1939).

Regarding the conflicts in siting sanitation facilities, the Environmental Health Officer at the WMA explained as follows: “The Municipal Assembly provides sanitary areas, as contained by the general layout of the municipality by the Town and Country Planning Department. The assembly has to provide the sanitary facilities. However, when the assembly fails to negotiate well with landlords to procure and protect such places for sanitary areas, they are encroached by the landowners, and large sums of monies are paid to compensate the landlords in order to acquire places for sanitation practices. Moreover, the unplanned areas are deprived of sanitary facilities once it is difficult to access land.” Therefore, though the local plans provide spaces for both residential and sanitation facilities, the WMA needs to negotiate with the landlords in order to procure and protect the public places (sanitary areas). In addition to this, the landowners can claim their lands if the negotiation fails or delays, thus making it difficult for the Municipality to access places for sanitation. Hence, the dynamics between the WMA and the landowners also contribute to the challenges associated with limited access to sanitary facilities in the Wa Municipality.