ABSTRACT
As many cities in the global South are expanding rapidly, their urban form and built environment transforms and thus people’s travel demand and behaviour. This paper investigates how the built environment on district level influences individuals’ travel behavior and rationales for activity and mode choice in two Bangkok districts. Findings shows that individuals in the sparse outer district – who belong to larger households and have higher average incomes – travel more frequently, travel much longer distances, use more modes per trip, and rely on private motor vehicles to a much larger extent compared to individuals in the dense inner district. Individuals´ selection of activity location is mainly based on a wish to reach the best facility, disregarding of district, in particular work and education, and to reduce distance, especially for grocery shopping, less so for specific goods and leisure, and least for visit purposes. Mode choice is mainly determined by a combination of time, costs, and convenience. In the absence of high-capacity transit systems Bangkok’s motorized vehicle fleet (and use) will most likely continue to grow among its close to 30 fringe and outer area districts located far away from the city centre and work place clusters. Here private motor vehicle use is often the only option. If these residents start driving, land use planning and/or provision of high-capacity transit will most likely have a small influence on how much they drive.
Key words: Built environment, district level, individual travel behavior, Bangkok.
A large body of research from cities in western countries has investigated the relationship between travel behavior and the built environment (BE), that is, land use design, mix and density, accessibility, and individual attributes (Dieleman et al., 2002; Giuliano and Narayan, 2003; Jabareen, 2006; Elldér, 2015). In contrast, research from Asian developing cities are still scarce, mainly due to lack of and/or poor quality national data on land use and transportation networks, although the last decade has seen a growing number of studies (Pattersson and Schmöcker, 2010; Ho and Yamamoto, 2011; Dissanayake and Morikawa, 2010; Dissanayake et al., 2012; Cervero, 2013; Shirgaokar, 2014, 2016).
In many Asian cities, the population, incomes, and private motor vehicle ownership are expanding rapidly and thus people’s travel demand and travel behavior changes (Acharya and Morichi, 2007; Dissanayake and Morikawa, 2010). Often the lack of institutional capacity and lack of planning and land use controls (or reverse, extremely strong land use controls in central areas (Sridhar, 2010; Shirgaokar, 2014)) has resulted in rampant and uncontrolled sprawled development, beyond city boundaries and away from a non-motorized and public transport oriented land use structure, a structure many of these cities were laid out for and which has been viewed as a major advantage in avoiding an unsustainable development pattern (Gakenheimer, 1999; Huang et al., 2007; Suzuki et al., 2013). Instead, many countries have followed urban planning policies which owe their origin from the industrialized world, where traffic and transport planning approaches often failed to resolve urban planning problems (Banjo and Dimitriou, 1983; Suzuki et al., 2013; Shirgaokar, 2016).
Given the associated effects this development result in – congestion, pollution, infrastructure, and public health costs – citizens, policy makers, and advocacy groups are increasingly interested in mitigating the rapid rise in private motor vehicle ownership (Guerra, 2014). Land use planning offers one opportunity, but it is controversial whether land use planning offer the same potential in the global South, as there are reasons to believe the situation is more complex here owing to semi-regulated land markets and inefficient institutional planning (Gakenheimer, 2011; Shirgaokar, 2014, 2016). As a result, cities develop in complex, haphazard, and unregulated ways (often suddenly and swiftly). Finally, land use development in the central city is often constrained, while development permits in the peripheries are much more lax, resulting in rapid growth in the exurbs. The situation in Bangkok is no different (Ratanawaraha, 2010). Comprehensive plans and the planning processes in the Bangkok Metropolitan Region are rife with regulatory and governance issues that make the control of urban development ineffective. Accordingly, comparisons between districts with different characteristics within the same urban area are useful as it enhances the ever current issue of understanding of how different planning policies play out and take on meaning within city systems (Harvey, 2009).
The objective of this paper is to investigate how BE influences individual travel behaviors in two Bangkok districts. Based on interviews with 91 individuals, the following issues are addressed: BE’s influence on individuals’ travel behavior; the differences between individuals with and without access to private motor vehicles; and the individuals’ rationales for choosing activity locations and modes. BE on district level includes population and employment density, distance to the city centre, land use, access to transport infrastructure, and public transportation services. The remainder of this article consists of a discussion on the urban transformation processes and a literature review on cases from cities in the global South. The transport situation and developments in Bangkok are thereafter presented, followed by a presentation of the two districts and the data and variables used. The findings and discussion are thus put forward and the paper is concluded.
URBAN TRANSFORMATION IN THE GLOBAL SOUTH
Built environment, land use, and transport planning
Except for rapid urbanization and private motor vehicle ownership, and poor provision of public transportation, cities in the global South often have other commonalities, such as uncoordinated (or lack of) land use and transport planning, and weak institutions (Tiwari, 2002; Pucher et al., 2005; Gakenheimer and Dimitriou, 2011; Agarwal, 2012; Suzuki et al., 2013). These developments, together with rising rents, reclamation of inner city residential areas, and strong land use controls in city centres (e.g., floor space restrictions and building heights (Sridhar, 2010)), influences the BE and promotes land use transformation and urban expansion (Zegras and Gakenheimer, 2006; Yang and Gakenheimer, 2007; Zegras, 2010; Day and Cervero, 2010; Shen and Wu, 2012). Exurban areas, lacking sufficient transport infrastructure and urban mass transit services (investments have largely been clustered in city centres or within municipal boundaries) have become preferred home locations for the working poor and emergent middle class (Day and Cervero, 2010; Shirgaokar, 2016). For example, in China, tens of millions of central city residents have relocated to the suburbs (Day and Cervero, 2010). This transformation often leads to activities becoming more sparsely separated and an increase in demand for private motorization, discouraging the usage of non-motorized modes and provision of economically viable public transportation (Suzuki et al., 2013). Accordingly, the pattern of higher private vehicle use in peripheral areas in cities in the global South take place under different conditions, that is, while city expansion is rapid, it is very often not accompanied with sufficient supply of roads and public transit services (Shirgaokar, 2016).
In his review of transport policies and urban development between 1900 and the 1960s, Barter (1999) found that, by the end of the period, most Asian cities were more vulnerable to problems from an influx of private vehicles than Western cities had been at the equivalent stage in their motorization, primarily owing to higher densities and greater dependence on public transport. Thus even a low increase in private motor vehicles result in intense traffic congestion. In such situations, anti-densification and de-congestion policies may seem reasonable and logic (Shirgaokar, 2016). Despite this, government investments in transport have mainly been spent on projects that benefit car owners, often to the detriment for provision and use of public transportation (although exceptions exist, Dissanayake et al., 2012; Agarwal, 2012), and bicycle and walking (Tiwari, 2002; Diaz Olvera et al., 2003; Salon and Aligula, 2012). To avoid repeating less successful land use planning from the developed world, suggestions have been put forward to realize a sustainable city, such as poly-centered development (Feng et al., 2008), transit orientation (Suzuki et al., 2013; Shirgaokar, 2016), better use of existing infrastructure and preservation of dense city forms (instead of expanding road capacity), enabling short trip distances and a high share of non-motorized transport (Tiwari, 2002; Huang et al., 2007; Guerra, 2014).
Literature review
Dissanayake and Morikawa (2010), studying travel behavior in Bangkok among different market segments based on travel modes and income groups, found that bus and motorcycle users were likely to shift to the proposed mass rapid rail transit but car users were not. Ho and Yamamoto (2011), using household interviews from Ho Chi Minh City, found that both subjective and objective dimensions of the BE (bus coverage, walking/cycling conditions, residential land use diversities) were important determinants for multi-vehicle ownership, while the effects of self-selection were relatively modest. Shirgaokar’s (2016) findings from Mumbai concludes that policies encouraging higher land use diversity, density, and transit supply only have a marginal potential to decreased vehicle use. It was claimed that people in the global South do not base their choices of residential location, destinations, and travel modes on their attitudes but mainly on income (Shirgaokar, 2016).
Srinivasan and Rogers (2005) analyzed the differences in mode choice and trip frequency due to differences in accessibility to employment and services among 70 households in Chennai. They found that the differences in accessibility strongly affected travel behavior; residents in the centrally located area made more trips and were more likely to use non-motorized modes compared to residents in the periphery. As to the impact of distance from the city centre, using cross-sectional household travel data from Mumbai, Shirgaokar (2016) found that the farther a household is located from a city centre the greater its use of cars compared to two-wheeled motor vehicles, suggesting that the use of cars may increase more compared to two-wheeled motor vehicles in expanding Indian cities.
Turning to studies investigating the relationship between density and vehicle ownership and use, and non-motorized travel; while several studies – mainly conducted in the developed world – have found that density is negatively correlated with vehicle use (Ewing et al., 2014; Ewing and Cervero, 2017), studies from developing cities also generally find statistically significant correlations, but the relationships are not systematically stronger (Guerra, 2014). It has also been pointed out that higher density only curb vehicle use marginally, indicating its inefficiency as a policy (Shirgaokar, 2016). BE impacts are also related to thresholds, that is, above or below a certain threshold change in the BE is likely to have little or no effect on travel because it no longer influences the relative attractiveness of travel choices (that is, BE’s influences on the relative cost and availability of different travel alternatives for achieving day-to-day activities) (Guerra, 2014). Furthermore, the extent to which higher density curb vehicle use may be related to density levels itself, which differ considerably between and within cities in the global South (Suzuki et al., 2013; Bertaud and Malpezzi, 2014; Guerra, 2014). For example, while Mumbai has an average population density close to 400 per hectare, Beijing’s density is around 150 and Bangkok’s only around 60 (Suzuki et al., 2013: 153). Thus there is no reason to expect the influence of BE on car travel to be stable either across geographies or over time. Wang et al. (2011), studying activity-travel behavior in neighbourhoods in Beijing, found significant differences in car ownership, trip rate, and travel time. For example, the traditional dense danwei compounds resulted in lowest travel time, distance, and automobile reliance, while the newly developed neighborhoods had the reverse effect. Pan et al. (2009), studying the influence of urban form on travel behavior in four Shangahi neighborhoods, found that residents of pedestrian/cyclist-friendly neighborhoods traveled shorter distances compared to residents in other neighborhood types. Likewise, Naess (2009), studying the influence of residential location on travelling behavior in Hangzhou Metro Area, found that, on average, people living close to the CBD used less energy for transport; they travelled less in total and made a greater share of their journeys by bike or on foot compared to people further away from the downtown.
Bangkok metropolitan area
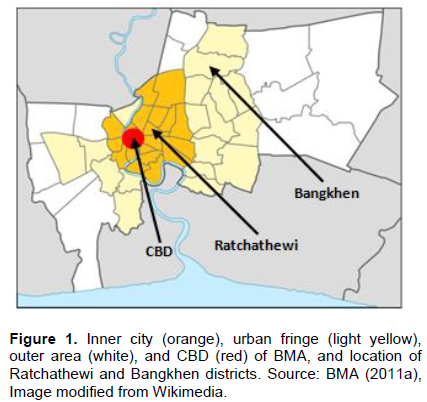
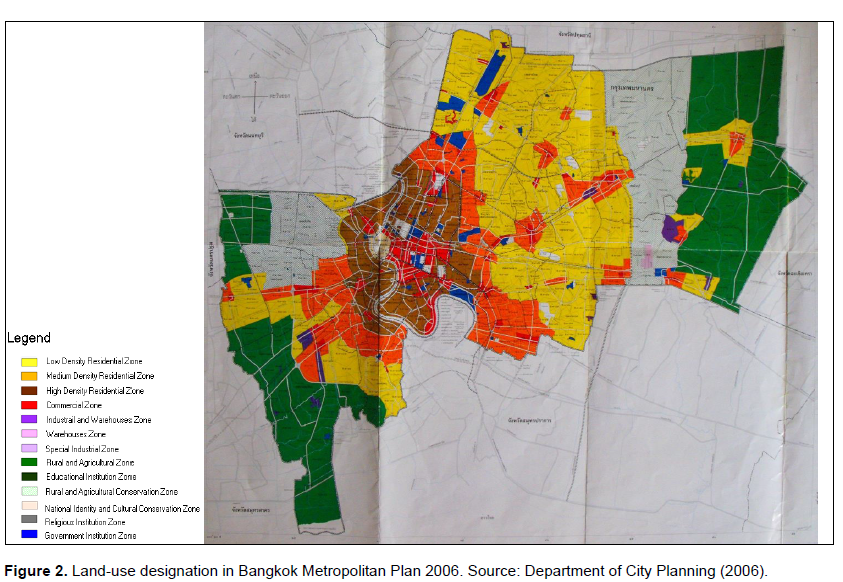
Bangkok Metropolitan Area (BMA), an area spanning 7761 km2, had over 12 million inhabitants in 2010, distributed over 50 districts classified into three groups based on their location in relation to the city centre: 21 Inner City districts, 18 Urban Fringe districts, and 11 Outer Area districts (Figure 1) (BMA, 2011a). BMA’s population density averaged 4478 per km2, spanning from 640 to 27 179 km2 (BMA, 2011a; BS, 2011). Both population and employment densities are highest is the Inner City and becomes sparser further away from the centre (Figure 2) (Vichiensan, 2007). BMA has a long history of poor transport system coordination – with responsibilities being spread among different ministries – and lacks a real transport master plan (Rujopakarn, 2003; Braun, 2011). According to Ratanawaraha (2010), regulatory inadequacies include improper use of future land-use maps as zoning maps, area unspecific subdivision and bulk regulations, confusing permission of secondary use in zoning regulations, and unrealistic density control figures. Governance problems include the overlapping and disjointed responsibilities of planning agencies, and the lack of implementation mechanisms for regional plans. Recent changes in the planning contexts due to decentralization and government downsizing have made it even more difficult to control urban development at the regional level. These include the accountability and transparency issues regarding the use of planning consultants.
At present, roads cover about 10 % of BMA’s total area, but this is considered inadequate and further expansion is planned (BMA, 2011b). Over time, road transport has been prioritized, while land use planning and public transport has received less attention (Vichiensan, 2007; Braun, 2011). In 2012, there were close to 11.8 million registered passenger cars in Thailand, up from 6.5 million in 2004 (ASEAN-Japan Transport Partnership, 2014). The share of and growth in registered motor vehicles is highest in the BMA. These trends have led to a mismatch between an emerging motor vehicle-oriented transport pattern and the pre-existing high-density urban form (Barter, 1999).
The 6th National Economic and Social Development Plan (1987-1991) recommended a new urban management policy for BMA through an improved public transport system, but congestion increased and expanded uncontrollably to the outskirts. It was followed by “the private sector phase” during the 7th Plan (1992-1996), with the objective to share costs with the private sector. The first Mass Rapid Transit (MRT) master plan in 1994, allocated large investments to public transport, but the land use plan only provided guidelines (OTTP, 2011). The 8th Plan (1997-2001) proposed 150 projects, but only 22 were implemented (partly delayed by the 1997 Asian economic crisis). More recently, severe road congestion has shed the light on the need of more efficient transport modes. Two Skytrain routes opened in 1999 (BMTS, 2011; MRTA, 2011a), a new MRT subway opened in 2004, and both the Airport Link and the first Bus Rapid Transit (BRT) route opened in 2010. These routes mainly cover the central city, important commercial, residential and tourist areas, and the airport. But this is still considered inadequate, and therefore a 20-year extension project has been planned for the rail network and the BRT (MRTA, 2011a, b). The 211 bus lines (which are often crowded and unreliable), 117 public van routes, and 110 shared taxi routes provided by the Bangkok Mass Transit Authority primarily service the central area of the city (Braun, 2011). Motorcycles for hire are available almost everywhere. Roads and residential streets connecting the main roads have poor footpaths which are crowded by street vendors. As a result from poor planning, walking and bicycle lanes have been neglected (Braun, 2011).
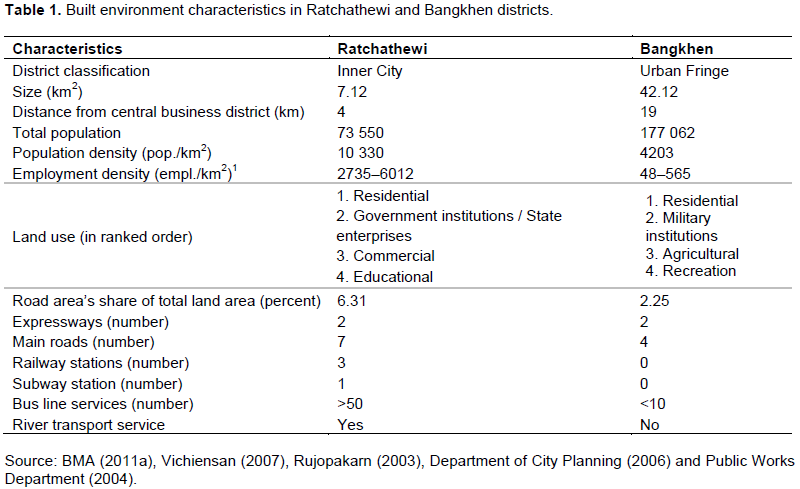
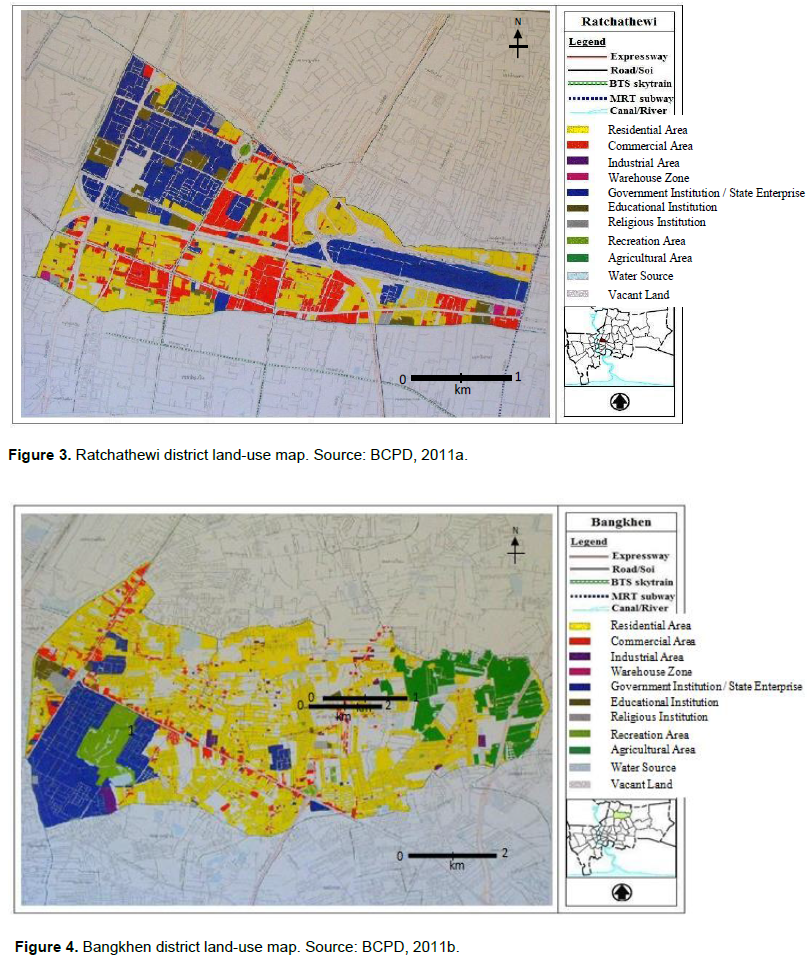
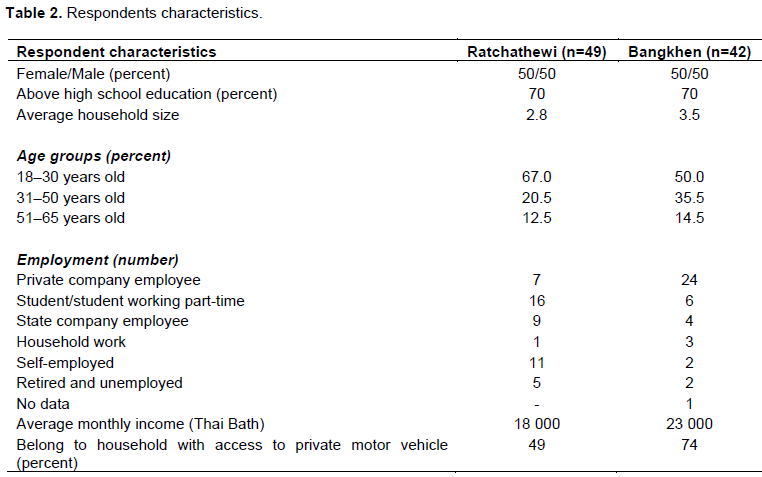
The selection of study districts was based on the following criteria: distance to the city centre, population and employment densities, land use, and access to roads and public transport. To begin, the Urban Fringe district, Bangkhen (Figure 1), is six times bigger than Ratchathewi, the Inner City district, in terms of area and is located much further away from the city centre (Figure 1 and Table 1). Furthermore, in 2010 Ratchatewi’s population density was close to one and half times higher than Bangkhen’s and its employment density was also much higher (Table 1). The districts’ characteristics differ in other ways. Roughly half of Ratchathewi’s land area is used for residential purposes, and government institutions/state enterprises and education institutions also make up large areas (Figure 3 and Table 1). Commercial zones are spread all over, but only small pockets of land are classified as industrial and recreational. In Bangkhen, residential areas dominate, but military units also take up a large area (Figure 4 and Table 1). Commercial and industrial areas are concentrated along the main roads and make up a smaller share compared to in Ratchathewi. There is also a large agricultural area and vacant lands are available all over the district. As for transport infrastructure and services provision, Ratchathewi’s supply is much higher compared to Bangkhen (Table 1).
Semi-structured interviews, comprising basic characteristics (household income, education level, household size etc.), travel behavior (frequency, mode, purpose, distance), and rationale behind activity location and mode choice were conducted with 91 respondents (49 in Ratchathewi; 42 in Bangkhen) in 2011 (Table 2). Interviews were carried out when the respondents visited their district’s office. Once approximately 70 respondents had been interviewed, a saturation
level appeared but we decided to add another 20 respondents. Everyday life is comprised of activities carried out by individuals at various locations so as to fulfill different needs; physiological (eat, sleep), institutional (work, education), personal obligations (childcare, shop) and personal preferences (leisure). As for trips, Vilhelmson (2007) divides trips into four categories according to how fixed and flexible they are in time and space. Bounded trips are trips in which geographical location and time to perform activity are fixed (work or school). Non-bounded trips are trips where time and location of activity is flexible (leisure trips). An intermediary group comprises of trips where time of activity is fixed but location may vary and trips where location is fixed but may vary in time (visiting parents). The semi-bounded trips are those where the location may vary and time can be flexible, but the trips take place quite regularly (grocery shopping).
Trip purposes were divided into work, education, shopping, social, leisure, and bring children to/from school. From this, five categories were outlined, namely between home and: i) work and child’s school, ii) education, iii) shopping, iv) leisure/social, and v) shopping/leisure. Category 5 was a result of special circumstances, where shopping and leisure could not be separated. Thereafter, the categories were divided into two categories based on temporal and spatial flexibility: bounded trips, including work and education trips, and bring children to/from school, and non-/semi-bounded trips, including shopping, leisure, and social trips. Bring children to/from school were included in work trips since they are fixed in time and place. Social trips were included in leisure trips since their temporal and spatial flexibility is similar. Residence and activity locations were used for analyzing trip distribution and distance. Modes included private motor vehicle (motorcycle, car), public transport (bus, mini-van, rail), paratransit (hired motorcycle, taxi), and non-motorized (walk, bicycle).
Travel frequency
Individuals in Ratchathewi and Bangkhen made, on average, almost the same number of trips per week, and those with access to private motor vehicles made fewer trips compared to those without access (Table 3). Thus the BE and access to private motor vehicles did not influence travel frequency in any major way. However, both those with and without access to private motor vehicles in the sparse outer district made more trips compared to their counterparts in the dense inner district (Table 3).
Bounded vs non-/semi-bounded trips and distances travelled
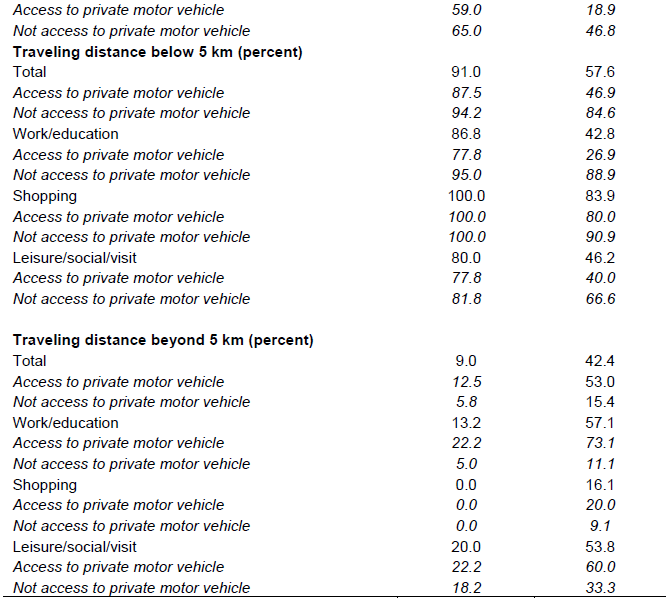
The trip purposes that dominated during the week among the respondents in the dense inner district, both among those with and without access to private motor vehicles were, in ranked order: shopping, work, education, leisure, and social/visit purposes (Table 3). The situation in the sparse outer district was different, here work dominated both among those with and without access to private motor vehicles, followed by shopping, leisure, education, and social/visit purposes (Table 3).
Of the respondents in the dense inner district, a large majority performed bounded trips, both among those with and without access to private vehicles, but very few travelled beyond 5 km, especially those without access (Table 3). In the sparse outer district a majority of the respondents made bounded trips, but it was only those with access to private motor vehicles who travelled beyond 5 km to a large extent (Table 3). As for non-/semi-bounded trips, in the dense inner district all respondents shopped local, and although more than 80% of the respondents in the sparse outer district also shopped local (all shopped groceries locally), 16% also travelled beyond 5 km for this purpose, especially those with access to private motor vehicles (Table 3). In the dense inner district, a large majority performed leisure/visit/social trips, a large majority performed such trips within 5 km, and the difference between those with and without access to private motor vehicle was very small (Table 3). In the sparse outer district, less than half performed leisure/visit/social trips within 5 km and an even lower share among those with access to private motor vehicles (Table 3).
Mode choice
Non-motorized modes were the major choice in the dense inner district, followed by public transport, private motor vehicles, and paratransit, while private motor vehicles made up the major share in the sparse outer district, followed by non-motorized, public transport, and paratransit (Table 3). Of those with and without access to private motor vehicles, among respondents without access, non-motorized modes dominated in both districts, and among those with access, non-motorized modes dominated in the dense inner district and private motor vehicles dominated in the sparse outer district (Table 3).
Mode choice by trip purpose showed two major distinctions: non-motorized modes dominated for all purposes in the dense inner district (public transport was second for all purposes, except for shopping), while private motor vehicles dominated for all purposes except for shopping in the sparse outer district (non-motorized modes were second for all purposes). A large majority of all trips were carried out by one mode in both districts. In the dense inner district, no trip comprised more than two modes, while in the sparse outer district, 11% used three to four modes in one trip. As for those with and without access to private motor vehicles: those with access to private motor vehicles mainly used one mode, in both districts, while 50% of those without access in the dense inner district used two modes and a large share of the respondents without access in the sparse outer district used three modes.
To sum up, individuals' travel behavior is partly influenced by respective district’s BE. The much higher densities – translated into shorter average travel distances – in the inner district, together with its mixed land use, access to transport infrastructure, and provision of public transportation translates into individuals in the dense inner district travel much shorter distances, use fewer modes per trip, and rely on walking and public transport to a much larger extent compared to individuals in the sparse outer district. Those who live further away from the infrastructure corridors – such as the working poor and emergent middle class households (with rising incomes) – face the first-mile problem, which is either solved by using inter-modal services or by walking or bicycle. Some of these individuals are also purchasing private motor vehicles, partly depending on the distance they need to travel and their money value of time.
Rationale behind activity selection and mode choice
Respondents both wished to reach the best facility and to reduce travel time when referring to work and education trips, but to reach the best facility dominated (70%), they simply wanted to reach companies with high reputation, disregarding of distance. Many of these companies are located in the inner city. In some cases, the workplaces are located in the respondents’ residential area, but while this is convenient many are willing to travel further in order to reach workplaces that match their qualifications, that is, they are not prepared to accept a job close to home if it is an inferior one. Another reason was that often individuals are not in the position to choose his/her workplace, but instead are stationed at a specific location. While it was most common among the young to move to get closer to their school and to reduce travel costs, this was not common among the older, who often claim that due to extremely high land prices in the city’s central areas they cannot afford to live there, despite their work being located there. Very few respondents had a different opinion.
Selection of shopping locations varies. For groceries, distance is central; all respondents shop close to their residence or workplace. Distance is less important for specific goods, instead product variety and prices are important. Despite being willing to visit distant destinations, the distance depends on the product and how much it is wanted. Many visit/social trips are only available at a specific location, for example visiting parents. A key factor when making decision on leisure location is the quality of the facility, distance is less important, and if the activity’s location is far away many use their car. Otherwise, around 80% of those performing leisure trips wanted to limit distances. However, when linked with other purposes (shopping, meeting friends) locations located further away can be chosen.
The main factors affecting respondents’ mode choice are speed, costs, and convenience. These are seldom met simultaneously. Private car/motorcycle and urban rail users often mention time and speed as their rationale, the former mainly as a rationale in outer areas and the latter in central parts of the city. Thus different modes have an advantage depending on location of destination. Some also use para-transit because it is fast, but this is not as apparent in the dense inner district where distances are shorter. Many also wanted to reduce costs and only used more expensive modes (e.g., taxi) when it was shared with others. One respondent had shifted from car to public transport due to fuel prices and expressway charges. This reflects the quality of urban rail which is fast and cheap. Convenience is a reason often mentioned for avoiding public transport and walking (especially in the sparser outer district), particularly among private motorist, but also due to the cars reachability and no need to transfer between modes. Most private motor vehicle users stated that. Finally, safety and a wish to exercise are other factor affecting mode choice, although they are mentioned rarely.
As growing cities have a tendency to expand outward – especially in situations where planning is uncontrolled and haphazard – the demand for private vehicle ownership and usage increase among households located in the peripheries where land use densities are low and public transport provision is insufficient. Many of the findings in this paper support previous studies from other cities in the global South, namely that there are significant differences in individuals travel behavior between districts within the same city; individuals in peripheral and sparsely settled areas travel longer distances, use private motor vehicles more often (for most or all trip purposes), cars in particular, and travel more frequently (Srinivasan and Rogers, 2005; Tanimowo, 2006; Naess, 2009; Wang et al., 2011; Shirgaokar, 2016). Comparisons between districts with different characteristics within the same urban area are useful as it enhances our understanding of how planning policies play out and takes on meaning within the city system.
This paper has also contributed to further our understanding of individuals’ selection of activity location (a wish to reach the best facility and to reduce distance) and mode choice (a preferred combination of speed, price, and comfort). As the difference in travel time between fast and slow modes is lower over short distances, walking is used more often in dense areas, while the reverse situation is true for sparsely settled areas. Convenience also influence mode choice as long distances discourage against walking and encourage car use. Fast, frequent and relatively cheap urban transit attract individuals in dense areas, poor public transport provision in sparsely settled areas further encourages private motor vehicle usage.
Finally, Bangkok’s transport infrastructure provision policies have and still focus on improving people’s mobility by car (despite investments in mass rapid transit, sky trains, and subways), thus following a strategy found in many cities throughout the global South. In the absence of high-capacity transit systems, Bangkok’s motorized vehicle fleet (and use) will most likely continue to grow in the close to 30 fringe and outer area districts located far away from the city centre and work place clusters. Here private motor vehicle use is often the only option. If these residents start driving, land use planning and/or provision of high-capacity transit will most likely have a small influence on how much they drive.
The authors have not declared any conflict of interests.
REFERENCES
|
Acharya SR, Morichi S (2007). Motorization and role of mass rapid transit in East Asian megacities. Int. Association of Traffic and Safety Sci. Res. 31:6-16.
Crossref
|
|
|
|
Agarwal A (2012). Mumbai urban transport project – A multidimensional approach to improve urban transport. Research in Transportation Economics 40:116-123.
Crossref
|
|
|
|
ASEAN-Japan Transport Partnership (2014). 2014 ASEAN-Japan common templates data (2004–2013).
|
|
|
|
Banjo G, Dimitriou H (1983). Urban transport problems of third world countries: the third generation. Habitat Int. 7:99-110.
Crossref
|
|
|
|
Barter P (1999). An international comparative perspective on urban transport and urban form in Pacific Asia: the challenge of rapid motorization in dense cities. Murdock University: Perth.
|
|
|
|
BCPD (Bangkok City Planning Department) (2011a).
View
|
|
|
|
BCPD (Bangkok City Planning Department) (2011b).
View
|
|
|
|
Bertaud A, Malpezzi S (2014). The spatial distribution of population in 57 world cities: the role of markets, planning, and topography. Draft manuscript.
View
|
|
|
|
BMA (Bangkok Metropolitan Administration) (2011). Geography of Bangkok.
|
|
|
|
BMA (Bangkok Metropolitan Authority) (2011a). BMA Data Center. In Thai.
|
|
|
|
BMA (Bangkok Metropolitan Authority) (2011b). 12-year Bangkok development plan: 2009–2022. In Thai.
|
|
|
|
BMTA (Bangkok Mass Transit Authority) (2011). Bus routes. In Thai.
|
|
|
|
BMTS (Bangkok Mass Transit System) (2011). BTS sky train.
|
|
|
|
Braun M (2011). Bangkok public transport accessibility levels. Master thesis, Erasmus University Rotterdam: Rotterdam.
|
|
|
|
BS (Bangkok Statistic) (2011). 2010 Statistic. In Thai.
|
|
|
|
Cervero RB (2013). Linking urban transport and land use in developing countries. J. Transport Land Use 6:7-24.
Crossref
|
|
|
|
Day J, Cervero R (2010). Effects of residential relocation on household and commuting expenditures in Shanghai, China. Int. J. Urban Regional Res. 34:762-788.
Crossref
|
|
|
|
Department of City Planning (2006). Bangkok road network [Brochure]. Bangkok.
|
|
|
|
Diaz Olvera L, Plat D, Pochet P (2003). Transportation conditions and access to services in a context of urban sprawl and deregulation. The case of Dar es Salaam. Transport Policy 10:287-298.
Crossref
|
|
|
|
Dieleman FM, Dijst M, Burghouwt G (2002). Urban form and travel behavior: micro-level household attributes and residential context. Urban Studies 39:507-527.
Crossref
|
|
|
|
Dissanayake D, Morikawa T (2010). Investigating household vehicle ownership, mode choice and trip sharing decisions using a combined revealed preference/stated preference nested logit model: case study in Bangkok Metropolitan Region. J. Transport Geog. 18:402-410.
Crossref
|
|
|
|
Dissanayake D, Kurauchi S, Morikawa T, Ohashi S (2012). Inter-regional and inter-temporal analysis of travel behaviour for Asian metropolitan cities: Case studies of Bangkok, Kuala Lumpur, Manila, and Nagoya. Transport Policy 19:36-46.
Crossref
|
|
|
|
Elldér E (2015).The changing role and importance of the built environment for daily travel in Sweden. PhD-thesis. University of Gothenburg, Gothenburg.
|
|
|
|
Ewing R, Hamidi S, Gallivan F, Nelson AC, Grace JB (2014). Structural equation models of VMT growth in US urbanized areas. Urban Stud. 51:3079-3096.
Crossref
|
|
|
|
Ewing R, Cervero R (2017). Does compact development make people drive less? The answer is yes. J. Am. Planning Association 83:19-25.
Crossref
|
|
|
|
Feng X, Fujiwara A, Zhang J (2008). Exploring sustainable urban forms for developing city based on new integrated model. J. Transportation Syst. Eng. Inform. Technol. 8:50-60.
Crossref
|
|
|
|
Gakenheimer R (1999). Urban mobility in the developing world. Transportation Research Part A 33:671-689.
Crossref
|
|
|
|
Gakenheimer R (2011). Land use and transport in rapidly motorizing cities: contexts of controversy. In Gakenheimer and Dimitriou (Eds.) Urban transport in the developing world. A handbook of policy and practice. Edward Elgar: London. pp. 3-7, 40-68.
|
|
|
|
Gakenheimer R, Dimitriou H (2011). Introduction. In Gakenheimer and Dimitriou (Eds.) Urban transport in the developing world. A handbook of policy and practice. Edward Elgar:London. pp. 3-7.
|
|
|
|
Giuliano G, Narayan D (2003). Another look at travel patterns and urban form: The US andGreat Britain. Urban Studies 40:2295-2312.
Crossref
|
|
|
|
Guerra E (2014). The built environment and car use in Mexico City: is the relationship changing over time? J. Planning Educ. Res. 34:394-408.
Crossref
|
|
|
|
Harvey D (2009). Social justice and the city. Revised edition. The University of Georgia Press: London.
|
|
|
|
Ho CQ, Yamamoto T (2011). The role of attitudes and public transport service on vehicle ownership in Ho Chi Minh, Vietnam. Australian Transport Research Forum 2011.
|
|
|
|
Huang J, Lu XX, Sellers JM (2007). A global comparative analysis of urban form: Applying spatial metrics and remote sensing. Landscape Urban Planning 82:184-197.
Crossref
|
|
|
|
Jabareen YR (2006). Sustainable urban forms. Their typologies, models, and concepts. J. Planning Educ. Res. 26:38-52.
Crossref
|
|
|
|
MRTA (Metropolitan Rail Transport Authority) (2011a). 12 ways brochure. In Thai.
|
|
|
|
MRTA (Metropolitan Rail Transport Authority) (2011b). Project.
|
|
|
|
Naess P (2009). Residential location, travel behavior, and energy use: Hangzhou Metropolitan Area compared to Copenhagen. Indoor and Built Environment 18:382-395.
Crossref
|
|
|
|
Pan H, Shen Q, Zhang M (2009). Influence of urban form on travel behaviour in four neighbourhoods of Shanghai. Urban Studies 46:275-294.
Crossref
|
|
|
|
Pattersson P, Schmöcker J-D (2010). Active ageing in developing countries? – trip generation and tour complexity of older people in Metro Manila. J. Transport Geog. 18:613-623.
Crossref
|
|
|
|
Public Works Department (2004). Roads and streets in Bangkok, distributed by districts.
|
|
|
|
Pucher J, Korattyswaropam N, Mittal N, Ittyerah N (2005). Urban transport crisis in India. Transport Policy 12:185-198.
Crossref
|
|
|
|
Ratanawaraha A (2010). Regulatory and governance issues in controlling urban development in the Bangkok Metropolitan Area. Paper presented at the International Workshop on Sustainable City Region, 24-25 February 2010, Tainan, Taiwan.
|
|
|
|
Rujopakarn W (2003). Bangkok transport system development: what went wrong? J. Eastern Asia Society for Transportation Stud. 5:3302-3315.
|
|
|
|
Salon D, Aligula EM (2012). Urban travel in Nairobi, Kenya: analysis, insights, and opportunities. J. Transport Geog. 22:65-76.
Crossref
|
|
|
|
Shen J, Wu F (2012). Restless urban landscapes in China: a case study of three projects in Shanghai. J. Urban Affairs 34:255-277.
Crossref
|
|
|
|
Shirgaokar M (2014). Employment centers and travel behavior: exploring the work commute of Mumbai's rapidly motorizing middle class. J. Transport Geog. 41:249-258.
Crossref
|
|
|
|
Shirgaokar M (2016). Expanding cities and vehicle use in India: Different impacts of built environment factors on scooter and car use in Mumbai. Urban Stud. 53:3296-3316.
Crossref
|
|
|
|
Sridhar K S (2010). Impact of land use regulations: Evidence from India's cities. Urban Stud. 47:1541-1569.
Crossref
|
|
|
|
Srinivasan S, Rogers P (2005). Travel behavior of low-income residents: studying two contrasting locations in the city of Chennai, India. J. Transport Geog. 13:265-274.
Crossref
|
|
|
|
Suzuki H, Cervero, R, Iuchi, K (2013). Transforming cities with transit. Transit and land-use integration for sustainable urban development. The World Bank: Washington D.C.
Crossref
|
|
|
|
Tanimowo NB (2006). Land use mix and intra-urban travel pattern in Ogbomoso, a Nigerian medium sized town. J. of Human Ecology 20:207-214.
|
|
|
|
Tiwari G (2002). Meeting the challenges of socio-economic diversity in cities, a case study of Delhi, India. Cities 19:95–103.
Crossref
|
|
|
|
Vichiensan V (2007). Dynamics of urban structure in Bangkok based on employment cluster and commuting pattern. J. of the Eastern Asia Society for Transportation Stud. 7:1559-1574.
|
|
|
|
Vilhelmson B (2007). The use of the car-mobility dependencies of urban everyday life. In Gärling and Steg (Eds.) Threats from car traffic to the quality of urban life. Elsevier: Oxford. pp. 145-164.
Crossref
|
|
|
|
Wang D, Chai T, Li F (2011). Built environment diversities and activity-travel behavior in Beijing, China. J. Transport Geog. 19:1173-1186.
Crossref
|
|
|
|
Yang J, Gakenheimer R (2007). Assessing the transportation consequences of land use transformation in urban China. Habitat Int. 31:345-353.
Crossref
|
|
|
|
Zegras PC, Gakenheimer R (2006). Driving forces in developing cities' transportation systems: Insights from selected cases. Massachusetts Institute of Technology: Cambridge.
|
|
|
|
Zegras PC (2010). Transport and land use in China. J. Transport Land Use 3:1-3.
Crossref
|