Full Length Research Paper

ABSTRACT
Urbanization is a landscape transformation process that is manifested by spatial expansion relative to human development. The present study aimed at the characterization of the spatio-temporal dynamics of Niamey city over the past 38 years (1975-2013) through a diachronic analysis of Lands at satellite images and application of landscape ecology principles. It sought to: (i) analyze the spatiotemporal pattern of land use land cover change of Niamey city and (ii) identify the driving forces for the land use land cover change in Niamey and their implications. Thirteen LULC classes were identified and grouped into three broad categories namely “Built-up area”, “Agricultural zone” and “Vegetation area”. The “Agricultural zone”, more specifically the class "Rain-fed farmland" represent the landscape matrix (over 37% of the landscape) throughout the period considered for the study. “Built-up area” dominated by “suburb quarter” experienced its lowest expansion rate during the interim period T2 (1989-1999).Analysis of the landscape spatial structure and configuration revealed that the landscape is fragmentation and highly heterogeneous. In general, urbanization in Niamey could be characterized by progressive densification and sprawl along communication lines.
Key words: Urban dynamics, landscape indices, remote sensing, Niamey, land use land cover.
INTRODUCTION
Cities are growing worldwide with the highest growth recorded in Asia and Africa (Seto et al., 2012). This urbanization process involves the conversion of natural and/or rural land into a man-made structure favorable to human population development (Bürgi et al., 2004). It is a major modernization process characterized by a spatial expansion and demographic growth triggered by the political and administrative characters, and the concentration of socio-economic activities in these inhabited areas (Liu et al., 2003).The growth of urban areas results in substantial impacts on ecosystem, ranging from socio-economic inequalities to biological (Clergeau et al., 2006) and environmental impacts (Alberti et al., 2003; Chen et al., 2011) at local and regional level. Indeed, urbanization involves landscape transformations; hence its importance in landscape ecology (Lambin et al., 2003; Wu and Hobbs, 2002).
In Niamey, a third world city which accommodates more than 39% of the Niger urban population, this modernization process is yet a degradation source of population living conditions (Motcho, 2004). In fact, since 1926, when it became the capital of Niger, Niamey has expanded as the result of the rapid population increase instigated by rural exodus and particularly the high birth rate of its population (Kessides, 2006; Maughan, 2012). However, the growth of this city and that of basic amenities provided by the government are desynchronized making the population’s living conditions of poor quality, especially in popular and suburb quarters. The urban plans and strategies to accommodate this phenomenon were not implemented adequately. Indeed since independence, the urban planning process relied on urban plans of 1964 and 1967, urban master plan schema of 1984 and the reference urban plan of Niamey which was approved in 2010. Most of them were not effective; as for the latter, it went out of date even before it could be implemented. Moreover, the Niger government depends on external funding for its cities development plans and lacks an adequate and effective urban land use plan (Issaka, 2012). This deficiency leads to an urban development characterized by an “anarchic” spatial organization and inadequate basic amenities.
The spatiotemporal analysis of the land use land cover dynamics is a valuable, cost-effective tool for city planners as it gives a better picture of the urban growth. It could serve as an alternative for third world countries in the conception of sustainable city plan in the future. Several researches have proved the importance of LULC changes analysis in African cities (Abebe, 2013; Attua and Fisher, 2011; Ifeka and Akinbobola, 2015) but no detailed and updated analysis of urban LULC change is available in Nigeria. This lack of basic information has greatly impacted on the implementation and success of several urban projects regarding sanitation, environ-mental management, risk evaluation and management in Niamey. Understanding the mechanism of urbanization and land use dynamics is important for urban planning to enable better control over sprawl and urban environ-mental management.
This study is undertaken through a systematic approach in order to understand the urbanization process of Niamey in its structural and functional complexity. Hypothesizing that the urban landscape of Niamey has undergone significant changes over the past four decades, this study aims to: (i) analyze the spatiotemporal pattern of land use land cover change of Niamey city from 1975 to 2013 (ii) identify the driving forces for the land use land cover change in Niamey and their implications.
This assessment of the urban landscape dynamics is based on methods and analysis tools such as remote sensing, GIS operations and landscape metrics proven worldwide in the identification of indicators for urban development and ecological monitoring (Chen et al., 2011; Li et al., 2013; Liu et al., 2010; Ramachandra et al., 2012). These indicators will constitute an important decision support tool for the city growth planning and rational management of urban resources (Matsushita et al., 2006).
MATERIALS AND METHODS
Study site
The study was conducted in the city of Niamey, the administrative and political capital of the Niger Republic. This city has a total land area of 3933 hectares and is located in the western Niger (13°20'-13°35'N and 2°00'-2°15'E). It experiences a semi-arid climate characterized by a short rainy season that is followed by an eight months dry season. The mean annual temperature is 30.8°C with a relative humidity averaging 42.54% (Direction Nationale de la Météorologie, 2010).
The hydrographic network of Niamey consists essentially of the River Niger which stretches for about 15 km through the city, the dry valley of Gounti-Yéna (a temporary stream) and several temporary ponds (Figure 1).

This river system is indeed the determinant factor of the heterogeneity of Niamey’s vegetation. Indeed, vegetation is characterized by the development of irrigated crops around the ponds and in the valleys of the river and that of Gounti-Yéna, the establishment of a green belt around the city, and roadside trees. Furthermore, aside domestic plantations, public green spaces such as public gardens and parks have been created by the municipality to improve the living conditions of the urban population.
Nevertheless, relict of the natural vegetation is represented by thickets of Combretaceae’s species on tropical ferruginous soil of plateaus and shrub-steppe on sandy terraces. This flora is composed of species such as Guiera senegalensis (J.F. Gmel.), Commiphora africana (A. Rich.) Engl., Combretum micranthum (G. Don.), Acacia macrostachya (Reichenb. ex DC.), Lannea acida (A. Rich.), Croton gratissimus (Burch.), Acacia ataxacantha (DC.), Combretum nigricans (Lepr. ex Guill. et Perr), Boscia senegalensis (Pers.) Lam. ex Poir., Boscia angustifolia A. Rich. On the plateaus; and Hyphaenethebaîca(L.) Mart., Bauhinia rufescens Lam., Annona senegalensis Pers., Combretum glutinosum Perr. ex DC., Faidherbia albida (Del.) Chev., on the sandy terraces of dry valleys (Mahamane et al., 2009).
Cosmopolitan in nature, Niamey’s population has increased from 218,366 inhabitants in 1975 to 1,011,277 inhabitants in 2012 (Institut National de la statistique, 2013). Its annual growth rate is 9.81% and has an overall density of 257 inhabitants/ha. Agriculture, residential husbandry and trade are the main activities of this population.
Satellite data acquisition and pre-processing
Remotely sensed imagery from Landsat MSS (Multi Spectral Scanner) (22-11-1975; spatial resolution = 57 m), Landsat TM/ETM+ (Thematic Mapper/Enhanced Thematic Mapper Plus) (20-11-1989/ 02-12-1999; spatial resolution = 30 m) and Lands at 8 OLI (Operational Land Imager) (30-11-2013; spatial resolution = 30 m) with a time step of 10 to 14 years were acquired from the Global Land Cover Facility (GLCF) and the U.S. Geological Survey (USGS) archives. These scenes (Path 193 Row 51) covering the entire study site were taken during the dry season when the biomass reflectance values are the lowest.
Image radiometric correction and atmospheric calibration were done by their provider. Nevertheless, additional pre-processing operations were used under the software ENVI 4.7 in order to correct and/or improve images geometrically and radiometrically. They were georeferencing operations (World Geodesic System WGS 84; projection system Universal Transverse Mercator UTM, Zone 31), visual improvement (smoothing, linear adjustment of 2% contrasts), resampling using the nearest neighbor algorithm (from 57 m to 30 m resolution for the MSS scene) (Schowengerdt, 2007) and image editing (false color composite) to better differentiate vegetation classes (Bonn and Rochon, 1992). These operations facilitated their reading, visual interpretation on the screen, and prepared for the ground controls.
Image classification and accuracy assessment
The mixed classification approach was applied on the four images for an analytical and/or selective extraction of information. Its objective is to discriminate the different thematic LULC classes of the study area.
Firstly, the unsupervised classification was implemented on images. At this stage, the Ascendant Hierarchical Classification method (AHC or Isodata) was used in order to group pixels of each scene in objective land cover classes based on their radiometric similarity (or reflectance value) (Barima, 2009). The resulting image was then a simplification of the spectral signature of the pixels, in that, it assigned the same value to pixels of the same class (Mas, 2000). Hence, without any a-priori knowledge of the terrain, 15 classes have been identified beforehand on the pre-processed images.
Secondly, to improve the classification and determine the land use classes, 30 control points were identified in each of the established Land Cover classes. The gathered information was then used to establish the training sites corresponding to objects recognized as representative of a class on the pre-processed image. The training sites represent the essential elements of the second classification phase. The supervised signature extraction with the maximum likelihood algorithm was employed to perform the classification of the satellite images. It used statistical training sites to calculate the probability of membership of each pixel to one of the classes (Bonn and Rochon, 1992).
Post-classification operations such as the application of a majority Kernel filter (window 3x3 pixels) to reduce the "salt and pepper" effect on the classified image, and the combination of some very close classes in connection with land use were applied.
Finally, in order to validate the classifications of the different images, a confusion matrix or contingency table was calculated. It was used to assess the quality of the classification with the Kappa coefficient (K) and statistics on errors of commission and omission for each identified class (Barima, 2009).
Spatiotemporal analysis of LULC change from 1975 to 2013
GIS operations (ArcGIS 9.3 ©) such as vectorization of classified images, extraction and layout of the portion corresponding to the limits of the study area were used to develop LULC maps corresponding to the four selected dates (1975, 1989, 1999 and 2013). Hence:LULC change detection was performed through a transition matrix. This cross-tabulation described the change status among LULC classes from a time T0 to T1 (Schlaepfer, 2002). The transformations in a given class are either against or in favor of another. On the diagonal are the proportions of classes that remained stable during the considered period. The resulting tabulations displayed quantitative data for the overall LULC change (1975-2013) and the intermediary changes (1975-1989; 1989-1999, 1999-2013). Besides the matrix, the annual average rate of spatial expansion (T) for “Built-up area” category was computed to determine its change rate.

Accordingly, S2 and S1 represent the total area covered by the three “Built-up area” classes (“Residential”, “Popular” and “Suburb” quarters) at time T2 and T1; t the number of years of evolution; ln the natural logarithm; and lne, the logarithm with base e equals to 2.71828.
Landscape structure analysis
Metrics are widely used in the study of a landscape composition and configuration (Bogaert and Mahamane, 2005; Lambin et al., 2003). They characterize and assess a landscape through the interrelationships between its structure, function and changes at the landscape level (Leitão et al., 2006). The landscape metrics selected in this study covered Patch Number (NP), Largest Patch Index (LPI), Contagion Index (CONTAG), Shannon Diversity Index (SHDI), and Shannon Evenness Index (SHEI). Fragstats software was used to compute these metrics at the landscape level and hence quantify changes landscape structural complexity of Niamey (McGarigal et al., 2002).
The number of patches (NP), a simple measurement of the landscape composition determines the degree of heterogeneity or fragmentation of that landscape. The more the number of patches, the more fragmented the landscape is.
The Largest Patch Index (LPI) is the proportion of the landscape area occupied by the largest patchi (max (i)). It was calculated as follows:

A is the total landscape area. The LPI values vary from 0 ≤ LPI ≤ 100. It is even close to zero when the patch area becomes smaller. Thus, the greater the LPI, the less the landscape will be fragmented (McGarigal et al., 2002).
The Shannon Diversity Index (SHDI) is commonly used in landscape ecology (Lampin, 2004; Shi et al., 2008; Wu et al., 2011) and was computed by the following formula:

With Pi the proportion of the landscape covered by a classi; N, the number of classes in the landscape. SHDI ≥ 0. SHDI is close to zero when the landscape is dominated by a single patch and increases with the number of different patch types and/or when the proportional distribution of area among patch types becomes more equitable.
The Shannon Evenness Index (SHEI) commonly known as Pielou index evaluates the distribution of patches per land use class in a landscape.

Its value ranges from 0 to 1. The more randomly distributed the patches are, the higher the index.
Contagion index provides information concerning the landscape texture through an assessment of the degree of aggregation and dispersion of patches (Leit?o et al., 2006). It was calculated as follows:

With Pi the proportion of the landscape occupied by class i; gik the number of adjacencies between pixels of classes i and k based on the double-count method; N the number of classes present in the landscape, including the landscape border if present. Its value ranges from 0 to 100 (0 <contagion ? 100). The contagion index is close to 0 when the patches are equidistant and disaggregated to the maximum; it is close to 100 when the landscape is composed of a single patch (McGarigal et al., 2002).
Land use land cover change driving forces analysis and implications
The increase in urban population has an impact on the urbanization pattern all over the world. Understanding how this increase relates to urban environment is therefore an asset in landscape planning. In this study, the Pearson correlation coefficient was used to determine the relationship between land use patterns and changes in the population size of Niamey. The correlation coefficient was calculated using the software R.
RESULTS
Land use land cover mapping

Image classification assessment determines its reliability (Chen and Stow, 2002). In this study the overall accuracy and the Kappa index ranging respectively from 90.58 to 94.33 % and 89 to 94% indicate a very good to excellent classification, according to Landis and Koch (1977). Nevertheless, LULC map of 1975 recorded the lowest values and the built-up classes had the highest level of commission and omission errors.
Thirteen LULC classes were identified for each date and grouped into three categories according to the associated activities and functions thereto: classes "Rain-fed farmland", "Irrigated farmland" and "Agroforestry park" constitute the "Agricultural zone" category; classes "Green belt", "Green space" and "Plateaus" up to the "Vegetation zone" category; and classes "Residential quarter", "Popular quarter", and "Suburb quarter" constitute the "Built-up areas" category.
The different quarters were differentiated based on their socio-economic and architecture characteristics. Thus, the "Residential quarter" represents areas with low population density living in large, high standing edifices (800 to 1200 m²). The "Popular quarters" are areas with high population density and where houses are small and made of clay/definite materials. As for the "Suburb quarter" or new neighborhoods, they represent the class with a relatively low population density and houses made of solid materials. The lot sizes vary between 200 and 400 m². The "Rain-fed farmland" are lands cultivated only during the rainy season while the "irrigated farmland" consist of vegetable croplands and gardens. The "Agroforestry Park" are equivalent to "Rain-fed farmland" but with a higher density of trees.
Other classes such as "River Niger", "Ponds", "Hydro-agricultural developments” and "Other structures" were also identified. The aim of this work being the study of the LULC dynamics, they have been excluded from the analysis because of their relatively stable character in terms of temporal variability.
Land use land cover dynamics
The analysis of the four LULC maps (1975, 1989, 1999 and 2013) reveals that "Rain-fed farmland" class is the landscape matrix. It covers more than 37% of the total area, during the entire study period (1975-2013) (Figure 2).
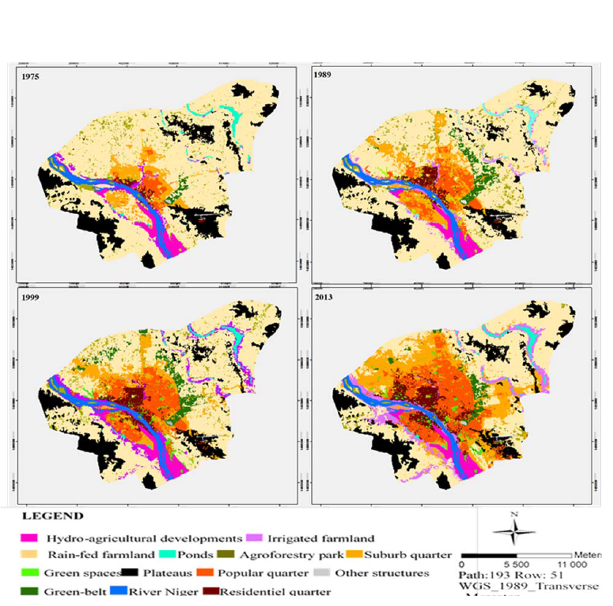
Figure 2. LULC maps of Niamey City from 1975-2013.
Figure 2 also displays two patterns of urban expansion: in a concentric manner and alongside roads development.
Land use land cover change analysis
The different LULC classes and categories identified in this study experienced several transformations characterized by changes in area (Figure 3),
.png)
Figure 3. LULC change in area from 1975-2013.
transition among land use classes (Tables 1 and 2), and spatial structure and configuration (Table 3). Thus: The “Built-up area” classes increase continuously over the 38 years period. They are characterized by 28.26% of net increase in area (from 9.49% of the total area in 1975 to 37.75% in 2013). This increase is due to the conversion from “Agricultural zone” and “Vegetation zone” categories. In fact, the “Built-up area” classes gained 27.10% of “Agricultural zone” and lost 0.22% of its area in favor to the later: a net gain of 26.88 %. “Built-up area” classes also recorded a net gain of 8.76% from “Vegetation zone” classes. It obtained 8.76 % of its area from the conversion of “Vegetation zone” category against 0.51 of it becoming “vegetation zone”. Furthermore, the overall annual expansion rate of these “Built-up area” category varies considerably with the lowest rate of 2.38% recorded in T2 (1989-1999) (Table 3). During this period, the "Suburb quarter" class is the most abundant. An internal change among “Built-up area” classes was recorded.


It consists of a mutation among quarters that is more important in the “suburb quarter” class. It becomes either "popular quarter" (3.44 %) or "residential quarter" (1.78 %).
With regard to the “Vegetation zone” classes, “Green space” demonstrates an increase in area over the study period. “Green-belt” class increases from 1975 to 1999 and decreases from 1999 to 2013 while “Plateaus” class shows the opposite trend. The increase in “Green space” resulted mostly from the conversion of “Built-up area” and “Rain-fed farmland” classes while the areal gains in “Green-belt” class are mainly caused by the conversion of “Rain-fed farmland” and “Agroforestry Park” classes. During the recent period, part of “Green-belt” classes is transformed into “Built-up” areas (1.22%) and “Rain-fed farmlands” (0.65%).The “Plateaus” class is converted into farmlands during T1 (1975-1989) and T2 (1989-1999), meanwhile during T3 (1999-2013); it gained area from “Rain-fed farmland” class.
The agricultural zone lost 28% of its total area to all other land use categories. Nevertheless, two evolutionary trends are observable in the area; namely an increase in the size of the class "Irrigated farmland" and a reduction of those of "Agroforestry Park" and "Rain-fed farmland" (Figure 3)The loss in “Rain-fed farmland”, “Agro forestry Park” and “Built-up” classes contributed to the increase of “irrigated farmland” class. As for the class "Rain-fed farmland" and “Agroforestry Park” classes, they lost respectively 34.96 and 69.44% of their area for all other land use classes. They are the main distributor in the area for the whole study period (Table 2).
Landscape structure analysis
The analysis of the landscape structural dynamics was done using the calculated indices at the landscape level (Table 3). Two trends are observed in the landscape composition: an increase in NP from 1975 to 1999 and a decrease from 1999 to 2013. This suggests an increasing fragmentation of landscape from 1975 to 1999 followed by an aggregation of patches in 2013.
Moreover, values obtained for Shannon Diversity and Evenness Indices increase throughout the study while that of the Largest Patch and Contagion indices decrease (Table 3). These suggest that the landscape patches vary in shape and become increasingly small, equidistant and disaggregated in the landscape.
Vectors of land use land cover change and implications
Urbanization is a phenomenon of demographic and spatial expansion. The assessment of the interrelationship between the population size, “Built-up area”, “Agricultural zone”, and “plantation zone” was carried out through Pearson correlation analysis; hence, strong correlations are identified between land use categories/classes and population (Table 4). Thus, a strong positive correlation of about 0.99 (P value = 0.005) is found between populations and “Built-up” areas while there is a strong negative correlation (R = -0.997 P = 0.0023) between population size and “Agricultural zone”. However, there is a strong positive correlation(R = 0.9762 (P= 0.024)) between “irrigated farmland” and populations.

DISCUSSION
DISCUSSION
The Kappa values above 81% obtained during the study showed that the mixed classification method is reliable and statistically acceptable (Landis and Koch, 1977). The lower resolution of the Landsat MSS sensor relative to that of TM, ETM+ and OLI sensors impacted on kappa and overall accuracy values recorded for the 1975 map. With regards to land use land cover classes, “Built-up” classes such as “Popular quarter" and "Residential quarter” were those with higher percentage of commission and omission errors as compared to other classes. Indeed, they were sometimes difficult to delineate although their typology is known, hence the high error percentage.
The city of Niamey is subject to urbanization like other Sahelian cities (Kessides, 2006). This phenomenon characterized by an increase in “Built-up” area at varying expansion rate is a response to the growing spatial demand by a burgeoning population and the annexation of outlying villages (Motcho, 2004; Institut National de la Statistique, 2013). Of the three periods of this study, namely T1 (1975-1989), T2 (1989-1999) and T3 (1999-2013), the period T2 recorded the lowest rate of built-up expansion. This could be explained by the new urban planning policy and the economic crisis of 1990/2000 (Urbaplan, 2009). Indeed, with the advent of multipartite democracy in the early 90s, Niamey has experienced a significant increase in the number of new lots. But the economic crisis at that time, in synergy with the non-servicing of lots has greatly limited the urban develop-ment. In addition, an urban policy for the reduction in lot size was adopted to reduce the impact of buildings on the horizontal space in order to meet the growing demand for housing by the burgeoning population and promote constructions in height. Thus, the reduction in the size of new lots by developers and the economic crisis have significantly impacted not only on the “suburb quarter” expansion rate between 1989 and 1999 but also the density of homes in “popular quarter” and “suburb quarters” (Issaka, 2013). Nevertheless, it should be noted that period T2 span is the shortest of the three periods and the northeast limit of the city, the green belt was achieved by 1989 (Urbaplan, 2009): these could have contributed to the reduction in the expansion rate between 1989 and 1999.
Two main growth modes could be defined from the dynamics of the Niamey urban landscape: (i) a concentric development around the historic town center and (ii) an extension along the roads. This corroborates the findings of Urbaplan (2009), suggesting that the city of Niamey is structured in five main radials of national and international importance and that the urban area is characterized by a concentration of houses and densification of the population in the quarters, especially popular ones. This sprawl contributes to geographical differences in wealth and quality of life among the “Residential”, “Popular”, and “Suburb” quarters and thus becomes a social segregation factor that accentuates the urban divides and reduce urban mobility (Ravalet, 2009). The growth mode of Niamey city is consistent with the theory of Dietzel et al. (2005) which states that urbanization process is generally performed by alternation between two phases: diffusion and coalescence. Diffusion is the expansion of urban areas from existing centers while coalescence is distinguished by the formation of new nuclei and filling in the gaps in existing spaces. This type of development is observable in many cities of the world (Deng et al., 2009).
Urban expansion leads to a change in the structure and function of the landscape (Park, 2013). The landscape indices analysis carried out in this study revealed that the landscape is highly fragmented and heterogeneous. Indeed, according to Shi et al. (2008), increase in diversity and Shannon evenness indices could be used as indicators of fragmentation and heterogeneity of an ecosystem under intense exploitation and reconstruction. The same indices have allowed Wu et al. (2011) to highlight increasing urbanization in Phoenix and Las Vegas cities (United States of America) with their con-sequent landscape fragmentation and patch distribution. In general, the observed fragmentation and heterogeneity of Niamey landscape patches are typical of urban ecosystem as suggested by many authors worldwide (Deng et al., 2009; Wu et al., 2011; Abebe, 2013; Ramachandra et al., 2012).
“Agroforestry Park” into “Built-up” areas. However, recurrent droughts and the urban firewood supply have also contributed to the reduction in “Agroforestry class” size. Even though urbanization has significantly reduced the agricultural lands, it has also favored the development of “irrigated farmland” as a response to the growing urban food demand (Andres, 2012); hence the significant positive correlation found between the increase in built-up areas and that of “irrigated farmlands”. As the urban population increases, many development programs have been implemented by government and its technical partners and even private initiatives in order to develop wetlands and irrigated farmlands for the reduction of food insecurity crises in Niamey city and its environs.
Another impact of the urbanization observed during this study is the depletion of the “Green belt” of Niamey. This “Green belt” originally designed to improve the living environment of the urban population and to protect the city against the dust, experienced strong reduction in its area over the last 13 years as a consequence of increase in “Built-up area” with no respect of laws and regulations. In fact, the increase in area of the “Green-belt” class observed during periods T1 and T2 is the expression of tree planting processes for the creation of the “Green belt” which started in1965 and ended in 1993. During the last period T3 (1999-2013), a depletion was observed. This could be attributed to uncontrolled urbanization, garbage dumps, excessive cutting of trees, illegal occupants. They contributed significantly to the “Green belt” depletion process observed in T3. Despite the existence of laws and regulations concerning the management of green areas in Niger, 14 lots occupying 603.71 ha (28%) of the original area of the green belt have emerged by 2010 (Comité interministériel, 2010).
Conclusion
Remote sensing and landscape metrics are adequate and reliable tools to understand the spatial and temporal changes of urban landscape. They contribute effectively in urban planning.
This study allowed one to characterize the landscape of the capital of Niger and assess the impacts of urbanization on the structure and evolution of the latter. Indeed, three main land use land cover categories were identified. The result shows that urbanization is the main driven force for Niamey landscape change pattern. It involves the increase in “Built-up area” alongside a conversion in cultivation system (“Irrigated farmland” become more privileged). The “built-up area” increases through a densification of the habitations and a sprawl along communication lines. “Rain-fed farmland” and “Agroforestry park” classes are the principal distributors in area.
This study gives a better picture of the urban growth in Niamey and is cost-effective. Niger is the poorest country of the world and relies greatly on partners and stakeholders for the conception and implementation of urban plans. The availability of updated and cost-effective data on urban development is an asset and an alternative towards the conception of sustainable city plan in the future. The findings of this study represent a valuable tool for city planners in that it is the basis for understanding the dynamics of Niamey city and the foundation for a sound decision making process. More studies are however needed in urban ecosystems of Niger in general and Niamey in particular in order to move towards a sustainable city and improve the population’s living conditions.
CONFLICT OF INTERESTS
The authors have not declared any conflict of interests.
ACKNOWLEDGMENTS
We thank Ms. Abigail Kuranchie (Ghana Forestry Commission) and all other people who have contributed to the development of this document. Our thanks also go to the SOMAIR Company that financed our activities.
REFERENCES
| Abebe GA (2013). Quantifying urban growth pattern in developing countries using remote sensing and spatial metrics: A case study in Kampala, Uganda. Master thesis. 108p. | ||||
|
Alberti M, Marzluff J, Shulenberger E, Bradley G, Ryan C, Zumbrunnen C(2003). Integrating humans into ecology: Opportunities and challenges for studying urban ecosystems. Biosc 53(12):1169-79. Crossref |
||||
| Andres L(2012). L'approvisionnement agricole de la ville de Niamey: potentialités et contraintes d'une agriculture de proximité. Phdstudent. Unité d'économie et développement rural au sein de l'ULg-Gembloux Agro Bio Tech. 21p. | ||||
|
Attua, EM, Fisher JB (2011) Historical and Future Land-Cover Change in a Municipality of Ghana. EarthInterac 15(9):1-26. DOI: 10.1175/2010EI304.1 Crossref |
||||
| Barima SS(2009). Dynamique, fragmentation et diversité végétale des paysages forestiers en milieux de transition forêt-savane dans le Département de Tanda (Côte d'Ivoire). Thèse de doctorat, Université Libre de Bruxelles. 196p. | ||||
| Bogaert J, Mahamane A (2005). Ecologie du paysage: cibler la configuration et l'échelle spatiale. AnSc Agro Bénin 7:39-68. | ||||
| Bonn F,Rochon G (1992), Précis de télédétection. Principes et méthodes. Sainte-Foy (Québec): Presses de l'Université du Québec. 485 p. | ||||
|
Bürgi M, Hersperger AM, Schneeberger N(2004). Driving forces of landscape change-current and new directions. Landscape Ecol 19:857–868. Crossref |
||||
| Chen D, Stow D (2002). The effect of training strategies on supervised classification at different spatial resolutions. Photogram Eng and Remote Sens 68:1155–1161. | ||||
|
Chen Y, Li X, Zhengb Y, Guanc Y, Liu X(2011). Estimating the relationship between urban forms and energy consumption: A case study in the Pearl River Delta, 2005-2008. Landscape Urban Plann 102:33-42. Crossref |
||||
|
Clergeau P, Croci S, Jokimaki J, Kaisanlahti-jokimaki ML, Dinetti M(2006).Avifauna homogenization by urbanization: Analysis at different European latitudes. Biolconserv 127:336-344. Crossref |
||||
| Comité interministériel (2010). Rapport sur l'état d'avancement des travaux du comité de suivi et de la mise en œuvre des recommandations du forum national sur la gestion durable de la ceinture verte de Niamey. 37p. | ||||
|
Deng JS, Wang K, Hong Y, Qi JG (2009). Spatio-temporal dynamics and evolution of land use change and landscape pattern in response to rapid urbanization. Landscape Urban Plann 92:187-198. Crossref |
||||
|
Dietzel C, Oguz H, Hemphill JJ, Clarke KC, Gazulis N (2005). Diffusion and coalescence of the Houston metropolitan area: Evidence supporting a new urban theory. Environ Plann 32(2):231–236 Crossref |
||||
| Direction Nationale de la Météorologie, 2010. République du Niger. | ||||
| Institut National de la Statistique, 2013. Recensement Général de la Population 2012. République du Niger, Niamey: INS-Niger. 10 p. | ||||
| Ifeka AC, Akinbobola A (2015).Land use/land cover change detection in some selected stations in Anambra State. J. Geo. Reg. Plann. 8(1):1-11. DOI: 10.5897/JGRP.2014.0468 | ||||
| Issaka H (2012). Evolution urbanistique de Niamey. Source SahelDimanche 27 juillet 2012 | ||||
| Issaka H(2013). La promotion immobilière informelle à Niamey: l'irrégularité comme réponse à la crise du logement. Urbanités:#2 : Crises en ville, villes en crise. 9p. | ||||
| Kessides C (2006). La transition urbaine en Afrique Subsaharienne. Impacts sur la croissance économiques et la réduction de la pauvreté. L'alliance des villes. 121pages. | ||||
| Lambin EF, Geist HJ,Lepers E (2003).Dynamics of land-use and land-cover change in tropical regions. Ann. Rev. Environ. Res. 28:205-41. doi: 10.1146/annurev.energy. 28.050302.105459. | ||||
| Lampin C(2004). Caractérisation par télédétection des zones de contact entre habitat et espaces naturels concernés par le risque incendie. Incidence de la résolution et de la taille des images. Mémoire de DEA, Université de Provence, France. 55p. | ||||
|
Landis JR, Koch GG (1977).The measurement of observer agreement for categorical data. Biometry 33:159-74. Crossref |
||||
| Leitão AB, Miller J, Ahern J,McGarigal K (2006). Measuring landscapes, A planner's handbook. Island Press. ISBN1-55963-899-0.245p. | ||||
|
Li C, Li J, Wu J (2013). Quantifying the speed, growth modes, and landscape pattern changes of urbanization: a hierarchical patch dynamics approach. Landscape Ecol. 28:1875–1888. DOI 10.1007/s10980-013-9933-6. Crossref |
||||
|
Liu X, Li Xia, Chen Y, Tan Z, Li S, Ai B(2010). A new landscape index for quantifying urban expansion using multi-temporal remotely sensed data. Landscape Ecol. 25:671-682. DOI 10.1007/s10980-010-9454-5 Crossref |
||||
|
Liu J, Daily GC, Ehrlich PR, Luck GW (2003). Effects of household dynamics on resource consumption and biodiversity. Nature 421. Crossref |
||||
| Mahamane A, Saadou M, BaïnaDanjimo M, Karim S, Bakasso Y, Diouf A, Boubé M, Inoussa MM, Idrissa S, Arzika T (2009). Biodiversite végétale au Niger: Etat des connaissances actuelles. Plants diversity in Niger: state of the presentstudies. Ann. Univ. Lomé (Togo), 2009, série Sciences, Tome XVIII: 81-93 | ||||
|
Mas JF (2000). Une revue des méthodes et des techniques de télédétection du changement. Can. J. Remote Sens 26:349-362. Crossref |
||||
|
Matsushita B, Xu M, Fukushima T (2006).Characterizing the changes in landscape structure in the lake Kasumigaura Basin, Japan using a high-quality GIS dataset. Landscape Urban Plann. 78:241-250. Crossref |
||||
|
Maughan N (2012). Quelles perspectives pour l'écologie urbaine au XXIe siècle: d'un champs de recherche basé sur les interfaces à une discipline scientifique autonome ? SHS Web of Conferences 3, 03001 (2012). J. Canton, Significance 8 (2): 53-56. DOI: 10.1051/shsconf/20120303001. Crossref |
||||
| McGarigal K, Cushman SA, Neel MC, Ene E(2002). FRAGSTATS: Spatial pattern analysis program for categorical maps www.umass.edu/landeco/research/fragstats.html | ||||
| Motcho H (2004). La réformecommunale de la communautéurbaine de Niamey (Niger) / Community restructuring within the Niamey urban area In: Rev.géo alp 92(1):111-124. doi : 10.3406/rga.2004.2283 | ||||
|
Park S (2013). Spatiotemporal landscape pattern change in response to future urbanization in Maricopa County, Arizona, USA. Landscape Res: 38(5):625-648. DOI: 10.1080/01426397.2012.684944 Crossref |
||||
| Ramachandra TV, Bharath HA, Sreekantha S (2012). Spatial Metrics based Landscape Structure and Dynamics Assessment for an emerging Indian Megalopolis. (IJARAI) 1(1):48-57. www.ijarai.thesai.org | ||||
| Ravalet E (2009). Ségrégation urbaine et mobilité quotidienne, une perspective internationale. Etude de cas à Niamey, Puebla, Lyon et Montréal. Thèse Université Lyon2. 443p. | ||||
| Schlaepfer R (2002). Analyse de la dynamique du paysage. Fiche d'enseignement 4.2, Laboratoire de Gestion des Ecosystèmes, Ecole Polytechnique de Lausanne, Suisse. 10p. | ||||
| Schowengerdt RA (2007). Remote sens: models and methods for image processing. Elsevier/Academic Press, Oxford. | ||||
|
Seto KC, Güneralp B,Hutyra LR (2012). Global forecasts of urban expansion to 2030 and direct impacts on biodiversity and carbon pools. PNAS 109 (40)16083-88. www.pnas.org/cgi/doi/10.1073/pnas.1211658109. Crossref |
||||
| Shi Y, Xiao J, Shen Y (2008).Landscape pattern change and associated environmental implications in Haihe river basin. China. The international archives of the photogrammetry. Remote Sens Spatial Info Sci. Vol. 37. Part B4. Beijing. | ||||
| Urbaplan (2009).Plan Urbain de Référence de Niamey et Programme directeur d'investissement. 0707-D-PUR. Final Niamey-1209.doc-90/01/2009-JG-nm. 225 p. | ||||
|
Wu JG, Jenerette D, Buyantuyev A, Redman CL (2011). Quantifying spatiotemporal patterns of urbanization: The case of the two fastest growing metropolitan regions in the United States. Ecol. Complexity 8:1–8. Crossref |
||||
|
Wu J, Hobbs R (2002). Key issues and research priorities in landscape ecology: an idiosyncratic synthesis. Landscape Ecol. 17:355–365 Crossref |
||||
Copyright © 2024 Author(s) retain the copyright of this article.
This article is published under the terms of the Creative Commons Attribution License 4.0


