Journal of
Oceanography and Marine Science

  • Abbreviation: J. Oceanogr. Mar. Sci.
  • Language: English
  • ISSN: 2141-2294
  • DOI: 10.5897/JOMS
  • Start Year: 2010
  • Published Articles: 62

Full Length Research Paper

Estimation of extremes in the southern Arabian Gulf

Thomaskutty Varghese
  • Thomaskutty Varghese
  • Department of Marine Geology, Mangalore University, India.
  • Google Scholar
Shailesh Nayak
  • Shailesh Nayak
  • Department of Marine Geology, Mangalore University, India.
  • Google Scholar
Gangadhara Bhat
  • Gangadhara Bhat
  • Department of Marine Geology, Mangalore University, India.
  • Google Scholar


  •  Received: 02 August 2016
  •  Accepted: 26 September 2016
  •  Published: 31 October 2016

 ABSTRACT

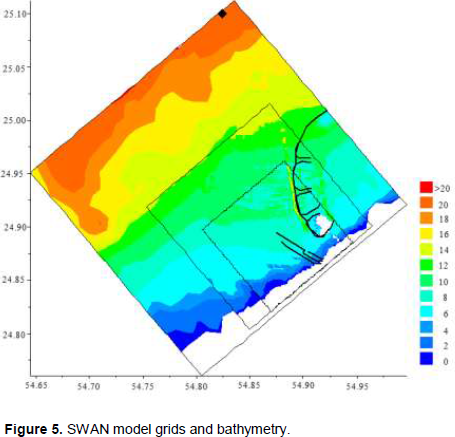
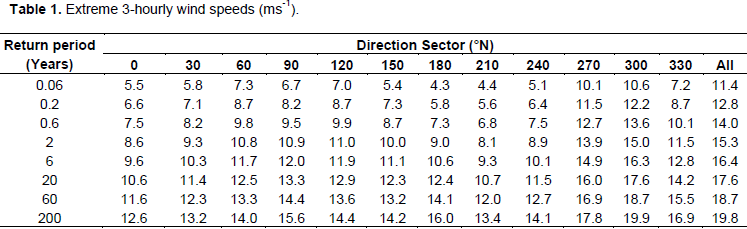
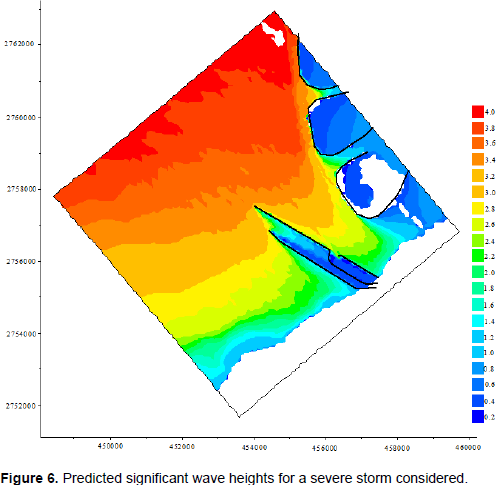
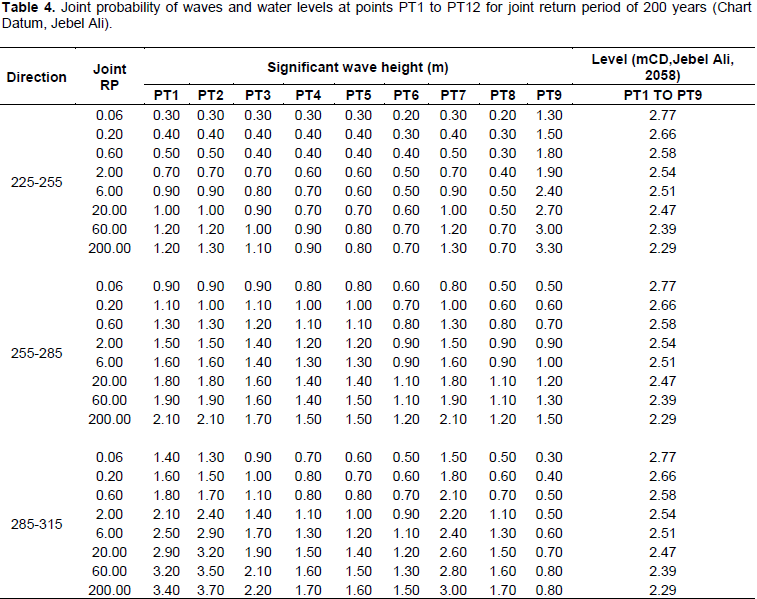
Extreme all-direction wave conditions and joint probabilities of high waves and high water levels are derived at selected locations in the southern Arabian Gulf. The wave conditions are obtained using the spectral wave model SWAN with wind and offshore wave information procured from ocean weather, supplemented with local water level records. Wave transformations from offshore to nearshore and waves generated by local wind conditions are derived using wind speed and direction, offshore wave height, peak period and direction and water level inputs to the SWAN model. The model predicted extreme 3-hourly wind speeds for return periods ranging from 0.06 – 200 years and the wave conditions for each storm. The study indicates that future sea level rise to 2058 gives 1:50, 1:100 and 1:250 return period water levels of 2.64, 2.71 and 2.79 mCD respectively at Jebel Ali.


Key words: Joint probability, extreme water levels, extreme waves, return period, wave modelling.


 INTRODUCTION

The knowledge of extreme water level is essential in many design and operational activities in the marine environment, for the safety of public and for design of coastal and marine engineering structures. Careful assessment of the probabilities of extreme sea levels employing good data and reliable analysis techniques is necessary for the design of all modern coastal infrastructure systems (Mendez et al., 2007). The coastal sea in the southern Gulf is presently undergoing significant modifications resulting from various developmental activities. The establishment of a power and desalination complex at the southern extend of Dubai Municipality and the waterfront developments immediately adjacent to its north necissitated studies on extreme sea level and wave climate on the southern Gulf. Though  the  power  and  desalination  plants  are   on   a relatively open coast at the southern Gulf, influence of the marine forcing functions is of importance in the context of their economic lifetime. Because these forcing functions are essentially random, appropriate statistical procedures need be developed for an accurate assessment.
 
Extreme water levels result from superposition of the extremes of tidal level, surge level and wave height. Heights of the highest waves encountered at sea vary widely. Information on freak ocean waves and extreme wave conditions is needed in the design of offshore structures and shipping activities (Draper, 1964, 1973). Efficacy of marine structures and their cost analysis require good estimates of the extreme water levels (Draper, 1970; Thom, 1971). Extreme water levels have always been a challenge to modellers and sailors. Li and Song (2005) presented a procedure to correlate  extreme wave heights and extreme water levels in coastal waters using numerical models together with joint probability analysis. They calibrated and validated their model with wind, wave and water level data from the coastal waters of Hong Kong. Using hourly values of sea level record for the years 2000 and 2005, Abdullah (2010) studied tide and sea level characteristics at Juaymah on the west coast of the Arabian Gulf. Predictive models on extreme sea level have also been validated at certain regions in the Indian Ocean (Kurup et al., 2007; Muraleedharan et al., 2012).
 
Extremely high or low water levels at coastal locations are an important public concern and a factor in coastal hazard assessment, navigational safety, coastal management and planning, and ecosystem management. This paper presents the results of an investigation on extreme water levels in the coastal environs of the southern Gulf. Computational wave modelling studies, together with a desk assessment of extreme water levels, are carried out to derive extreme wave and water level conditions. Scope of this paper is limited to the estimation of extreme water level and design wave conditions for the future developments at Jebel Ali.
 
Probabilistic approach on estimation of extremes recent studies
 
Accurate estimates of water level and its frequency are essential to coastal flood risk studies. Many research articles for example, Haigh et al. (2013), Irish et al. (2011) and Jain et al. (2010) has focused on water level variation and joint probability techniques to combine multiple parameters. There are big uncertainties with estimates pertaining to extreme values. When obtaining level estimates, the variances of the estimates can be obtained from the expected information matrix or from the observed information matrix. An alternative, and usually more accurate, method is the profile likelihood method (Coles, 2001), which is based on the deviance function and yields asymmetric confidence intervals. Other alternatives are based on bootstrap procedures with adjustments as suggested by Coles and Simiu (2003). According to a recent study on the coverage rate of confidence intervals of extreme value estimates based on various methods Weibull method turns out to produce the best confidence intervals from of the point of view of coverage rates. The peaks-over-threshold method approach on Weibull distribution is generally thought to be somewhat superior we shall not consider the r-largest method in this study (Coles, 2001).


 DATA AND METHODOLOGY

The area of study consists of the coastal waters in the southern Gulf. Figure 1 shows locations of the output points PT1- PT12 selected for  joint  probability  analysis.  Extreme  all-direction  wave conditions and joint probabilities of waves and water levels are investigated at these locations. Rashed Chowdhury et al. (2010) presented a perspective on extremes of sea-level variability and predictability for the U.S.-Affiliated Pacific Islands on seasonal time-scales. Based on the Generalized Extreme Value Model, they used the L-moments method to estimate the model parameters. In the present study, desk assessment of water levels is carried out using ocean weather model. This includes an assessment of future rise in sea level based on local records and archive data. The wind and wave hindcasts are made with basin-wide fine grids (7 km in lat. and long.), nested within coarser grid systems covering the Gulf of Oman and Arabian Sea. 2-D surge and currents are derived for storms with a grid spacing of 0.035° x 0.035°. The results are merged with the storm wave hindcasts. The wave model incorporates third-generation physics (OWI3G version 52, half friction). All the hindcast time series are available in either OWI's OSMOSIS format or ASCII.
 
 
Extreme sea levels
 
Ocean weather provides continuous time series of hourly wave and wind conditions for 20 years from 1983 to 2002. It also contains hourly data on 108 individual storms from 1960 to 2002 covering each storm for a period of 2 - 8 days. In the present study, relevant high sea level records are selected using ‘Peaks over Threshold criteria’, taking an average of about five per year from the 20 years’ time series data and an average of about two per year from the 42 years’ storm data. Weibull and Gumbel distributions are fitted to each of the two data sets and extrapolated to extreme values. As the storm data are selected by wind speed, some of the high sea levels in the time series data do not appear in the storm data, and so extreme values derived from the time series data shall be the higher of the two. However, four highest sea levels in the storm data occurred during an earlier period, and so one might expect extreme values for higher return periods to be higher than those derived from the time series data. The results (average of Weibull and Gumbel in each case) are summarised in Table 3. Return periods of 50 years and above based on storm data give slightly higher values.
 
Joint probability of high waves and high sea levels
 
Damage to marine structures is often associated strong waves with high tidal levels. The combination of extreme waves and high water levels results in increased coastal damages (Hawkes et al., 2010). The simultaneous occurrence of high waves and high water level is important in their combined effect on structures. Wave period can also be important in assessing run-up and overtopping, and so it is useful to have information on the joint distribution of wave height and period. These multivariate extremes are difficult to predict directly from observational data, as there may be only a few events among the observations. Fitting a joint probability distribution for variables that have a degree of correlation, such as waves and sea levels, is problematic. This makes the accurate estimation of design parameters difficult. Inaccurate estimations of the joint probability relationships are detrimental in the design of coastal and marine structures.
 
In the present study, the joint probability assessment is carried out following the procedures set out in Defra Environment Agency Guidelines (2005a, b). Visual assessment of wave heights against simultaneous sea levels from 42 years’ storm data shows only slight dependence between large waves and high sea levels (Figure 2). Figure 2 shows monthly mean sea levels, relative to the local land level, downloaded from the website of Permanent Service for Mean Sea Level, tide gauges in the Gulf with at least 15 years of data available are only considered. In Figure  2,  the  vertical  scale is in millimetres above an arbitrary datum for each gauge, chosen to separate the data series in the diagram. The trend lines indicate gradual increase in mean sea level, averaging about 2.5 mm/year since 1979 (slightly above the global average rate). The Intergovernmental Panel for Climate Change (IPCC, 2007) established an average global mean sea level rise of about 1.7±0.5 mm/year during the twentieth century and established a slightly higher rate during the period 1961 - 2003. Sultan et al. (1995) noted an upward trend in mean sea level of 2.1 mm/year during the 1980s in the central part Red Sea. Recent studies in southern Gulf, where more joint probability assessments have been carried out, show low levels of dependence between high waves and high sea levels (Sultan et al., 2003). This dependence, quantified as a correlation coefficient (ρ), has always been lesser than 0.4. Figure 3 illustrates the simultaneous occurrence of sea level and wave height within storm data.


The Simulating WAves Nearshore (SWAN) wave model
 
Shallow water transformations that the waves undergo during their propagation toward shore, together with the generation of local waves, contribute to the complete description of wave conditions in coastal seas. The wave model SWAN is used to study the wave transformation from the offshore to the nearshore site and the wave generation by local winds. SWAN (Simulating WAves Nearshore) is a 3rd Generation spectral wave model that computes random, short-crested, wind-generated waves in coastal regions and inland waters considering the processes of shoaling, refraction, breaking, reflection, diffraction and nonlinear wave-wave interactions. The offshore wave conditions are derived from ocean weather data and the nearshore wave conditions from the spectral wave model SWAN (2007).
 
In this study, a SWAN model is set up covering the area of study. Figure 4 shows the survey depths incoroporated in SWAN model and Figure 5 depicts the SWAN model grids and bathmetry. Lack bathymetric field data are supplemented with information from digital charts. The SWAN model covers an area of approximately 25 km by 25 km in the southern Gulf. It comprises of three nested grids with spatial grid sizes: 1000, 300 and 100 m, respectively. It includes the Dubai waterfront development area and the breakwater layouts. In the SWAN model, the waterfront development boundaries are assigned a reflection coefficient of 0.5 and the breakwaters are assigned a zero reflection coefficient. Standard JONSWAP spectral shape and Cos2(θ) directional spread are assumed for all SWAN model runs.


Wind and offshore wave conditions
 
The SWAN model is driven by wind and offshore wave data at 25.125°N, 54.8125°E (water depth: 19.25 m) supplied by ocean weather. This data is based on a computational model hindcast of wave conditions derived from input wind fields and have been calibrated extensively in the region. The storm data set is used to determine extreme wave conditions in the area of study. Continuous time series is employed to derive the nearshore directional extremes (for sectors other than the most severe), and the more frequently occurring extremes are selected. The wind speed and direction, offshore wave height, peak period and direction, and water level are used as inputs to the SWAN model. The storms also include the water level, which includes the surge and tide. Hence, the results took account of the tide, surge, wind conditions and offshore waves.


 RESULTS AND DISCUSSION

The study considered the joint probability based on peak over threshold combined with Weibul fit to study the extremes Jabel Ali. The joint probability of extreme waves and extreme water levels  is  derived  using  three- hourlyextreme wind speeds as input into the SWAN model. Table 1 gives the extreme 3-hourly wind speeds for return periods ranging from 0.06 – 200 years. Table 2 presents the extreme significant wave conditions at the output locations. Extreme high sea level predictions obtained in this study are given in Table 3. Figure 6 shows the predicted significant wave heights over the SWAN model for a severe storm (Offshore: Hs=4.4 m, Tp=9.8 s, Direction=304°N). Table 4 presents the joint probability of waves and water levels at points PT1- PT12 for a joint return period of 200 years in each of the five 30o direction sectors (225 - 255°, 255 - 285°, 285 - 315°, 315 - 345° and 345 - 015°).


Nearshore directional extreme waves
 
For most storms,the most severe offshore wave conditions occur in the direction sectors 285 - 315° and 315 - 345°. As explained above, using ‘peaks-over-threshold’ method, extreme wave conditions have been derived for a range of return periods. Non-linear shoaling and depth-limited breaking are obtained by extrapolating from the nearshore wave conditions (Goda, 1997). Extreme wave conditions are encountered when the storm approaches from the direction sectors considered. The peaks-over-threshold analysis for narrow direction sectors does not normally give reliable results. Hence, for the   directional   sector   extremes,   the  three-parameter Weibull method is used to derive the required return period significant wave heights from the nearshore wave climate. 3-h storm duration provides good agreement between the extremes derived for return periods of 1-2 years from climate data and the peaks-over-threshold method. The directional wave spectrum shows similarity to Shadrin’s spectrum (Shadrin, 1982).
 
With SWAN wave model, it is not necessary to run every condition of the offshore time series to generate nearshore wave climate. The offshore wave climate is analysed  and  100   wave   conditions   are   selected   to
 
represent the climate. SWAN is run with these input conditions and results extracted to provide look-up tables for the wave prediction points 1 to 12 at two water levels: +1.7 mCD (present day MHHW) and +2.8 mCD(1/200 year water level including sea level rise to 2058). The look-up tables are applied to time series to produce corresponding time series of nearshore wave conditions at the output points. The predicted nearshore annual wave climates (for present day MHHW water level) show that waves above 1.0 m occur at PT7 for approximately 7% of the time and waves above 2.0 m occur less than 0.1% of the time. Highest waves occur from the nearshore direction sectors centred on 300°N and 330ºN, and these are the dominant wave direction sectors. Highest predicted wave heights occur at PT2 and PT7. At these points the 200 year conditions are predicted to be Hs=3.8 m and Tp=10.9 s.
 
Locally generated wave conditions
 
The Dubai Waterfront Development provides a degree  of
shelter to the northern side of the breakwaters (PT 9- 12) while the southern side (PT 2- 6) are exposed to locally generated waves. The SWAN model runs predict locally generated wave conditions due to winds from the north and northeast (Table 1). The predicted locally generated significant wave heights, when combined on an energy basis with the transformed offshore waves, give the local wave climate. The nearshore wave climate and extremes are caused by shallow water modifications of offshore waves and interaction with locally generated waves. Local nearshore wave measurements are essential for a validation of the SWAN model.
 
Mean sea level rise in the southern Gulf
 
Sultan et al. (2003) examined monthly mean sea level variations in the Arabian Gulf over a period of 11 years (1980–1990) by spectral and regression analyses. The mean sea level is higher in summer and lower in winter with the range of 26 cm. About 80% of the monthly mean sea level variance is  related  to  seasonal  changes.  The annual component of the seasonal variation is 11.3 cm while that of the semi-annual is about 2.5 cm. The results of regression analysis show that atmospheric pressure changes can explain about 75% of the variance of the seasonal signal. The remaining 25% is due to seasonal changes in density. Regression of sea level on time reveals the presence of a rising trend of 2.3 cm over the 11-year study period. The present analysis of water levels indicates 1:50, 1:100 and 1:250 return period water levels of 2.64, 2.71 and 2.79 mCD Jebel Ali, respectively.


 CONCLUSIONS

An assessment of the joint occurrence of extreme sea levels and high wave heights with extreme wind in the southern Gulf has been carried out. Nearshore wave climate and extremes have been derived at selected points using a combination of the storms and continuous data transformation SWAN model. The SWAN model has also been used to derive locally generated wave (Wind Sea) conditions in Nearshore Sea. The results indicate combinations of water levels with return periods of 0.06, 2 and 200 years with extreme wave conditions having corresponding return periods of 200, 6 and 0.06 years, respectively. Future sea level rise to 2058 indicates 1:50, 1:100 and 1:250 return period water levels of 2.64, 2.71 and 2.79 mCD respectively at Jebel Ali. The Intergovernmental Panel for Climate Change estimated an average global mean sea level rise of about 1.7±0.5 mm/year during the 20th century and indicated slightly higher rates during the period 1961 - 2003. Sultan et al. (1995) also noted an upward trend of 2.1 mm/year in mean sea level during the 1980’s in the central part of the Red Sea. The present study strongly corroborates these suggestions of rising trends in mean sea levels. Estimated parameters especially the one year and 10 year water level are matching with the CO-OPS (NOAA Center for Operational Oceanographic Products and Services) estimate.


 CONFLICT OF INTERESTS

The authors have not declared any conflict of interests.


 REFERENCES

Abdullah MA (2010). Tide and sea level characteristics at Juaymah, west coast of the Arabian Gulf. King Abdul-Aziz Univ. Mar. Sci. 21:133-149.


Defra / Environment Agency (2005a). Joint probability, Dependence mapping and best practice. Technical Report FD2308/TR1.


Defra / Environment Agency (2005b). Use of joint probability methods in flood management. A guide to best practice. Technical Report FD2308/TR2.


Draper L (1964). Freak ocean waves. Oceanus. 10:13-15.


Draper L (1970). The Canadian wave climate study- the formative years. Proc. 12th Coast. Eng. Conf. ASCE. pp. 1-11.
Crossref


Draper L (1973). Extreme wave condition in British and adjacent waters. Proc. 13th Coast. Eng. Conf. ASCE. pp. 157-165.


Goda Y (1997). Random wave concept as the tool of engineering practice. Proc. 2nd Indian Nat. Conf. Har. Ocean Eng. 1:1-12.


Hawkes PJ, Gouldby BP, Tawn JA, Owen MW (2010). Joint probability of waves and water levels in coastal engineering design. J. Hydraulic Res. Special Issue Marit. Hydraulics. 40:241-251.


IPCC (2007). Report of Intergovernmental Panel on Climate Change, Working Group 1: The Physical Science Basis. 

View


Irish JL, Song YK, Chang K (2011). Probabilistic hurricane surge forecasting using parameterised surge response functions. Geophys. Res. Lett. 38:L03606.
Crossref


Kurup PG, Rao AD, Muraleedharan G, Mourani S (2007). Design and operational wave height statistics for extreme sea states. Proc. 4th Indian Nat. Conf. Har. Ocean. Eng. pp. 53-57.


Li CW, Song Y (2005). Correlation of extreme waves and water levels using a third-generation wave model and a 3D flow model. Ocean Eng. 33:635-653.
Crossref


Mendez FJ, Menendez M, Luce-o A, Losada IJ (2007). Analyzing monthly extreme sea levels with a time-dependent GEV model. J. Atmos. Oceanic Technol. 24:894-911.
Crossref


Muraleedharan G, Claudia L, Guedes SC, Unnikrishnan NN, Kurup PG (2012). Modeling significant wave height distributions with quantile functions for estimation of extreme wave heights. Ocean Eng. 54:119-131.
Crossref


Rashed Chowdhury Md, Pao-Shin C, Xin Z, Thomas AS, John JM (2010). Sea level extremes in the U.S.-Affiliated Pacific Islands—a coastal hazard scenario to aid in decision analyses. J. Coast Conserv. DOI 10.1007/s11852-010-0086-3.
Crossref


Shadrin IF (1982). Deformed wave spectrum in the coastal zone. Oceanology 22:694-696.


Sultan SAR, Ahmad F, El-Hassan A (1995). Seasonal variations of the sea level in the central part of the Red Sea. Estuarine. Coast. Shelf Sci. 40:1-8.
Crossref


Sultan SAR, Ahmad F, Elghribi NM, Al-Subhi AM (2003). An analysis of Arabian Gulf monthly mean sea level. Cont. Shelf Res. 15:11-12.


SWAN (2007). Delft University of Technology, Environmental Fluid Mechanics Section. Version 40.51 AB.


Thom HCS (1971). Asymptotic extreme value distributions of wave heights in the open ocean. J. Mar. Res. 29:19-27.


Haigh ID, Wijeratne EMS, MacPherson LR, Pattiaratchi CB, Mason MS, Crompton RP, George S (2013). Estimating present day extreme total water level exceedance probabilities around the coastline of Australia: tides, extra-tropical storm surges and mean sea level. Clim. Dyn. 42(1–2):121-138.


Jain I, Rao AD, Jitendra V, Dube SK (2010). Computation of expected total water levels along the east coast of India. J. Coast. Res. 26(4):681-687.
Crossref


Coles S (2001). An Introduction to the Statistical Modelling of Extreme Values. Springer Texts in Statistics, Springer- Verlag: London.
Crossref


Coles S, Simiu E (2003). Estimating uncertainty in the extreme value analysis of data generated by a hurricane simulation model. J. Eng. Mech. 129(11):1288-1294.
Crossref


          */?>