Full Length Research Paper

ABSTRACT
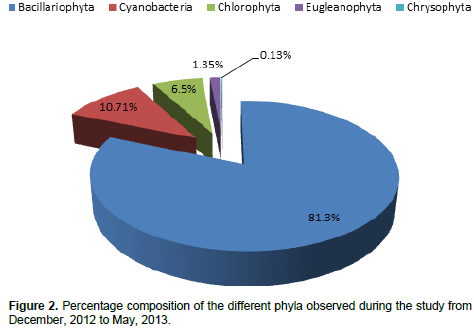
The effect of hydroclimatic conditions on phytoplankton was investigated in Ejirin, part of Epe lagoon, south-western Nigeria from December, 2012 to May, 2013. The data obtained for hydroclimatic features responded to rainfall pattern during the study period. The water remained acidic throughout the sampling period as pH value was ≤ 6.6 and salinity value ≤ 0.01%. The micronutrients varied throughout the sampling period and showed a correlation with rainfall. Chlorophyll a (Chl. a) concentration showed a correlation with conductivity, rainfall and surface water temperature, with a mean value of 0.021 mg L-1. Transparency, salinity, silicate and reactive phosphate showed a dominant effect on the phytoplankton community. The total number of phytoplankton species recorded during dry months differed significantly with that of the wet months (t* = 2.723, P > 0.05). A total of 105 species belonging to 5 divisions were recorded throughout the study period: Bacillariophyta (81.3%); Cyanobacteria (10.71%); Chlorophyta (6.5%), Eugleanophyta (1.35%) and Chrysophyta (0.13%). Diatoms were the dominant species in both the dry and wet months with 12 centric and 35 pennate forms. Phytoplankton density correlated significantly with silicate and TDS, indicating the possible effect of silicate on the diatoms and TDS on the whole community.
Key words: Cyanobacteria, phosphate, salinity, transparency.
INTRODUCTION
Good water quality depends largely on a number of hydroclimatic conditions (such as total dissolved solids (TDS), total suspended solids (TSS), pH, DO, conductivity, transparency, micronutrients, etc.) and the magnitude and sources of any pollution load. To effectively monitor the environment, assessment of these parameters is very essential. Water quality assessments of any region are important for the region’s development because of the importance of water for domestic, industrial and aquaculture activities.
Lagoons dominate the southwest region of Nigeria and as such are important aquatic ecosystems that have attracted so many scientific researches. Lagoons in this region are interconnected and run parallel to the coastline of the Gulf of Guinea over a distance of 237 km (Hill and Webb, 1958). Ejirin tributary drains into the Epe lagoon, which is one of the nine lagoons in the coastal area of south-western Nigeria. The coastal waters of south-western Nigeria constitute numerous ecological niches that support various biodiversity (Onyema and Nwankwo, 2006). The ecological characteristics operating in aquatic ecosystems of south-western Nigeria have been reported by many literatures (Hill and Webb, 1958; Olaniyan, 1969; Ezenwa, 1981; Nwankwo, 1984). Rainfall plays an important role in the tropics, diluting the ionic concentration of the coastal waters and breaking down horizontal environmental gradients. Precipitation introduces chelating agents, pollutants as well as increasing nutrients levels of the receiving water body.
The use of chlorophyll a to measure algal biomass and pollution status of aquatic environments has gained grounds worldwide (Lee, 1999; Suzuki et al., 2002). Composition and biomass of phytoplankton are very important parameters for understanding the structure and trophic level of aquatic ecosystems. The primary importance of phytoplankton in trophic relationships as autotrophs and their bio-indicator value have been assessed and reported in several literatures (Palmer, 1969; Vanlandingham, 1982; Dakashini and Soni, 1982). Onyema (2007) reported that phytoplankton satisfy conditions to be qualified as suitable indicators in that they are simple, capable of quantifying changes in water quality, applicable over large geographical areas and can also furnish data on background conditions and natural variability of aquatic ecosystems.
This study was conducted within the Ejirin tributary of Epe lagoon at the southwest region of Nigeria and aimed to assess the response of phytoplankton to hydroclimatic changes and to evaluate the dominant hydroclimatic factors.
MATERIALS AND METHODS
Study area
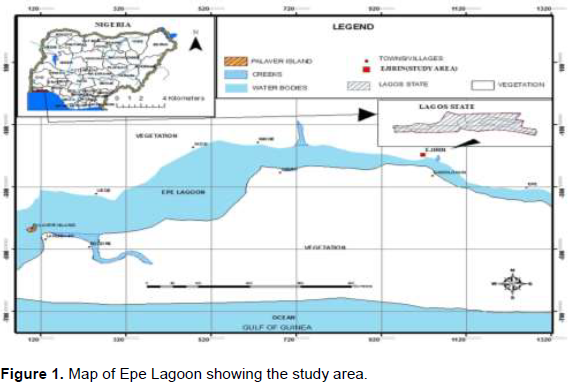
Ejirin is part of Epe lagoon found in south-western Nigeria located in Lat. 6° 89΄΄ N and Long. 3° 38΄΄E (Figure 1). Epe is a freshwater non-tidal lagoon. Epe lagoon is sandwiched between Lekki lagoon to the east and Lagos lagoon to the west. It experiences the same hydroclimatic conditions as the rest of south-western Nigeria which has two main seasons (wet and dry season). The littoral vegetation are dominantly Raphia plam and some dotted mangroves while the water surface is dominated by some floating macrophytes like water hyacinth (Eichhornia crassipes). The inhabitants of this region are mainly artisanal fishermen, sand miners and petty traders.
Sampling of hydroclimatic conditions
Water samples were collected on each trip from December, 2012 to May, 2013 between 9 am and 1 pm and stored in a 1000 ml well labeled screwed caped plastic bottles and transported to the laboratory in an ice chest. Four replicate samples were made on each trip for the following analysis, micronutrients, biological oxygen demand (BOD), chemical oxygen demand (COD) and chlorophyll a content. Surface water temperatures were measured in situ using a mercury-in-glass thermometer and recorded to the nearest 0.1°C. Transparency was determined using a 20 cm white painted secchi disc while pH was measured using a Graffin digital pH meter. Dissolved oxygen concentration was determined by unmodified Winkler method (Welch, 1948), conductivity was assessed using the meter, Philip PW9505 and chemical oxygen demand and biochemical oxygen demand values were determined using the method described in American Public Health Association (APHA) (2005). Nitrate-nitrogen, reactive phosphorus, sulphate and silicate were measured as described by APHA (2005).
Phytoplankton studies
The plankton haul was made using a 55 µm mesh size of net tied unto a motorized boat and towed for 5 min at a low speed (4 knots). Plankton sample was preserved immediately by fixing in 4% un-buffered formalin solution. The density of phytoplankton was determined using the sedimentation technique as described by Lund et al. (1958). One millimeter each of shakened sample was observed using a CHA and CHB binocular light microscope with a calibrated eye piece using the ×160 and ×640 fields. Phytoplankton species were identified using relevant texts (Smith, 1950; Vanlandingham, 1982; Whitford and Schmacher, 1973; Cushing, 1975; Biggs and Kilroy, 2002). The phytoplankton count was expressed as units per ml (filaments, colonies or single cells).
Statistical analysis
Statistical package for social sciences (SPSS) (version 18) was used to analyzed Pearson’s correlation relationship between phytoplankton density and hydroclimatic variables (temperature, conductivity, salinity, total monthly rainfall, total dissolved solids (TDS), total suspended solids (TSS), transparency, pH and micronutrients) and principal component analysis (PCA) which was used to assessed the phytoplankton respond to the environmental variables. Minitab 23 was used to analyse the dendrogram plot to evaluate the effect of environmental variables on phytoplankton density and PAST (version 3) was used to compute species diversity. T-test analysis was carried out to evaluate the statistical difference (P > 0.05) between seasonal (wet and dry) abundance of phytoplankton community. Standard deviation and mean analysis was also evaluated for the hydroclimatic values using Minitab 23.
RESULT
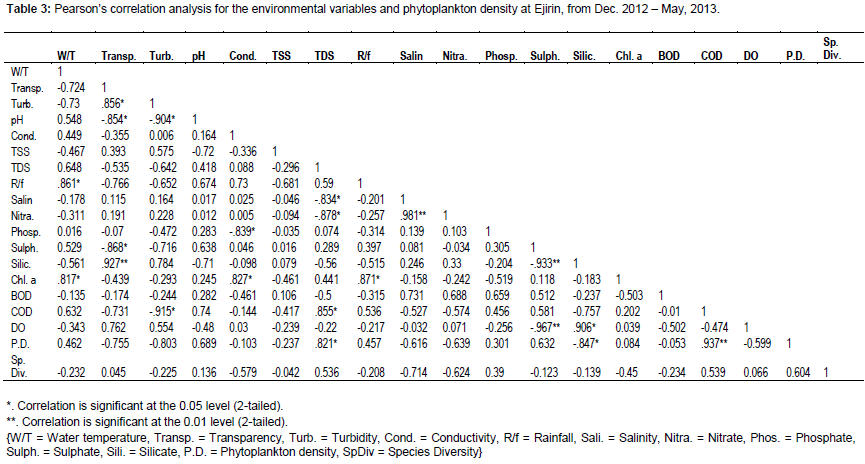
The data obtained for hydroclimatic features at the Ejirin tributary from December, 2012 to May, 2013 is presented in Table 1. Surface water temperature peaked 33.01oC in May and the lowest water surface temperature value of 28°C was recorded in January. The mean surface temperature recorded was 30oC. The surface water temperature showed a strong positive significant correlation with rainfall (0.855*; P > 0.05). The surface water pH was acidic throughout the sampling period with pH values ≤ 6.6 and a mean value of 6.39. pH showed a positive correlation with rainfall and phytoplankton abundance (0.650 and 0.689; P ≤ 0.05). Turbidity remained high during dry months and low during the wet months, with a mean value of 4.63 NTU. The turbidity readings in the dry months coincided with a periodic drop in total suspended solids (TSS) values. Conductivity peaked 0.192 µcm-1 in December with a mean value of 0.18 µscm-1. Total suspended solids (TSS) values were higher in the dry months than wet months while total dissolved solids (TDS) values were higher in the wet months than the dry months. The water remained fresh throughout the study period with salinity values ≤ 0.01‰.
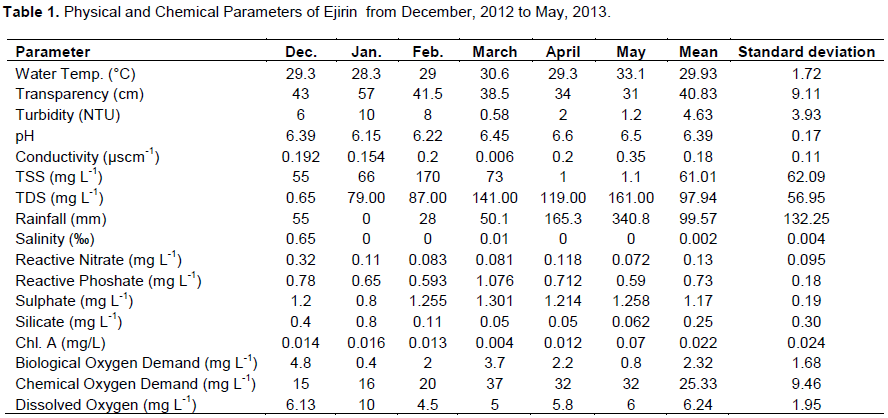
Reactive nitrate and reactive phosphate fluctuated throughout the study period but the values however remained NO3 ≥ 0.32 mg L-1 and PO4 ≥ 1.076 mg L-1, respectively. Reactive nitrate showed a strong significant negative correlation with TDS (-.878*; P ≤ 0.05) while reactive phosphate showed a strong positive correlation with salinity (0.917**; P ≤ 0.01). Silicate values peaked 0.8 mg L-1 in the dry months and dropped to 0.05 mg L-1 in the wet months. Chlorophyll a content peaked 0.07 mg L-1 in the wet months and dropped to 0.014 mg L-1 in the dry months, with a mean value of 0.0215 mg L-1. It showed a strong significant positive correlation with surface water temperature (0.817*; P ≤ 0.05), conductivity (0.827*, P ≤ 0.05) and rainfall (0.862**, P ≤ 0.01). Biochemical oxygen demand (BOD) and dissolved oxygen (DO) fluctuated greatly throughout the study Interval but remained BOD ≥ 4.8 mg L-1 and DO ≥ 10 mg L-1 respectively. BOD correlated positively with reactive nitrate (0.688, P ≤ 0.05), reactive phosphate (0.659, P ≤ 0.05) and sulphate (0.512, P ≤ 0.05). DO showed a positive correlation with turbidity (0.554, P ≤ 0.05) and a weak negative correlation with surface water temperature (-0.343, P ≤ 0.05). It also showed a significant negative correlation with sulphate (-0.967**, P ≤ 0.01) and strong positive correlation with silicate (.906*, P ≤ 0.05). Chemical Oxygen Demand (COD) value ranged between 15 mg L-1 (in December) and 37 mg L-1 (in March), with a mean value of 25.33 mg L-1. COD showed a positive correlation with surface water temperature (0.632, P ≤ 0.05), pH (0.740, P ≤ 0.05) and rainfall (0.587, P ≤ 0.05).
Phytoplankton community
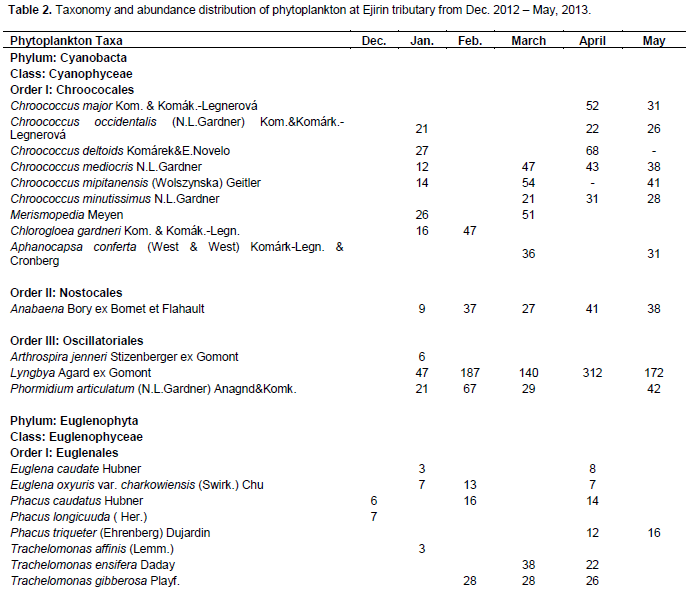
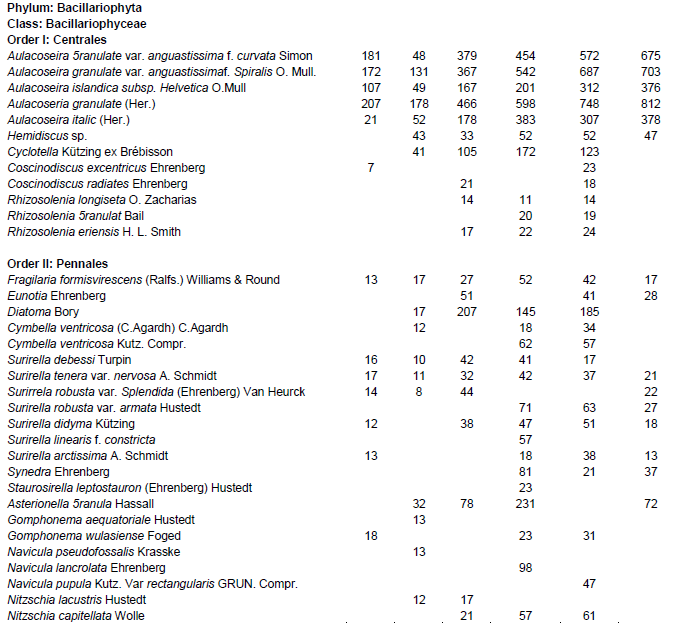
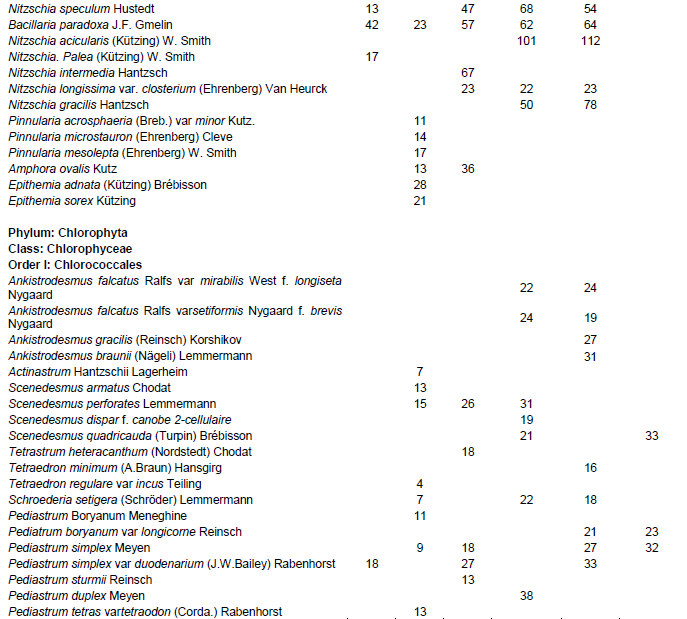
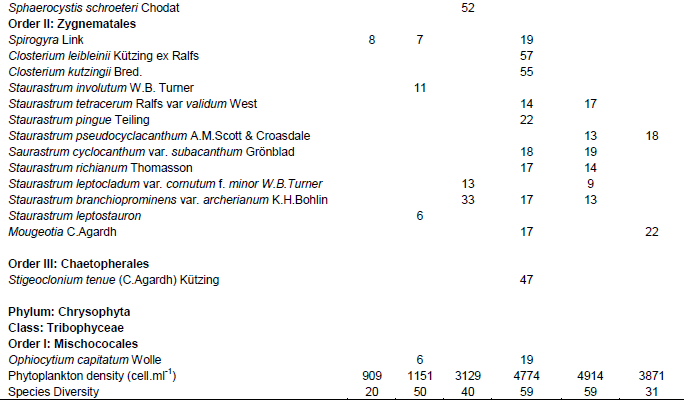
A checklist of phytoplankton species at the Ejirin tributary between December, 2012 and May, 2013 is presented in Table 2. A total of 105 species were recorded throughout the study period with a total number of taxa varying from 20 in December, 50 in January, 40 in February, 59 in March, 59 in April to 31 in May. Five divisions were recorded during the study including; Bacillariophyta (81.3%), Cyanobacteria (10.71%), Chlorophyta (6.5%), Euglenophyta (1.35%) and Chrysophyta (0.13%) (Figure 2). Diatom populations during both seasons were dominated by 12 centric diatoms and 35 pennate diatoms, with the highest number recorded in the wet months. Phytoplankton density showed a strong negative correlation with turbidity (-0.803, P ≤ 0.05) and reactive nitrate (-0.639, P ≤ 0.05), and a positive correlation with pH (0.689, P ≤ 0.05), rainfall (0.522, P ≤ 0.05) and sulphate (0.632, P ≤ 0.05). Phytoplankton density significantly correlated strongly with TDS (0.821*, P ≤ 0.05), COD (0.937**, P ≤ 0.01) and reactive silicate (-0.847*, P ≤ 0.05), and weakly correlate with chlorophyll a (0.084, P ≤ 0.05) as shown in Table 3. Species diversity was relatively high in the wet months than in the dry months. Species diversity showed a positive correlation with TDS (0.536, P ≤ 0.05) and salinity (0.492, P ≤ 0.05).
DISCUSSION
Hydroclimatic features
The surface water temperature reported from the study is notable for tropical waters (Inyang et al., 2015; Nwankwo, 1984). The higher water temperature in January could be as a result of time of collection and heat capacity of water. Throughout the study duration the water remained fresh indicating the absence of salt water. Salinity concentration of any water has an inverse relation with DO saturation. Base on this, the observed DO values were not influenced by salinity level rather by biological activities such as photosynthesis and bacterial respiration. The positive significant correlation between salinity and reactive phosphate showed that salinity level play an important role in the phosphate availability.
Rainfall is ecologically important for coastal waters of the tropic. Flood caused by precipitation enriches the coastal environmental gradients through horizontal and vertical dimension. Seasonality in the tropics influences hydrological factors. Thus seasonal patterns during the study influenced these parameters: transparency, total dissolved solids and total suspended solids increasing with the onset of rainfall. Conductivity level of an aquatic ecosystem is TDS dependent. Therefore, the positive correlation between rainfall and conductivity could be as a result of dissolution of conductivity increasing substance which affects the TDS. The sudden drop in TSS values during wet months could be due to the short resident time of the suspended particles in the water channel as it drained faster into the lagoon.
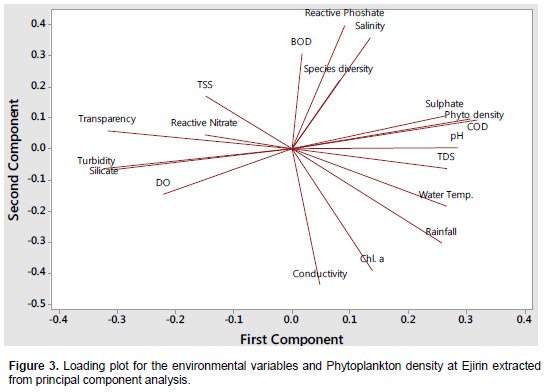
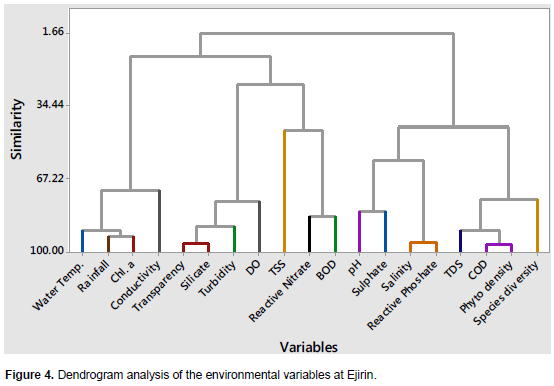
Water temperature, rainfall and chlorophyll a content controlled the conductivity level in the system (Figures 3 and 4). Phytoplankton activity which was measured by chlorophyll a showed a high controlling factor with conductivity more than with rainfall and water temperature. Because increase in CO2 dissolution encourages phytoplankton productivity and as well increases the conductivity level through formation of carbonate ionic system. Heavy rainfall recorded in May caused dilution of surface water and flood which may lower and increase the conductivity level, respectively. Agricultural runoff or sewage seepage from the catchment area could increase conductivity level due to the addition of chloride, phosphate and nitrate ions. Increased temperature increase the conductivity level through evaporation.
The micronutrients concentration increased as precipitation rate increased probably due to input from the wetlands. A strong significant correlation between phosphate and salinity indicates that the phosphate was not obtained from bacteria decomposition of organic matter and plankton excretion rather it was derived from precipitation and disassociation of phosphate-rich particles. On the other hand, reactive nitrate showed no significant correlation with salinity, indicating that part of nitrate were decomposition products of organic matter and plankton excretion. Odum (1959) related pH levels to the amount of carbonate present in the water and often considered it as indicator of the aquatic chemical environment. The observed pH value (pH ≤ 6.6) falls within the range reported by Nwankwo and Ankinsoji (1992), for Epe lagoon. The pH value could be controlled mainly by freshwater swamp exudates that regulate the acidity of the water body. The high value of dissolved oxygen observed in January could be as a result of combined photosynthetic activity of algae and wind mixing, whereas the low value may be attributed to a relatively high water temperature and microbial activity that used up the oxygen in the water column. Dissolved oxygen showed a significant positive correlation with silicate and transparency, indicating that silicate affects DO saturation indirectly through its direct effect on diatom productivity. Diatoms use silicate for it frustules growth and by photosynthesis, oxygen is produce.
Transparency is considered as an important parameter of trophic status of coastal waters. It depends on the intensity of sunlight, suspended soil particles, turbid water received from catchment area and density of plankton (Mishra and Saksena, 1991). Its low value during wet months could be as a result of inflow of turbid flood water from the catchment area. Positive correlation of transparency with DO indicated that transparency affects DO saturation directly. The lower the transparency value, the lower the DO saturation and vice versa. Low transparency means high TSS concentration, high water temperature, low light intensity and high bacterial activity. These effect combined may affect the DO saturation of the water.
According to Hynes (1960), BOD levels between 1 to 2 mg L-1 or less signifies clean water; 4 to 7 mg L-1 denotes slightly or moderately polluted water, and more than 8 mg L-1 denotes severe pollution. Therefore base on the above criteria, the site was relatively clean except for December and March where level of contamination were reported. The low content of Chl. A recorded in March could be as a result of low nutrient level while the high content recorded in May being the onset of wet season does not reflect the nutrient status but could be as result of input of photosynthetic organisms into the water by flood. Chl. A content showed a strong significant correlation with conductivity, water temperature and rainfall (r = 0.827*; r = 0.817* and r = 0.862*, respectively, P > 0.05). This could explain a strong relationship of rainfall with water chemistry of tropical aquatic ecosystem.
However the weak correlation of chlorophyll a content with the total number of phytoplankton may show that chlorophyll a content do not actually represent the number of phytoplankton density. This could be as a result of sampling technique adopted. Since the surface water sample was collected by simple scooping and thus contain a small fraction of phytoplankton. Its strong negative and positive correlation with turbidity and pH, respectively may explain the possible effect of these factors on phytoplankton community. The phytoplankton abundance in the wet months differed significantly with that of dry months (t* = 2.723; P > 0.05). This could be as a result of conditions during this period that favored the multiplication of algae and additional inputs of phytoplankton by the flood.
Biological characteristics
The algal spectrum observed showed a higher density in the wet months than in the dry months with diatoms as the dominant dominance species. This could be as a result of favorable conditions and perhaps addition of phytoplankton cells through flood. The abundance of pennate diatoms in the plankton community during the wet months suggests their dislodgement from the substratum probably during high water discharge. The presence of the following organisms could be used as an early signal for organically contaminated aquatic ecosystems: Chroococcus mediocris N. L. Gardner, Chroococcus mipitanesis (Wolszynska) Geitler, Chroococcus gardner Kom. & Komák.-Legn., Aphanoncapsa confert (West & West) Komárk-Legn. & Cronberg, Anabaena Bory ex Bornetet Flahault, Eugleana oxyuris var charkowiensis (Swirk.) Chu, Phacus caudatus (Hubner); Phacus longiscuda (Her.); Trachelomonas ensiferam Dady; Aulacoseria ranulate (Her.); Aulacoseria granulate var. anguastissima f. curvata (Simon), Melosira granulate var. anguatissima f. spiralis O. Mull, Fragilariformis visicense (Ralfs.) Williams & Round, Surirella debessi Turpin, Surirrela didyma Kützing, Surirrela arctissima A. Schmidt; Gomphonema wulasiense Foged, Navicula lancrolata Ehrenberg, Nitzschia speculum Hustedt, Nitzschiia palea (Kützing) W. Smith, Nitzschia gracilis Hantzsch, Schroederia setigera (Schröder) Lemmermann, Pediastrum simplex var. duodenarium (J.W.Bailey) Rabenhorst, Pediastrum duplexs Meyen; Spirogyra Link, Closterium kutzingii (Bred.), Closterium leibleinii Kützing ex Ralfs, Staurastrum pingue Teiling and Ophiocytium capitatum Wolle.
Therefore, phytoplankton community has shown significant respond to changes in hydroclimatic variables such as TDS, silicate, turbidity, pH, transparency and rainfall. This explains the effect of these variables on the phytoplankton. Transparency and TDS showed dominant role among the hydroclimatic variable measured.
CONFLICT OF INTERESTS
The authors have not declared any conflict of interests.
ACKNOWLEDGEMENT
My special thanks goes to the staff of phytoplanktology laboratory for their assistance and to Prof. Dike Nwankwo for his support academically throughout the research period.
REFERENCES
|
APHA (2005). Standard methods for the Examination of water (20th edition). American Public and Health Association, American Water. Works Association and Water Environment Federation (WEF). 127P. |
|
|
Biggs BJF, Kilroy C (2002). Stream Periphyton Monitoring manual. NIWA, Christchurch, New Zealand. pp. 132-204. |
|
|
Cushing DH (1975). Marine ecology and fisheries. Cambridge University Press, Cambridge 287 p. |
|
|
Dakashini KMM, Soni JK (1982). Diatom distribution and status of organic pollution in sewage drains. Hydrobiologia 87:205-209. |
|
|
Ezenwa BIO (1981). The study of the reproductive biology of the Catfish. Chrysichths nigrodigitatus (lacepede) in Nigeria Ph.D Thesis, University of Lagos, Nigeria 467 p. |
|
|
Hill MB, Webb JE (1958). The ecology of Lagos lagoon II. The topography and physical feastures of the Lagos harbor and Lagos lagoon. Philos. Trans. R. Soc. London 241:307-417. |
|
|
Hynes HBN (1960). The biology of polluted waters. Liverpool University Press, Liverpool pp.1-202. |
|
|
Inyang AI, Antai EE, Dan MU (2015). Bacterial Abundance – Chlorophyll a Concentration Relationship in Cross River Basin, Southeastern Nigeria: An Evaluation of Empirical Bacterial Abundance – Chlorophyll a Models Using a Multivariate Analysis. J. Water Resour. Ocean Sci. 6(4):72-85. |
|
|
Lee RE (1999). Phycology, Cambridge University Press, New York. P 614. |
|
|
Lund JWG, Kipling C, Le Cren ED (1958). The inverted microscope method of estimating algal numbers and the statistical basis of estimations by counting. Hydrobiologia 11:143-170. |
|
|
Mishra SR, Saksena DN (1991). Pollution ecology with reference to physic-chemical characteristics of Morar (Kalpi) river, Gwalior (M.P.). In: Current Trend in Limnology (Sastry NK, ed.), Narendra Publishing House, New Delhi. pp.159-184. |
|
|
Nwankwo DI (1984). Seasonal changes of phytoplankton of Lagos lagoon and the adjacent sea in relation to environmental factors, Ph.D. Thesis, University of Lagos P 447. |
|
|
Nwankwo DI, Akinsoji A (1992). Epiphyte community on water hyacinth Eichhornia crassipes (MART. SLOM) in coastal waters of southwestern Nigeria. Archive Hydrobiologia 124:501-511. |
|
|
Odum HT (1959). Trophic structure and productivity of Silver Springs, Florida. Ecol. Monography 27:55-112. |
|
|
Olaniyan CIO (1969). The seasonal variation in the hydrology and total plankton of the lagoon of South-west Nigeria. Nig. J. Sci. 3:101-119. |
|
|
Onyema IC (2007). Mudflat microalgae of a tropical bay in Lagos, Nigeria. Asia J. Microbiol. Biotechnol. Environ. Sci. 9:877-883. |
|
|
Onyema IC, Nwankwo DI (2006). The epipelic assemblage of a polluted estuarine creek in Lagos, Nigeria. Pollut. Res. 25:459-468. |
|
|
Palmer MC (1969). A composite rate of algae tolerating organic pollution. J. Phycol. 5:78-82. |
|
|
Smith GM (1950). The fresh-water algae of the United States. McGraw-Hill, London. P 719. |
|
|
Suzuki MS, Figueiredo RO, Castro SC, Silva CF, Pereira EA, Silva JA, Aragon GT (2002). Sand bar opening in a coastal lagoon (Iquipari) in the Northern region of Rio De Janeiro state: hydrological and hydrochemical changes. Braz. J. Biol. 62:51-62. |
|
|
Vanlandingham SL (1982). Guide to identification and environmental requirements and pollution tolerance of freshwater blue-green algae (cyanophyta). U.S. Environmental Protection Agency, EPA P 60. |
|
|
Welch PS (1948). Limnological methods. Blakiston, Philadelphia. 381 p. |
|
|
Whitford LA, Schmacher GH (1973). A manual of freshwater algae. Sparks press, Raeigh. P 324. |
|
Copyright © 2024 Author(s) retain the copyright of this article.
This article is published under the terms of the Creative Commons Attribution License 4.0


