The requirement that all Australian grain exports are insect-free relies on phosphine fumigation to control stored grain pests such as the lesser grain borer (Rhyzopertha dominica).The value of the current infrastructure in the grain storage, transport and handling network depends on the efficacy of phosphine fumigation. However, the biosecurity of the grain supply network is threatened by the emergence of Strong-Form Resistance (SFR) to phosphine in stored grain pests. SFR spreads from farm to farm through dispersion and by transport with grain through the supply network. The presence of SFR increases costs in the supply network as the number of fumigations per grain batch increases and the requirement to hold grain in sealed storage to achieve effective pest control increases. SFR in the short run increases costs of phosphine fumigation. In the long term it requires additional investment in sealed storage. This paper analyses the additional costs of SFR in the Western Australian Avon Region using three linked economic and bioeconomic models. Model 1 (farm to receival site) maximizes farmer’s profit of delivering wheat from farms to receival sites. Model 2 (recieval site to port) minimizes the Co-operative Bulk Handler’s (CBH) costs of transport, handling, storage and fumigation costs from receival sites to port. Model 3 (biosecurity – resistance spread) calculates the expected extra biosecurity cost of emerging SFR for the Avon wheat network. Our results show an increase in costs of between $8.8/t to $31.4/t of wheat depending on the rate of spread and the time horizon considered.
Australia’s $5 billion (DFAT, 2012) of grain export depends on the capacity of grain supply network to deliver grain free of stored grain pests to export grain terminals. A pest-free and insecticide free status adds value to the crop by allowing access to high price export markets. Since its introduction in the 1930s, phosphine fumigation has been relied upon to ensure that grain is pest free. Phosphine is cheap, residue-free, environmentally benign, and is effective against a wide range of insects in all grain crops (Chaudhry, 1997). Currently, about 80 % of grain stored in Australia is fumigated with phosphine (CSIRO, 2011). Therefore, the value to the grain industry of the continued use of Phosphine is substantial. For instance, at current costs of hosphine treatment relative to a methyl bromide or nitrogen alternative, the cost saving is about $15 million per annum in Australia.
Phosphine resistance was first reported in Bangladesh (Tyler et al., 1983), and later in India (Rajendran and Narasimhan, 1994). The exact mechanism of resistance in grain insects to phosphine remains unclear (Price, 1984; Nakakita and Kuroda 1986; Chaudhry and Price, 1989, 1990; Chaudhry, 1997). There are two types of resistance in stored grain pests: weak form and strong form resistance (SFR). For instance, resistance in the Lesser Grain Borer (Rhyzopertha dominica), the most ubiquitous and damaging grain pest, is controlled by two major genes that must both be present for SFR to be expressed. Weak resistance is expressed when only one of the genes is present (Collins, 2009).
In Australia, weak form resistance was first detected in New South Wales in lesser grain borer in 1990 (White and Lambkin, 1990) and SFR appeared in the same species in 1997 (Collins, 1998; Collins et al., 2002). In 2011, SFR in Tribolium castaneum was detected on two farms in the Western Australian (WA) wheat belt (Chami et al., 2011) and the outbreaks were eradicated.
Danger to the industry can stem from grain delivery to the cooperative bulk handling system of phosphine resistant strains of grain pests which may develop in farm storages through the use of phosphine in unsealed and poorly maintained sealed storages. (Emery et al., 2011). The spread can follow a number of paths. First, farm to farm spread and second, farm to receival site spread. A number of studies have observed the spatially and temporally patchy distributions of stored-product pests inside structures (Arbogast et al., 1998; Arbogast et al., 2000; Campbell et al., 2002; Nansen et al., 2004), and around the outside of storage structures (Campbell and Mullen, 2004). Stored-grain pests are often found outside grain storage and processing structures (Campbell and Arbogast, 2004; Campbell and Mullen, 2004; Doud and Phillips, 2000; Dowdy and McGaughey, 1994; Fields et al., 1993; Throne and Cline, 1989; 1991), with refuges in non-agricultural locations, sometimes at a distance from grain stores (Cogburn and Vick, 1981; Sinclair and Haddrell, 1985; Strong, 1970; Vick et al., 1987), which suggests the capability of these insects for long distance movement and flight.
Laboratory studies with R. dominica -for example- showed that flight initiation and dispersal of newly emerged beetles were stimulated by external and internal factors such as age, population density, starvation, food quality and nutritional level, temperature, and time of the day (Mahroof et al., 2010).
Ching’oma (2006) studied the spatial distribution of R. dominica in an agricultural mosaic of wheat and sorghum fields in central Kansas, US, during 2003 to 2004. Trap captures tended to increase at times in the year when beetles were active across the whole landscape. In the same study, Ching’oma found the average dispersal distance of recaptured beetles to be 380.4 ± 10.5 m a year (Ching’oma, 2006). In addition to farm to farm spread, insects can also be dispersed over long distances through grain transportation and storage.
This form of local and long range dispersion is characterised by a jump-diffusion process (Kot and Schaffer, 1986). Biological invasions of pest, such as grain pests, are driven by a stratified dispersal process, where the initial range expansion is through local diffusion. Then, as the range of the local population expands, new colonies created by long distance migrants increase in number to cause an accelerating range expansion. The spread of the pest through time depends on how and where short and long distance dispersers are produced and the rate of dispersion.
Strong Form Resistance (SFR) poses a threat to current methods of grain storage and could reduce the value of storage infrastructure that is designed to manage pests by phosphine fumigation. This is the case for the large number of unsealed stores found in Avon Region in Western Australia.
The objective of this paper is to calculate the extra cost incurred by the onset of strong phosphine resistance SFR across a wheat transport and storage network, the Western Australian Avon region, over a 20-year planning horizon. This paper is, to our knowledge, one of the first to consider an integrated transport, storage and biosecurity management system. Increasingly supply chains have to consider the management, not only of the physical transport of goods, but also the management of pests. This approach has been applied to area wide pests such as fruit fly (for instance, Florec et al., 2012), but not to pest management within a supply network where the pest habitat is provided by storage infrastructure and the way it is managed.
Study area - Avon region, Western Australia
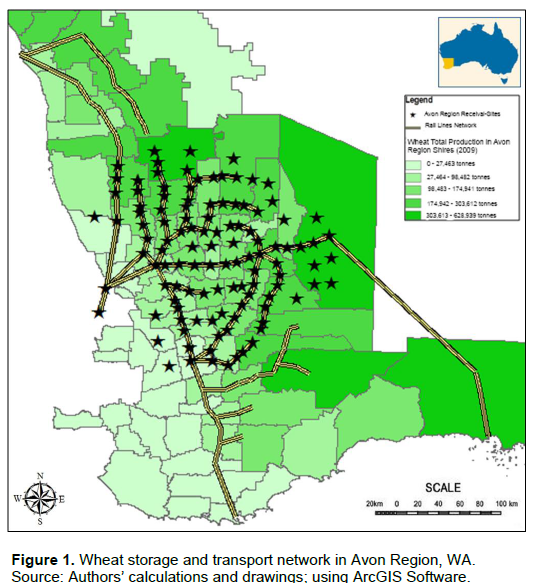
Kwinana port is WA’s primary grain export facility. It can store up to a million tonnes of grain; about a fifth of production in the Avon region (5 million tonnes of wheat in 2008-09) (CBH data, 2009). The Avon agricultural region has about 6700 commercial farmers delivering by road to 110 country receival sites. In turn, the grain is delivered by rail (76%) and road (24%) from recieval sites to port. Figure 1 gives a map of the Avon region showing wheat shires (38 shires), wheat receival sites, and rail lines. Nodes of the wheat supply network consist of farms and receival sites, connected by rail and road. When grain is delivered to receival sites/port, it is sampled, weighed and fumigated and stored for some time at some fees (CBH, 2014). Thus, movement of wheat through the network incurs costs of transport, handling, storage and fumigation against stored grain pests.
Stored grain pests depend on the storage quality provided by grain stores. Two activities are included in the model: the allocation of grain from farms to receival sites (Model 1; farm to receival sites) and the movement of grain from receival sites to port (Model 2; recieval sites to port). Stored grain pests thrive in the grain supply network (in transit) as it provides them with a virtually unlimited food. An effective fumigation requires that the phosphine gas be held in the infested structure long enough to kill the target pests. So, regular exposure to poor fumigation processes may cause stored grain pests to develop resistance (Alabama Cooperative Extension System, 2005) (Model 3; biosecurity model). Thus; grain in storage (under favorable weather conditions) is conducive to insect growth, and the amount of grain in storage is influenced by economic decisions that determine how much grain is allocated by farms to receival sites, how much grain is sent from receival sites to ports and how much grain is stored at farms or receival sites.
Three models are described in this paper; the first two are complementary mathematical programming models. Model 1 (farm to receival site) maximizes the farmers’ profit of delivering wheat to receival sites over three periods of time, and predicts the allocation of wheat from farms to receival sites. Model 2 (receival site to port) determines the minimum cost to the Co-operative Bulk Handler (CBH) of wheat transport, storage, handling and fumigation through the transport network between receival sites and Kwinana port. Model 3 (the biosecurity model) estimates the extra cost incurred by the whole system in case of spreading SFR in the Avon region. Model 3 runs recursively with Model 2; such that Model 3 simulates the spread of SFR and Model 2 estimates the additional incurred costs as a result of infestation with SFR of pests.
Assumptions of Models1and 2 are as follows:
(A1) Wheat supply at farm-level and wheat demand at port are assumed to be exogenous.
(A2) Due to the significant number of variables in the 2 models (1 and 2); Model 1 and 2 count only for a single year divided between three periods: harvest, storage and clearance. The harvest period extends from November to February and represents the peak period. The rest of the year represents the off-peak period and is divided between storage period (March to May) and clearance period (June to October).
(A3) It is assumed that wheat that flows through the system is homogenous. In reality, there exist multiple types and grades of wheat.
(A4) Transport, storage and biosecurity costs are all constant per unit; in other words, cost curves are linear and marginal costs are constant. Transport cost is higher during harvest than the other periods to reflect an increase in the demand for haulage.
(A5) The farms optimal transport and storage problem (Model 1) is separable across farms and can be determined by N separate farm optimization; where N is the number of grain farms in the region.
Model 1 farm to receival site
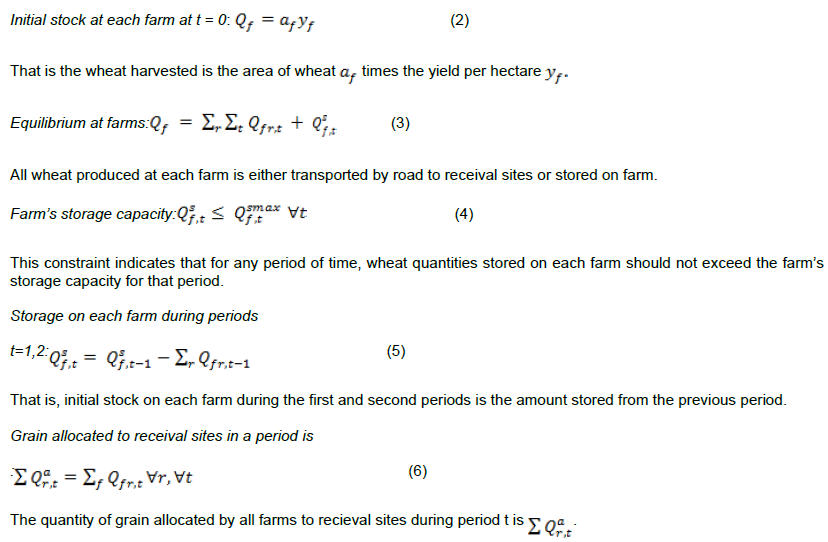
Model 1 represents the decisions of farmers to store or send wheat to a particular receival site by road. Wheat produced can either be stored temporarily on-farm, or transported by road to a nearby receival site either for storage or transport to port. Farms are assumed to only store wheat during the first two periods: the harvest and storage period, and to clear remaining stored wheat during the last period; the clearance period. This is to ensure that storage bins are empty and ready for new year harvest. This is given that storage capacity at farms can only receive 19% of the total harvest of wheat. The objective of the model is to maximise farmer’s profit by minimizing the total costs of transporting, storing, and fumigating wheat quantities. The model is used to predict the spatial distribution of grain through time at farm and at receival sites.
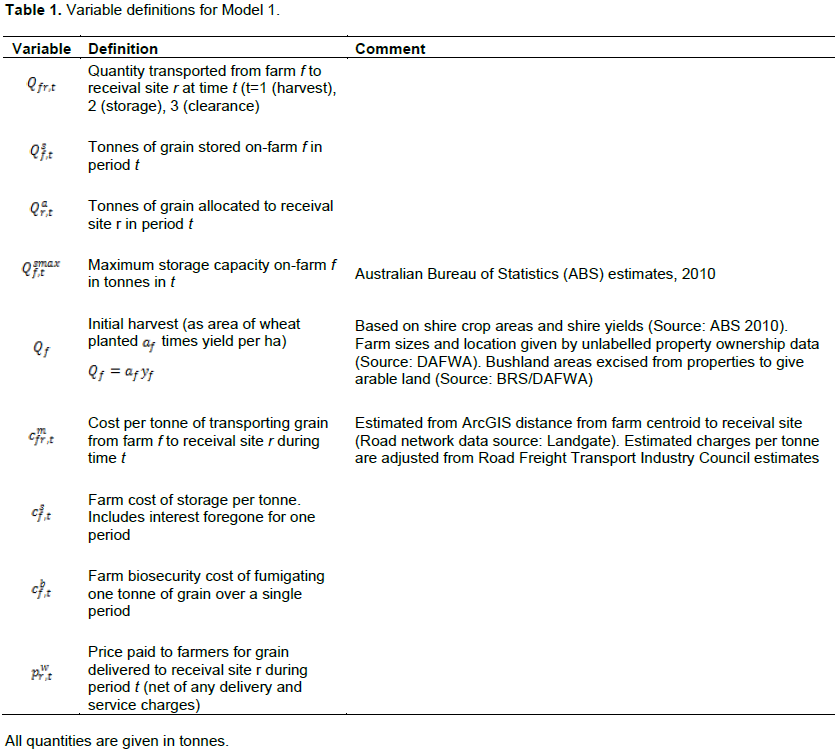
The model is constrained with farms’ storage capacity, road transportation cost, and storage and biosecurity costs. Wheat price received by farmers is assumed to increase by 10% from one period to the subsequent one to reflect the expected increase in prices (modified from the Australian Crop Report, 2007). Variables used in Model 1 are given in Table 1.
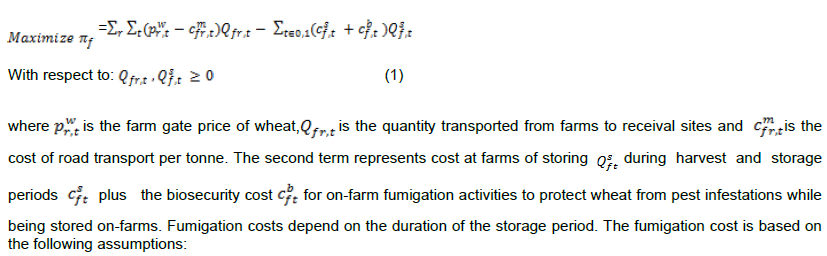
The farmer’s profit maximisation problem is:
1. Each receival site is divided into a number of storage bins: horizontal (shed-types sealed storages), bunkers (OBH) and silos (SIL).
2. For each storage bin type, there is an effective treatment to be used. Fumigation types used are Vaporphos (phosphine in vapour state), blankets (phosphine contained within a blanket form that is added over open bunkers), tablets (phosphine in tablet form) and cylinders (cylinders of phosphine).
3. The number of kilograms, blankets or cylinders of phosphine applied to each storage bin type according to the storage duration is multiplied by the unit cost (Personal communication with Ernestos Kostas of CBH).
The specific constraints for each farm are as follows:
Model 2 receival site to port
Wheat delivered from farms to receival sites represents the initial stock at receival sites and can either be stored temporarily at receival sites or moved immediately by rail/road to Kwinana port for further storage or export. The objective of the model is to minimise the Cooperative Bulk Handler’s (CBH) cost by finding the optimal combination of costs accompanied with wheat movement and storage starting at receival sites and ending at Kwinana port. The model does not allow storage during the clearance period at receival sites to ensure all wheat is delivered to Kwinana port by the end of the year.
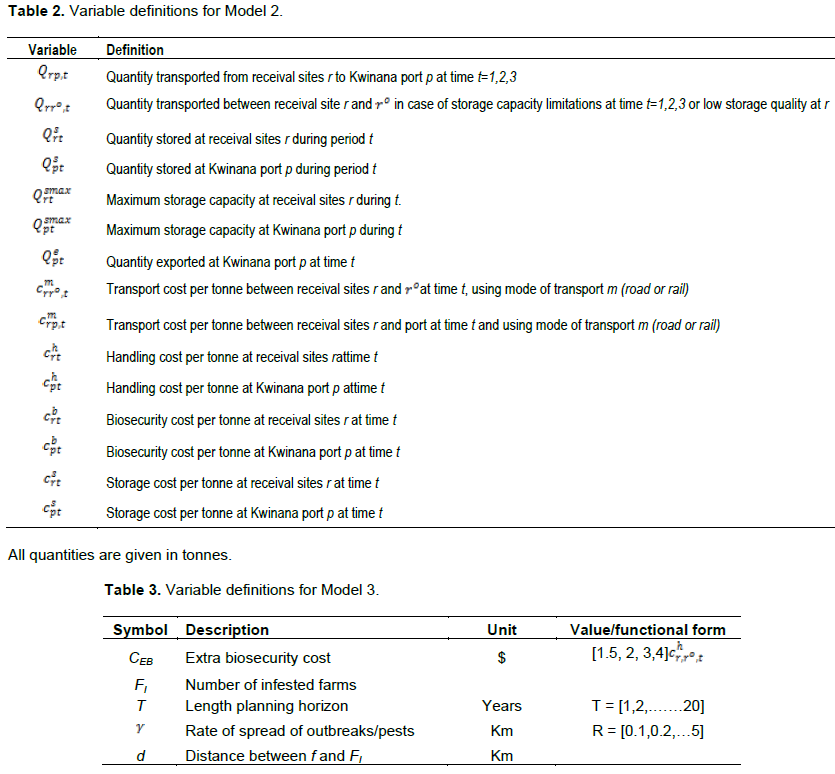
The model differentiates between types of wheat storage bins (Table 2) used at receival sites and port through various biosecurity costs and capacities. Table 3 gives the variables used in model 2.
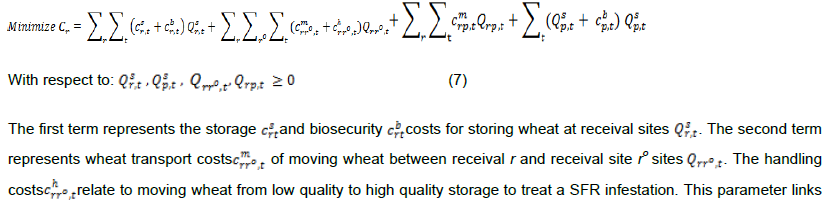
The quantities of wheat committed to transportation between receival sites and port, together with allocations to storage bins represent the decision variables in the system and constitute the cost minimisation problem. Accordingly, the grain handler’s cost minimisation problem is:
Model 2 to the biosecurity model; Model 3. The third term represents wheat transport and handling costs between receival sites and Kwinana port. The fourth term represents the storage and biosecurity costs of wheat stored at Kwinana port.
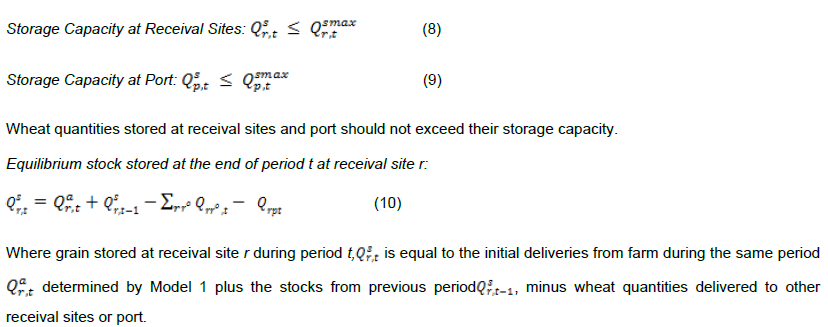
CBH costs are minimized subject to the following constraints:
In model 2, storage bins at recieval sites are subdivided as follows: Horizontal bins (HOR) with concrete half walls and steel roofing with a capacity from 10,000 t to 28,000 t; High capacity horizontal bins (HRC) from 60,000 t to 275,000 t; Unsealed open bunker (OBH) storage facility; circular storage (CIR) with either steel or concrete walls; and sealed vertical silos (SIL).In the analysis of biosecurity bins (Model 3), HOR, HRC, OBH and CIR are classified as low-quality bins (LQBs); while sealed silos (SIL) is classified as high-quality bins (HQBs).
Model 3 grain biosecurity
The grain biosecurity model predicts the incremental biosecurity cost incurred by the wheat supply network when a strong-form phosphine resistance SFR of stored grain pest emerges on a farm. The additional cost incurred by the network increases the biosecurity and handling costs , in Model 2. Model 3 accounts for the increase in the number of infested farms when outbreaks are able of spread across the wheat network by a jump-diffusion process. Notations and definitions for the biosecurity model are given in Table 3.
Outbreaks of SFR originate on farms with low-quality storage bins (LQBs) where phosphine applications do not eradicate all pests. Meanwhile, infested wheat is transported to receival sites which lead to the spread of infestation with SFR pests to CBH receival sites.
When wheat reaches the receival sites, it is sampled for pest’s detection. If the chosen sample represents the true quality, then wheat will be sent to the appropriate type of storage bins accordingly. However, if the sample does not represent the true quality, then some unrecognized infested wheat might be sent to low-quality bins (LQB). The fumigation at the LQB might kill WFR pests and leave a higher proportion of SFR to breed; which will increase the infestation level at the end. Knowing that the CBH depends heavily on LQB types as OBH and HOR (90%) (Personal communication with Ernestos Kostas from CBH) for storing wheat, can clarify the problem; the whole bulk amounts might be infested accordingly. Hence, an extra biosecurity cost (CEB) is incurred to unload wheat from LQBs to HQBs for further treatments and to ensure full eradication of pests.
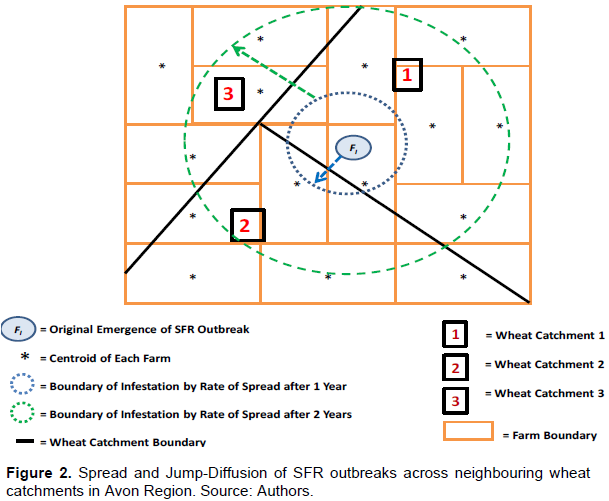
In addition to SFR pest spread from farm to receival sites, outbreaks spread to neighbouring farms and across the wheat network; resulting in more infested farms. We based our model on a dispersal rate of spread (Rt) mentioned in Ching’oma (2006) and supported by Shigesada et al. (1995). This process is illustrated in Figure 2.

Here, we assume simple Gaussian local dispersal on average across the grain network, and focus on the economics of contagion both locally and from farm to grain receival site. The innovation of this paper is that the biological process of pest spread has been integrated with the economics in a spatially explicit manner. This is the first time this has been achieved in the grain storage scientific literature, as far as we know. During the first year, a SFR outbreak at one farm (f) can change it to an infested farm (FI) which has the ability to infest the surrounding and neighbouring farms within a distance (d) determined by the rate of spread (y). This might result in increased numbers of infested farms (FI) and overlapping of the SFR outbreaks during the first year. In the second year, the original infested farm and the surrounding -newly- infested farms (FI) continue to spread their infested outbreaks to more neighbouring farms and this will continue during the 20-years’ time horizon of the model. On a continuous scale, the number of farms with SFR outbreaks increases which results in increased biosecurity cost (CEB).
The development of new SFR populations is assumed to follow a Poisson distribution. This reflects a key assumption that SFR populations develop independently at landscape scales, and depend only (for our study) on local population selection pressures due to repeated phosphine use at non-lethal dosage rates in LQBs (Ching’oma 2006). The stochastic realisation of SFR population outbreaks adds further uncertainty to the model outputs at time t=T.
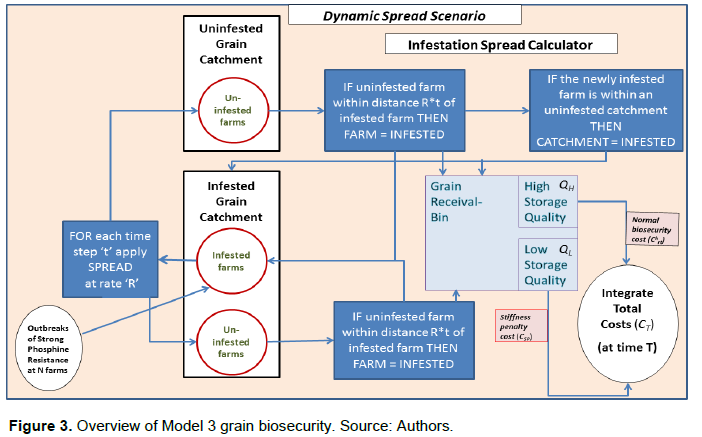
Outbreaks evolve stochastically (Figure 3). Infested receival sites apply costly biosecurity measures in a farm catchment declared to have a SFR infestation. The steps of solving the model are described in Appendix 1. The model runs for 1,000 times to average the effect of the random initial location of SFR outbreaks for each combination of parameter values. The biosecurity model is implemented in the R statistical software (R Foundation for Statistical Computing, 2011) with calls to the mathematical programming Models 1 and 2 to estimate costs and optimize them.
Shigesada et al. (1995) deliver the key result that, insofar, as a local diffusion process is most definitely stochastic, that is, the time of arrival or infestation at one point of the landscape differs from the time of arrival or infestation at another, although they may be the same distance from the source point, the diffusion process can still be characterised by a mean rate of spread. This goes back to results on Gaussian diffusion processes delivered by Skellam (1951), and this is the result we rely on in developing our model. As the rate of diffusion parameter has been explored across a range of scenarios, then scenarios where infestation likelihood is low have been included in the model.
Model parameters
Model 1 data
Avon region produces about 5 million tons of wheat and around 1 million ton of this quantity is stored (ABS, 2010). Quantities of wheat are delivered by road to receival sites or stored at some time on farms. ArcGIS routines are used to estimate the road distance between farms and receival sites, and wheat production per farm. There are around 6,700 wheat farms (with an area of more than 200 ha) in 38 shires within the Avon region. We have data from the WA land registry (Landgate) for 5,877 farms which were included in the model, including distances between farms and their designated receival sites, and each farm’s wheat production.
Costs in Model 1
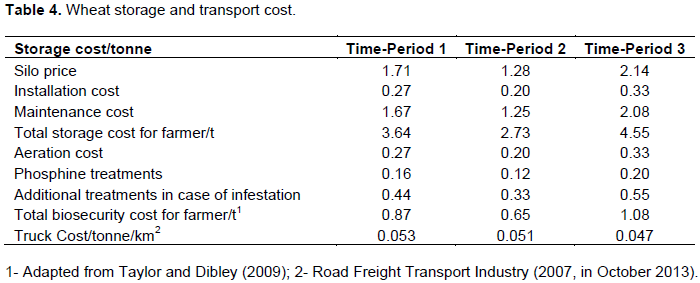
Storage costs are calculated based on a fixed cost for silos (over 25 years lifespan per unsealed silo), plus cost of unloading wheat into storage facilities and routine maintenance costs. Table 4 shows wheat storage cost and biosecurity cost and unit truck cost at farms for each period.
Maintenance cost includes cleaning, maintaining seals, etc. Additional treatments may include protectants, fungicides, or alternative fumigants.
On-farm biosecurity cost is a time-based cost that determines how much farmers to pay to protect wheat against pest infestation through aeration and fumigation. Table 4 gives biosecurity cost per ton. Farm transportation costs are costs associated with delivering wheat from farms to receival sites. The average distance (ranges between 600 m and 79 km) between each farm and the nearest receival site is then multiplied by the truck rate per unit distance before being multiplied by the number of tonnes transported.
Truck rates are higher during the harvest than the storage and clearance periods respectively; to reflect the truck congestion at receival sites. The truck rates during the harvest period also reflect the increased waiting times at receival sites, which increases truck turnaround time and increases demand for trucks.
Unit truck cost data in Table 4 is based on freight guideline rates for a 42.5 tonne prime mover with one trailer commonly used by farmers to deliver grain to receival sites, adjusted for different periods (Road Freight Transport Industry, 2007, October 2013).
Wheat price is the payment by CBH to farmers. The assumption used in the model is that the expected price increases from $220 (which is the status quo price per tonne of wheat for the year 2008 - 09) by 10% from one period to the following period.
Model 2 data
There are 26 receival sites on road and 85 receival sites on rail. Receival sites on road need to deliver wheat by road lines to other receival sites or to port. However, receival sites on rail can deliver wheat by rail or road lines to other receival sites or port. Calculations of road-transport cost have been identified earlier; while rail-transport cost has been modified from CBH data (Personal communication with Ernestos Kostas from CBH). Storage at receival sites takes place during harvest and continues until the end of the storage period. During the clearance period, all wheat is cleared from all receival sites and is delivered to Kwinana port either to be exported or stored until next year.
Time-based storage charges at receival sites -paid by CBH- are presented in the model to account for the use of storage facilities, standard grain segregation and stack management and standard grain protection; including fumigations during storage.
Storage cost at Kwinana port is included in the model for the three periods and for all storage facilities. It is assumed that wheat storage cost at receival sites and at port are the same for each time period (Personal communication with Ernestos Kostas from CBH). The gradual increase in storage cost between periods is justified by the longer duration of the third (for 3 periods; whole year), second (for 2 periods; 1 and 2) and first (for period 1 only) periods respectively. The Unit Storage Cost at Receival Sites and Port is assumed to be $1.3, $3.9 and $8.6 during T1, T2 and T3 respectively.
Biosecurity cost is the cost of protecting wheat quality against pests’ infestation by using fumigations. Different biosecurity costs are incurred at various receival sites and at different storage bin types during the three periods. The fumigation costs are based on the following assumptions:
Each receival site is divided into a number of storage bins: horizontal (HOR), bunkers (OBH) and silos (SIL). For each storage bin type, there is an effective treatment to be used. Fumigation types used are Vaporphos (phosphine in vapour state), blankets (phosphine blankets are placed on the bunker and then covered with a tarp), tablets (phosphine in tablet form) and cylinders (cylinders of phosphine).
The number of kilograms, blankets or cylinders of Phosphine applied to each storage bin type is multiplied by the unit cost of the formulation type (Personal communication, Ernestos Kostas of CBH).
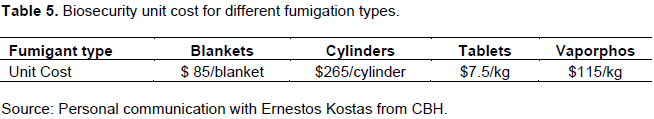
Biosecurity cost at port is included in the model for the three periods. The model differentiates between types of storage facilities in terms of biosecurity costs. The same steps are used to calculate fumigation costs by bin type at port and for the three periods. Table 5 gives unit costs for fumigation types at receival sites and port. The storage bin requires the same amount of fumigation regardless volume proportion occupied by grain. For example; according to the SIROFLO®label, effective fumigation of grain needs 1.5 tablets per cubic metre of total storage capacity (The State of Queensland, 2010).

The cost of loading and unloading wheat at receival sites and port is estimated at $3.2 per tonne across different receival sites and port for the three periods (Personal communication, Ernestos Kostas of CBH). Transportation cost at receival sites represent road and rail costs associated with transporting wheat between receival sites. The transportation cost is a distance-based cost. Most of the receival sites are found to be located within a distance range of 200 to 300 km from Kwinana port. The model differentiates between receival sites on road and on rail. Movement between receival sites on road and rail is allowed in the model. Hence, as it is cheaper to use rail transport, receival sites located on rail lines use rail transport, while receival sites away from rail lines use road transport. This means that around three quarters of wheat is delivered by rail and only limited quantity is delivered by road.
Port transportation cost is the cost of transporting wheat from various receival sites on rail/road to Kwinana port during all periods. The minimum, maximum and average transport cost between receival sites and port is around $2.42, $30 and $17.86 per tonne per kilometre respectively (Personal communication, Ernestos Kostas of CBH).
Model 3 data
Model 3 static: The key parameters of Model 3 are the number of phosphine resistant outbreaks and the stiffness penalty multiplier. First, the number of outbreaks ranges between 0 - 1,500 in a simple sensitivity analysis; with the maximum of 1,500 representing around 22% of the total number of farms within the Avon region. This assumption means that for every 4 or 5 farms, one farm is infested by an outbreak. Hence, this ensures the cost of maintaining biosecurity reaches a maximum at the regional scale, with all farm catchments containing at least one farm with a resistant outbreak. Farms were randomly sampled with equal weighting.
Second, the stiffness penalty cost multipliers range has been chosen to be between 1.5 to 4 times the current handling costs for the grain network model. The multiplier accounts for extra handling cost if infested wheat is to be moved from unsealed to sealed bins for extra or better treatment. The extra handling costs are calculated for a combination of each penalty cost and outbreaks’ number (over a fine grid). The model is static and runs for a single period of one year.Model 3 dynamic: The parameters of the model that are directly manipulated in the dynamic model are the number of initial outbreaks (chosen randomly by R), stiffness penalty cost multipliers and rate of spread. The timeframe over which the simulations are run is fixed at t=T years, though within the model, costs at each yearly time step are tracked. The range of values assigned to each control parameter was:
1) Initial number of outbreaks: Ranges between 0 - 200 outbreaks chosen randomly by R. The maximum of 200 is less than the maximum of 1,500 for the static model, and reflects the number of outbreaks required to achieve full cost saturation when the spread of outbreaks is included.
2) Stiffness penalty cost multipliers: multipliers of current grain handling costs; ranging between 1.5 – 4 multiples of the normal handling cost; and in steps of 0.5.
3) Rate of spread (ros): Ranges between 0.1 - 5 km by step size = 0.1 (as adjusted from Ching’oma, 2006).
The model runs for 1,000 times to average the effect of the random initial location of phosphine resistant outbreaks for each combination of parameter values. The spatial spread model is implemented in the R statistical software (R Foundation for Statistical Computing, 2011). The model first defines which farms are adjacent to each other. An un-infested farm is counted as being infested by a phosphine resistant pest population whenever the centroid of an un-infested farm falls within a distance of ros (rate of spread) multiplied by t of an initial outbreak epicentre. The receival point to which an infested farm sends grain is known in advance, based on the shortest distance path between farm and receival site. Thus; receival sites that receive phosphine resistant populations are also readily identified at each time step. The R code rewrites the GAMS input file by updating the parameters of the model, and the identification of which grain catchments (that is, receival sites) are of phosphine-resistance status. When the model is simulated, the GAMS model runs through a system call from within R to compute the costs associated with the current configuration of infested farms and grain catchments. These costs are then integrated over the whole grain catchment.
Model 1 results
Model 1 runs for all farms and its results show that it is optimal for farmers to store wheat for some time rather than transport it directly to receival sites after harvest. Two reasons support the farmer’s action. First, it is cheaper for farmers to store wheat at their farms for the first two periods and to incur biosecurity costs on-farm than to transport it directly to receival sites due to the relatively high transport cost during harvest period. The on-farm storage capacity typically prevents farms from storing the whole crop. Therefore, they tend to store up to the storage capacity and send the excess to receival sites. Second, it is assumed throughout the model that transport costs are expected to increase during harvest than storage than clearance period respectively (adjusted from Road Freight Transport Industry 2007, October 2013).
Around 80% of wheat is transported to receival sites during peak (harvest) period due to lack of storage capacity at farms. This means that around one million tonnes of wheat is stored on farms within the Avon region. The results of Model 1 show that the total profit of farmers after deducting biosecurity and transport cost is around $218 per tonne in 2008-09 data (the year of the study).
Model 2 results
Results of Model 2 illustrate the quantity stored at receival sites by bin type on road and on rail. For receival sites located on road, around 25% of wheat is stored during the harvest period and storage period (T1, T2), while around 75% of wheat is stored at receival sites on rail during the same two periods; T1 and T2. Most grain is stored in OBH (bunker) bin type, followed by HOR (horizontal) bin type. CIR bin type stores the least wheat quantity. During storage period (T2), most of the wheat quantity stored at receival sites is stored at HOR bin type, followed by OBH bin type. However, SIL (silo) and CIR bin types store the least wheat quantity during T2.
The above results show that HOR and OBH bin types are the most important storage type facilities for storing wheat quantities during both periods; harvest and storage periods. Conversely, HRC, SIL and CIR bin types store the least wheat quantity during T1 and T2. Therefore, HOR and OBH bin types are the most important storage infrastructure in the Avon region. Since HOR and OBH are considered as LQBs, the reliance on their usage increases the likelihood of SFR development (leakage = under dosing of PH3 which is repeated over a number of fumigations = increased number of resistant genes in population due to death of susceptible, which increases chance of homozygosity for resistant genes through breeding). This then would affect the international market as a result of the infested grain-status. Investment in HQB, despite the initial cost, should be a priority due to the cost penalties incurred if SFR develops and cannot be controlled (e.g. Cryptolestes until sulfuryl fluoride came on the market).
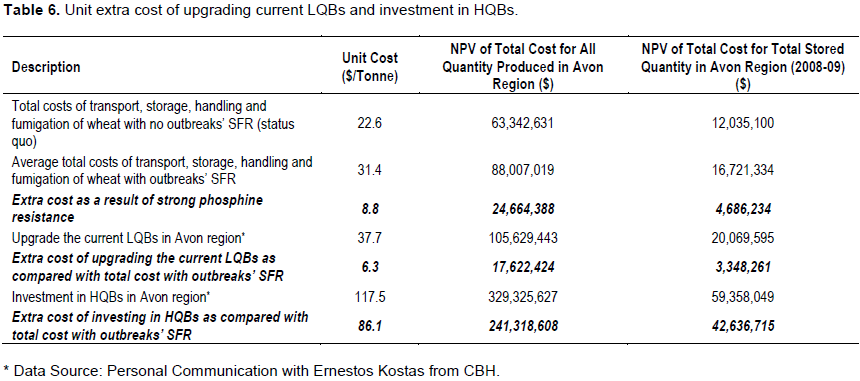
The results given in Table 6 show that the system incurs about $22.6/tonne to transport, store, handle and fumigate wheat within the Avon region. Previous results illustrate that Horizontal (HOR) and bunker (OBH) bins represent around 78% of the total available storage capacity and receive wheat from about 83% of farms for Avon region. This emphasizes how important these storage bins are to wheat network in Avon region. Table 6 also highlights the extra cost of establishing SFR on farms as compared to the extra cost of upgrading the existing LQBs and the extra cost of investing in HQBs. Although the initial cost of constructing HQBs appear to be significantly higher, the protection of millionsof tonnes of wheat against SFR and maintaining the excellent overseas reputation justifies it.
Model 3 results
Within R, the number of farms with SFR outbreaks (FI) is tracked, and each time step is used to compute the local
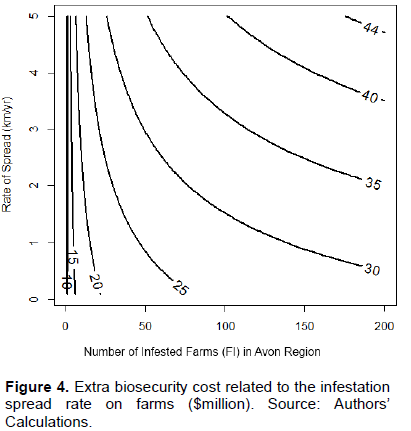
neighbourhood of un-infested farms (f) that fall within the population spread from an infested farm (FI) epicentre. Results of the biosecurity model show different iso-cost curves for different rates of spread and various numbers of infested farms (FI). Figure 4 illustrates the significance of the rate of spread (Rt) of SFR on the extra biosecurity cost (CEB), even with a limited number of SFR outbreaks/infested farms; FI = 200. The iso-cost curves are steep at the beginning, with just a few infested farms (FI), which shows the major effect of the rate of spread (Rt) on wheat network. Even with a small increase in the number of SFR outbreaks/infested farms (FI), the extra cost (CEB) increases at a fast rate, and can reach $44 million as a result of the rate of spread (Rt) of SFR infestations. If compared with another calculation for the extra biosecurity cost (CEB) without the introduction of the rate of spread (Rt) to the model, the extra biosecurity cost (CEB) has been reached with about 1500 infested farms (FI) rather than 200 only.
Results of the biosecurity model present a clear message; when the rate of local population spread (Rt) is high, then the development of few SFR outbreaks on farm is enough to have significant extra biosecurity cost (CEB) incurred across the whole wheat network.
Model 3 investment analysis
Model 3 is simulated for 20 years. Figure 4 illustrates the significance of the rate of spread on the extra cost associated with using LQBs, even with a limited number of outbreaks (200 only). The iso-cost curves are steep at the beginning, with a limited number of outbreaks, which shows the major effect of the rate of spread on the whole system. With number of outbreaks equals 200 or even less, the extra cost can reach significant amount as a result of the rate of spread of such infestations.
Results present a clear message; that when rate of local population spread is high, the development of few outbreaks is enough to have significant extra biosecurity costs incurred across the grain production region.
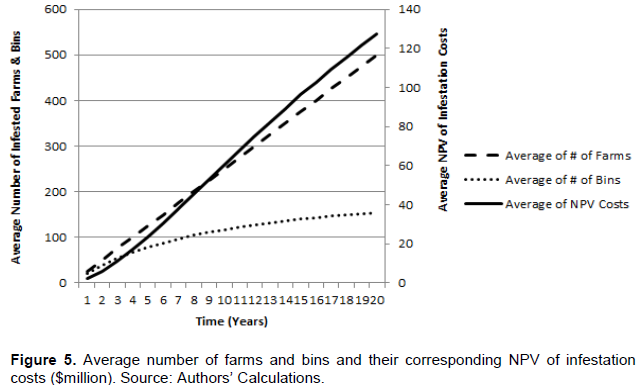
Figure 5 shows the significance of the net present value (NPV) of discount rate 5% of infestation cost on farms and receival bins over time. Notably, the NPV of storage costs increases rapidly after three years. The number of infested bins is massively increasing by progressive years and the cost of biosecurity is driven higher by an increasing number of farms infested rather than an increasing number of bins.