Maize (Zea mays L.) is the most widely cultivated and consumed of all cereals occupying an important position in the world economy and trade as food and feed and industrial raw materials. It is the third important cereal and cash crop of India. It serves as a vital source of proteins, calories (in the form of carbohydrates and fats), and some of the important vitamins and minerals to billions of people worldwide, particularly in Africa and Asia, and has been considered a ‘poor man’s nutricereal’ (Prasanna et al., 2001). Among other factors, food security is greatly threatened by excessive post-harvest losses caused by stored product insect pests. Stored grain moths represent one of the major factors responsible for the post-harvest losses of maize worldwide.
The Angoumois grain moth, Sitotroga cerealella (Olivier) (Lepidoptera: Gelechiidae) is one of the serious insect pests of stored grains in India (Yadu et al., 2000; Pathak and Jha, 2003). It is cosmopolitan in distribution. Its young larvae bore into grains and feed on the inside contents rendering grains unfit for human consumption. These cereals are vulnerable to this insect attack and can have either one or all deficiencies that include weight loss, reduction in nutritional value, contamination or tanning, rendering the cereal food unfit for human consumption. Anonymous (1979) estimated loss of about 15 to 21% maize in storage due to this pest, but up to 50 to 60% has been reported in the untreated kernel and in tropical countries where summer is hot and storage facilities are improper and inadequate (Ahmad and Ahmad, 2002). Unlike in the developed countries where maize grain is stored in silos with controlled moisture and chemical treatment, maize grain in developing countries like India is often traditionally stored in bags made of hessian and jute fibre. This results in a significant decrease in moisture and humidity especially during summer season, thus leading to conditions highly conducive to infestation by the grain moth.
Although insecticide treatment is recommended for grain moths, control of these insect pests by insecticides give residues and develop insect resistance. Moreover, application of fumigants and pesticides has not been satisfactory to many small scale farmers in the developing countries, as they are expensive and may be applied in inappropriate doses by the farmers (Markham et al., 1994). To reduce grain losses in stores, insect resistant varieties are of particular interest for developing countries. Lot of variation has been reported in grains for resistance to storage insects (Hamed and Khattak, 1997; Shafique and Ahmad, 2003).
Varietal resistance to storage insects is a potential means of reducing post harvest losses of maize crop. Varieties vary in susceptibility and attraction to stored grain insects depending upon their physico-chemcial properties. Painter (1968) first elaborated the mechanism of resistance by plant systems against insect pests, and classified resistance into three categories: non- preference (for oviposition, food or shelter), antibiosis (adverse effect of plant on the biology of insects) and resistance (repair, recover or active ability to withstand infestation). Chemical constituent of the grain play a vital role in determining the relative resistance to S. cerealella attack. Effect of chemical composition of grains and host plants on the host plant resistance has been reported by number of workers, (Peters et al., 1960, Pandey and Pandey, 1983; Chatterjee et aI., 1977; Ragumoorthy and Gunthilagaraja. 1988).
Keeping in view the food value and economic importance of maize grains, the present investigations have been carried out with the objectives to: i) Evaluate the performance of twenty maize varieties to infestation by S. cerealella and, ii) Compare chemical and nutraceutical composition of grain with susceptibility of maize varieties to S. cerealella infestation if there is any relationship between these traits.
Rearing of S. cerealella
Pure culture of S. cerealella used for this study was obtained from the established stock culture maintained for several years at the storage laboratory of the Division of Entomology, IARI, New Delhi. A stock culture of S. cerealella was reared on disinfested and conditioned commercial maize (Pratap Makka) seeds at 28±1°C and 65±5% r.h. in 4 L plastic jars covered with muslin cloth. The grain was cleaned and disinfested by keeping at -20 ± 2°C in a deep freezer for two weeks and then equilibrated/conditioned before use for additional two weeks to the laboratory conditions (28 ± 1°C and 65±5% RH) at which the culture was reared. To meet the regular supply of insects, the newly emerged moths were released on fresh disinfested and conditioned grain. The culture and the experiments were maintained at a temperature of 28±1°C and 65±5% relative humidity in Biological Oxygen Demand (BOD) incubators.
Grain of maize varieties used
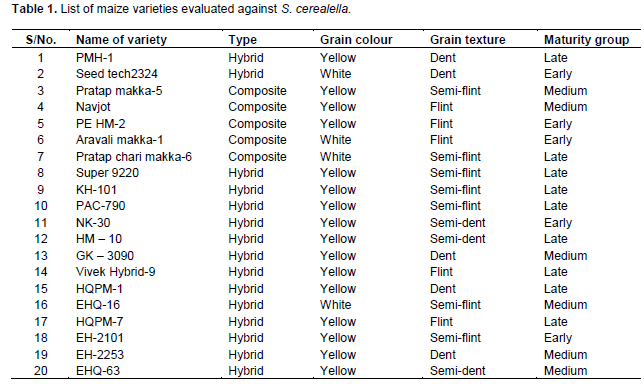
The research was conducted from January 2013 to February 2014. The study was undertaken to assess susceptibility and biochemical basis of resistance in twenty maize varieties against Angoumois grain moth, S. cerealella. All maize varieties were obtained from all India Co-ordinated Maize Improvement Project, Department of Plant Breeding and Genetics, Rajasthan College of Agriculture, Udaipur (Rajasthan). The maize varieties used and their type, grain colour, grain texture and maturity group are indicated in Table 1.
Biochemical analysis of the grains
The maize kernels were milled using a laboratory mill and stored at4°C prior to analysis. Proximate composition of the grains (that is, determination of moisture, crude protein, soluble protein, soluble sugar, crude fat, crude fibber, ash, carbohydrates, amylose, amylase and phenol) were performed in accordance with the standard method of Association of Official Analytical Chemists Washington, DC, USA632 A.O.A.C. (1990).
Moisture content was determined by Farmex MT-PRO grain moisture meter. Crude protein content was determined using the Kjeldahl procedure. The protein content was estimated by ‘N’ percent x 6.25 considering that the protein contains 16% nitrogen (Balogun and Fetuga, 1986; Gary, 1986; Amoo, 1998; Adeyeye, 1995). Carbohydrate content was determined by calculating the difference of the total of percentages of protein, crude fat and ash from 100. Carbohydrate content = 100 – Σ (Ash % + Protein % + Fat %). Results from percentages of ash, protein and fat were calculated in the dry material of kernels. Crude fibre was determined by subsequent acid base digestion. Crude fat was determined by ether extract method using Soxhlet apparatus. Ash content was determined using muffle furnace. The value was expressed in percentage. Determination of amylase was carried out by Di-Nitro Salicilic Acid (DNSA) procedure. Total phenols estimation was carried out with Folin-Ciocalteu reagent (FCR). The estimation of amylose content was determined by modified Juliano method (Juliano, 1979; Sadasivam and Manickam, 1992). The amount of total soluble sugars was estimated by following the anthrone reagent method of Hodge and Hofreiter (1962).
Susceptibility test by no-choice method
The F2 grain, formed through open pollination, was used to evaluate resistance because this represents the generation that is stored by farmers and vulnerable to S. cerealella. Previously untreated disinfested and conditioned samples of 200 g of the maize grains were taken from each batch of the selected maize varieties for the experiment and put in a 350 cm3 glass jar. No-choice trials involved placing 50 unsexed adult moths (1-2 days old) in jars to infest the 200 g grains of each variety for ten days to allow oviposition. The jars were covered with muslin close and tightened with rubber band which can permit adequate ventilation and preventing escape of the moths. Each treatment was replicate three times in a completely randomized design (CRD). After 10 days of oviposition, the moths (dead/live) were removed and the jars were then kept at the same experimental condition for F1 progeny emergence. Based on previous similar research works F1 progeny emergence, median development time, insect weight, susceptibility index, grain damage, weight losses and nutritional indices were experimented as described here under to categorize the varieties in to different susceptibility groups
Adult progeny emergence
Twenty eight days after moth introduction, the containers were checked every other day for adult emergence and data was recorded for first generation adult emergence. Counting of these adults were done by immobilizing them, using chloroform impregnated cotton plugs. Examination of each jar and collection of emergent moths was continued until no further emergence had been noted.
Median developmental period
The date of moth infestation was recorded for each replicate. Median developmental period that is, number of days from middle of oviposition period to fifty percent F1 progeny emergence were recorded for each replicate.
Insect weight
Newly emerged moth weights were taken. Total weight of twenty F1 progeny was calculated as mean adult weight from each entry using a sensitive weighing balance.
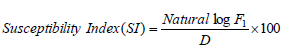
Dobie’s susceptibility index
Based on the number of moths emerged in each test variety and mean developmental period; index of susceptibility was calculated by the following formula (Dobie, 1978):
Where F1 is the total number of first generation emerging adults and D is the median developmental period.
The Dobie index, ranging from 0 to 11, was used to classify the maize varieties into susceptibility groups (Dobie, 1974; CIMMYT):
(i) Dobie index of 0 to 4 classified as resistant;
(ii) Dobie index of 4.1 to 7.0 moderately resistant;
(iii) Dobie index of 7.1 to 10.0 susceptible; and
(iv) Dobie index of ≥10.1 classified as highly susceptible
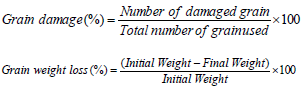
Grain damage and weight loss
At the termination of the experiment, each sample was passed through a 12-mesh sieve for separation of the grains and flour. The flour passed was weighed and discarded while the remaining material will be weighed. The grains containing holes were separated from the sound grains and both damaged and sound grains were weighed and counted. The percent damage and the percent weight loss were calculated according to the following formulae:
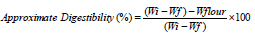
Nutritional indices
Nutritional indices were calculated as per the method described by Bergvinson (2004) using the following formulas:
Statistical analysis
All susceptibility traits as well as biochemical parameters were subjected to Analysis of Variance using the PROC GLM procedure (SAS institute, 2004). Differences among means were compared by Student Neuman Keul (SNK) tests with alpha <0.05. The data of percentage grain damage, weight loss and progeny emerged were analysed after arcsign, square root and log transformation, respectively. Analysis of variance was performed on both transformed and untransformed data but statistical parameters were taken from transformed data. Means of untransformed data are presented in the tables. The correlation between susceptibility traits and biochemical parameters were examined using Pearson’s correlation coefficient using PROC CORR procedure of the SAS software (SAS Institute, 2004).
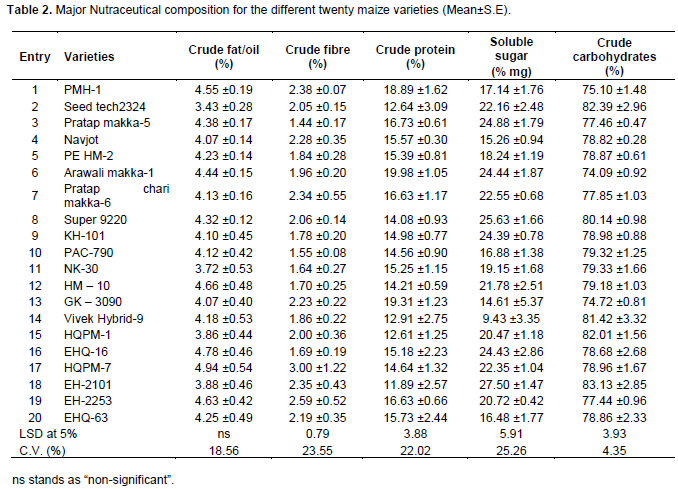
Proximate composition of maize grain
The quantitative estimation of biochemical content in different varieties of fresh maize grain was done and the results were presented in Tables 2 and 3. The correlation coefficient of these characters with susceptibility parameters were determined and summarized in Table 6.
Crude fat/oil content
Fat content was assessed from the dried material of the grains of different maize varieties in both two years. Analysis of pooled data showed that there were no significant differences among the maize varieties. Numerically the lowest fat content (<4%), however, was observed in entries 2, 11, 15, and 18 while the highest value (>4%) was with the remaining entries. In general percent fats were determined in the range of 3.43% (Seed tech2324 variety) to 4.94% (HQPM-7 variety) (Table 2).
Crude fibre
The crude fibre content of the different maize grain was in a range of 1.39 to 2.60% in the first year of the study while, it was 1.46 to 2.53% in the second year. There were significant differences among the maize varieties as regard to crude fibre content in pooled data. Percent crude fibre was found in the range of 1.44 to 3.00%. In the present study out of twenty different maize varieties eleven were having more than 2% crude fibre while the remaining 9 were having less than 2% (Table 2).
Crude protein
Crude protein was significantly different among kernels. The highest protein content was observed with Arawali makka-1 (19.98%) followed by GK-3090 (19.31%) and it was however, at par with PMH-1, Pratap makka-5, Pratap chari makka-6 and EH-2253, respectively. The lowest protein content was observed in EH-2101 (11.86%) followed by HQPM-1, Seed tech2324 and Vivake hybride-9 (Table 2).
Soluble sugar contents
As regard to the soluble sugar, significant differences were recorded among different varieties. Analysis of pooled data revealed that sugar content was highest in EH-2101 (27.51% mg) but this was at par with entries 8, 3, 6, 16, 9, 7, 2 and 12. The lowest sugar content was observed for Vivake Hybrid-9 (9.44% mg) followed by GK-3090 and Navjot. The remaining entries had sugar content ranging between 16 and 20% mg (Table 2).
Crude carbohydrate
During the studies significant difference was observed for the percent crude carbohydrate in kernels of different maize varieties. The crude carbohydrate was highest in the kernels of EH-2101 (83.13%) followed by Seed tech2324 (82.39%), HQPM-1 (82.02%), Viveke Hybrid-9 (81.42%) and Super 9220 (80.14%) and were statistically at par. The lowest crude carbohydrate content was observed in Arawali makka-1 (74.09%) which was significantly lowest as compared to the rest of the varieties (Table 2). In general carbohydrates are the major chemical component of the maize grains. It was found in the range of 74.09% (Arawali Makka-1 variety) to
83.13% (EH-2101 variety).
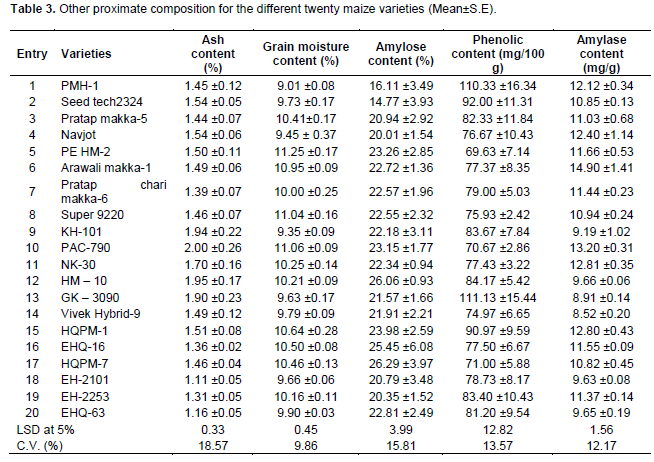
Ash content
Significant differences were observed for the ash content in the maize grains. Percent ash content of different maize varieties were found in the range of 1.11 to 2.00%. PAC-790 had the highest ash content of 2.00% whereas EH-2101 had the lowest value of 1.11%. However, most of the varieties have ash content of less than 2%. The mineral or ash contents were also within the typical range (1.1-2.5%) expected for whole kernels (Table 3).
Grain moisture content
Data regarding moisture contents of different maize varieties determined by moisture meter are given in Table 3. Data revealed that the highest grain moisture content (>10.5%) were observed in entries 5, 6, 8, 10 and 15 whereas the lowest (<9.50%) in the entries, 1, 4 and 9.
Amylose content
There were significant differences among kernels of different maize varieties in percent amylose content. The maximum percentage of amylose content (26.29 and 26.06%) was recorded from HQPM-1 and HM-10, respectively; whereas Seed tech2324 and PMH-1 varieties having minimum percent amylose (14.77 and 16.11%, respectively) had non-significant difference among themselves. The rest varieties were having amylose content in the range between 20 and 25% (Table 3).
Phenolic content
The maximum total phenolics (111.13 and 110.33 mg/100 g) in GK-3090 and PMH-1 varieties had significant difference from all other varieties. PEHM-2 and PAC-790 varieties having minimum total phenolics (69.63 and 70.67 mg/100 g, respectively) had non-significant difference among themselves. The resistant variety Pratap makka-5 and moderately resistant EH-2253 had phenolic content of 82.33 and 83.40 mg/100 g, respectively. phenolic content in the rest entries ranged from 71.00 to 92.00 mg/100 g (Table 3).
Amylase content
There were highly significant (P<0.01) differences among maize varieties in amylase content. The highest amylase content was observed for Arawali maka-1 (14.90 mg/g) being significantly different from all the remaining varieties. The lowest amylase content was observed for Vivake hybrid-9 and GK-3090 (8.52 and 8.91 mg/g, respectively) but these were at par with entries 9, 12, 18 and 20 (Table 3).
Insect susceptibility parameters
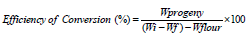
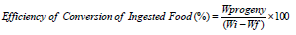
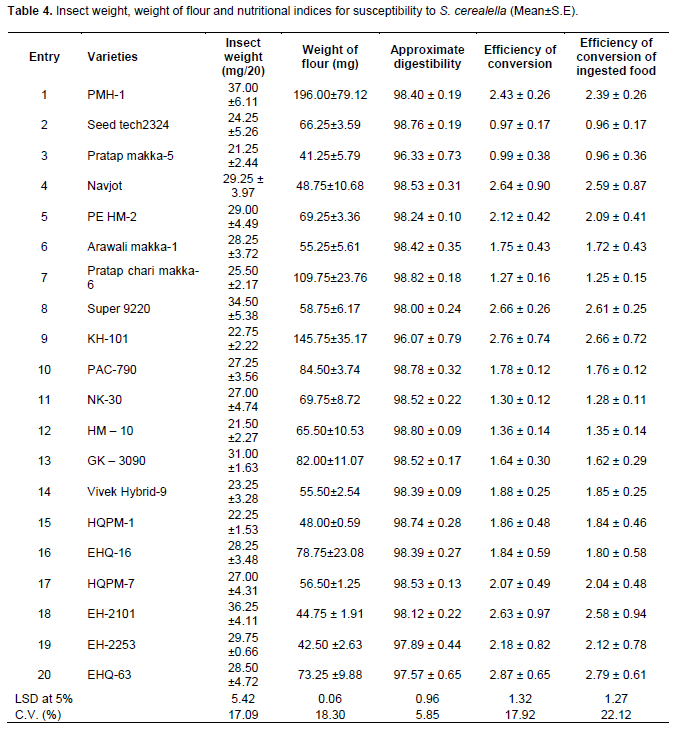
ANOVA on pooled data of 20 maize varieties revealed significant variations among the varieties for both insect weight, weight of flour, approximate digestibility, efficiency of conversion and efficiency of conversion of ingested food (Table 4). The highest insect weight (37.00 mg) was observed for entry 1 followed by entries 18 and 8 (36.25 and 34.50 mg, respectively) and were at par with each other; whereas, the lowest insect weight (21.25 mg) was observed for entry 3 followed by entries 12, 15, 9, 14, 2 and 7 and were not significantly different from each other. The remaining entries had insect weight ranging from 27 to 31 mg and statistically at par. Furthermore, Table 4 also shows that entry 1 had the highest weight of flour (196 mg) followed by entry 9 (145.75 mg) and entry 7 (109.75 mg), which were significantly different from the other varieties. The lowest weight of flour (41.25 mg) was observed from entries 3 followed by entries 19 (42.50 mg) and 18 (44.75 mg). Analysis of nutritional indices showed that the lowest approximate digestibility (<98) was observed for entries 9, 3, 20 and 19, while all the remaining entries had the highest approximate digestibility of more than 98. On the other hand the lowest efficiency of conversion (0.97 and 0.99) were observed from entries 2 and 3, respectively; whereas, the highest (2.87 and 2.76) were calculated from entries 20 and 9, respectively followed by entries 8, 4, 18, 1, 19, 5 and 17 and were statistically at par with each other. Likewise, a similar trend was observed in the case of efficiency of conversion of ingested food.

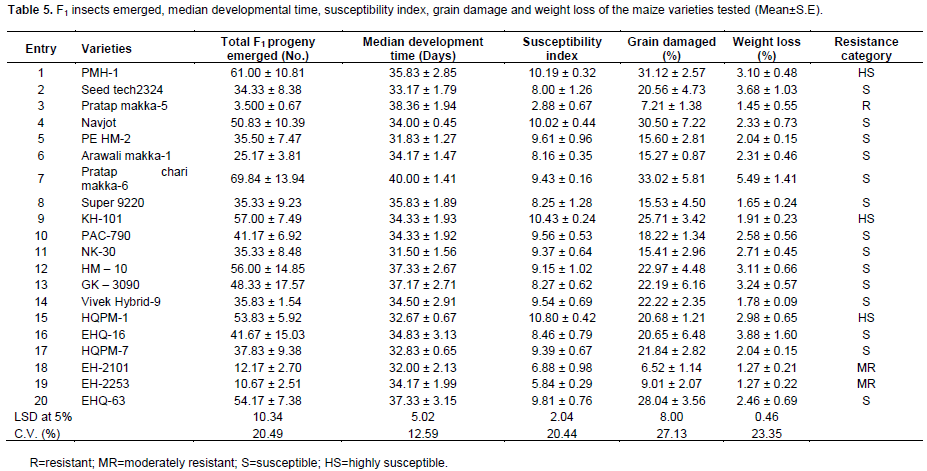
There were also significant variations among maize varieties in F1 progeny emerged, median development time, grain damage, grain weight loss and susceptibility index (Table 5). Minimum progeny emergence was in entry 3 (3.50) and entry 19 (10.67) followed by entry 18 (12.17) and entry 6 (25.17), while the maximum was observed in entry 7 (69.83) and entry 1 (61.00) followed by entry 9 (57.00) and entry 12 (56.00) which were at par with each other. Similarly, entries 18, 3 and 19 recorded lowest grain damage (6.52, 7.21 and 9.01%, respectively) followed by entry 6 (15.28%), while the highest was observed in entry 7 (33.02%), entry 1 (31.12%) and entry 4 (30.49%) followed by entry 20 (28.04%) and entry 9 (25.71%) (Table 5). The weight loss was significantly lower (1.27%) in entry 18 and 19 followed by entry 8 (1.66%) and entry 14 (1.78%), while it was significantly higher in entry 7 (5.49%) followed by entry 16 (3.88%) and entry 2 (3.68%). S. cerealella reared on entries 7 (40.00), 3 (38.36), 20 (37.33), 12 (37.33) and 13 (37.17) had relatively longer development period; whereas, those reared on entries 5, 11 and 18 had comparatively shorter development period (31.38, 31.50 and 32.00 days, respectively) (Table 5). Based on the median developmental time and the numbers of F1 progeny emerged susceptibility index were calculated. The index of susceptibility ranged from 2.88 in entry 3 to 10.81 in entry 15. The higher the index the more susceptible was the variety. The lowest susceptibility index (2.88, 5.84 and 6.88) was shown by the entries 3 19 and 18, respectively, while the highest one was for the entry 15 (10.81) followed by entries 9, 1 and 4 (Table 5). The same trends were observed for percent grain damage and weight losses. The maximum grain damage and weight losses were recorded for entries 1, 4, 7 and 9, whereas, the minimum for entries 3, 18 and 19 (Table 5).

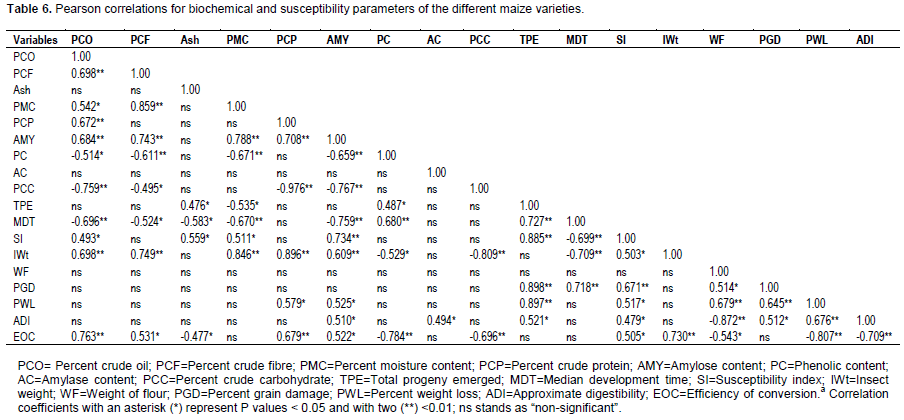
Correlation between chemical kernel properties and susceptibility parameters
Regarding information depicted in Table 6, the biochemical characteristics (mainly percent crude oil,percent crude fat, percent crude protein, percent amylose content, phenolic content, and percent crude carbohydrate) were correlated to susceptibility parameters. Correlation coefficients revealed a highly significant positive relationship between percent crude oil and insect weight ( r = 0.698**), percent crude oil and efficiency of conversion (r = 0.763**), percent crude fibre and insect weight (r = 0.749**), percent moisture content and insect weight ( r = 0.846**), percent crude protein and insect weight ( r = 0.896**), percent crude protein and efficiency of conversion (r = 0.679**), amylose and susceptibility index (r = 0.734**), amylose and insect weight (r = 0.609**) and phenolic content and medial development time (r = 0.680**), while a highly significant inverse relationship between percent crude oil and medial development time (r = -0.696**), percent moisture content and medial development time (r = -0.670**), amylose content and medial development time (r = -0.759**), phenolic content and efficiency of conversion (r = -0.784**), crude carbohydrate and insect weight (r = -0.809**), and crude carbohydrate and efficiency of conversion (r = -0.696**) were observed. There were significant positive relationship between percent crude oil and susceptibility index (r = 0.493*), crude fibre and efficiency of conversion (r = 0.531*), ash content and progeny emerged (r=0.476*), ash content and susceptibility index (r=0.559*), amylose content and grain weight loss (r = 0.525*), amylose content and approximate digestibility (r = 0.510*), amylose content and efficiency of conversion (r = 0.522*), phenolic content and progeny emerged (r = 487*) and amylase content and approximate digestibility (r = 0.494*). Crude fibre and median development time (r = -0.524*), ash content and efficiency of conversion (r = -0.477*), ash content and median development time (r = -0.583*), percent moisture content and progeny emerged (r = -0.535*) and phenolic content and insect weight (r = -0.529*) had a significant inverse relationship. No significant correlations were observed between the remaining biochemical and susceptibility parameters.
The number of progeny emerged, median development time, susceptibility index, percent grain damage and grain weight loss were highly correlated (Table 6). The correlation between progeny emerged and median development time (r=0.727**), progeny emerged and susceptibility index (r=0.885**), progeny emerged and grain damage (r=0.898**), progeny emerged and grain weight loss (r=0.897**), median development time and grain damage (r=0.718**), susceptibility index and grain damage (r=0.671**), insect weight and efficiency of conversion (r=0.730**), weight of flour and grain weight loss (r=0.679**), grain damage and grain weight loss (r=0.645**) and grain weight loss and approximate digestibility (r=0.676**) were positive and highly significant. However, median development time and susceptibility index (r=-0.699**), median development time and insect weight (r=-0.709**), grain weight loss and efficiency of conversion (r=-0.807**) and approximate digestibility and efficiency of conversion (r=-0.709**) showed a highly significant negative relationship. Correlation between progeny emerged and approximate digestibility (r=0.521*), susceptibility index and insect weight (r=0.503*), grain weight loss (r=0.517*), approximate digestibility (r=0.479*) and efficiency of conversion (r=0.505*), weight of flour and grain damage (r=0.514*) and grain damage and approximate digestibility (r=0.512*) were positive and significant; whereas, weight of flour and efficiency of conversion was negatively correlated ( r=0.543*). Besides, significant positive as well as negative relationships among biochemical parameters were obtained (Table 6).

The characteristics of grain resistance to stored insects, is still debatable (Shafique and Chaudry, 2007; Abebe et al., 2009; Nadeem et al., 2011). This study demonstrated considerable variation among the maize varieties with respect to S. cerealella resistance. Relatively longer developmental time was required on the resistant variety Pratap makka-5 and lower number of F1 insects emerged, while the reverse is true for the susceptible varieties. In this study, we used F2 grains resulting from cross fertilization. The embryo contributes 11%, and the endosperm 83% of the dry matter of the kernel (Tollenar and Dwyer, 1999), pointing to a potential positive effect of xenia (direct cross fertilization effect on the grain traits of the female component) on grain yield. The effect of xenia on grain resistance to the S. cerealella, however, needs further investigation. Shafique and Chaudry (2007) suggested that the low insect population and low weight loss of grain can be used as one of the attribute of the grain resistance to insects. In addition to weight loss and number of F1 progeny, Abebe et al. (2009) used median developmental time and percentage of seed damage as indicators of the susceptibility of maize varieties to the attack of S. zeamais. Our result on median development time was in agreement with Fouad et al. (2013), who found that the median developmental period from egg to adult reared on maize was between 34.03 and 39.33 days. If the number of F1 progeny emerged could be regarded as the infestation intensity, then it could be suggested that the weight loss due to the infestation of S. cerealella corresponds with the infestation intensity. This suggestion is supported by the data presented in Table 4 which show that the lowest weight loss (1.27%) occurred on entries 18 and 19, although it did not significantly differ with entries 8 and 14, but was significantly different with the other entries.
Our results in biochemical analysis of different maize grains were in close agreement with previous findings by different authors. Ijabadeniyi and Adebolu (2005) determined the percent fat content of three maize varieties grown in Nigeria in the range of 4.77 to 5.00% for the maize grains, which is in an agreement with the present study. The same authors also reported similar results (2.07 – 2.77%) of the fibre content for the maize varieties grown in Nigeria. Peplinski et al. (1989) reported values of ash between 1.3 and 1.5%. This notion is in agreement with the results of the present study.
Maziya-Dixon et al. (2000) found results in the range of 1.4 to 3.3%, which are a bit higher than the values determined in the present study. Aisha and El-Tinay (2004) investigated the ash value in the range of 1.0 to 2.0% which is matching with present results of our study. The same authors found the moisture value in 12 corn genotypes in the range of 4.3 – 6.7 per cent which is a bit lower than results in the present study. Samir et al. (1998) measured the moisture content in the range of 9 to 19%, which is in agreement with our results obtained in the current study. Ijabadeniyi and Adebolu (2005) reported slightly lower values (65.63 to 70.23%) of the carbohydrate content for the maize varieties grown in Nigeria. The values of protein content obtained in the current study are considered typical because most of them lie within the range of 7.3 to 15.6% reported by Waniska and Rooney (2000).
The result of correlation analysis between biochemical and susceptibility parameters showed that variables of crude protein, fat, fibre and carbohydrate content are negatively but not significantly correlated with variables of F
1 progeny emerged. The findings in this study are in agreement with Dobie (1976) who reported a negative and non-significant correlation between protein and beetle attack. He therefore, concluded that crude protein was independent of maize kernel hardness or softness. This means that resistance is not dependent on the nutritional content of the maize varieties studied. However, both Singh and McCain (1963) and Dobie (1977) reported the factors contributing to grain resistance to weevils to include increased sugar content. Peters et al. (1972) also reported negative correlation between the fat content and moth weight. Low protein content has been observed to contribute resistance to rough rice against S.
cerealella; but relationship was not distinct (Chatterjee et al., 1977). However, Yadu et al. (2000) reported a positive relationship between protein content and damage by
S. cerealella to maize. Rao and Sharma (
2003) further reported that protein content in wheat had little role in resistance.
On the other hand, the maize kernel with high ash content would favour the high number of F1 progeny emerged and faster development and consequently would be susceptible to the S. cerealella attacks. Phenolic content of maize kernels had significantly negative correlation with the number of F1 progeny emerged, the susceptibility index and insect weight. Furthermore, this variable had positively correlated with the median developmental time. This result revealed that high phenolic content attributed low number of F1 progeny emerged and the slow development of S. cerealella. As a result, the maize varieties with the high phenolic content appear to be resistant to the S. cerealella attacks. Phenolic compounds have also been named as contributing significantly to maize resistance to maize weevil (Classen et al., 1990). Ranason et al. (1992) reported that resistance in maize grain to the weevil was also contributed by the anti-feedant effect of phenolic compounds and weight loss of grains was negatively correlated to total phenolics in the grain. Cogburn et al. (1983) and Ahmad et al. (1998) stated that varietals resistance to stored rice insects is related to grain hardness, amylase content, non-chalkiness and phenolic content in the rice kernels. Noris and Kogan (1980) said that plant defence to the insect attack by its physical characteristics and chemical content such as the phenolic compounds. Serna -Saldívar (2010) indicated that phenolics have an important role in protecting kernels against biotic and abiotic stresses. In maize, phenolics are related to kernel resistance through physical and toxicological mechanisms (García-Lara et al., 2004) and in sorghum, a positive relationship between phenolic content and Sitophilus oryzae resistance has been reported (Ramputh et al., 1999). Our results in the present studies were in close agreement with the above mentioned findings.
Peters et al. (1972) reported higher amylose content in resistant varieties of corn than the susceptible varieties against weevils and beetles. Similarly in paddy higher amylose content was recorded in resistant varieties in comparison to susceptible ones against S. oryzae (Ragumoorthy and Gunthilagaraja, 1988). In contrast our finding revealed that amylose content was negatively correlated with median development time but positively correlated with susceptibility index, insect weight and grain weight loss which means higher amylose content was found in susceptible variety than resistant ones. These results showed a preference of S. cerealella to high amylose kernels. Flores (1970) observed that there was no significant correlation between quantities of amylose, sugars and protein in corn varieties and damage by S. cerealella but negative correlation was observed between lipid content and mean development period of the insect. These indicated that different insect species have different preference to different biochemical contents of the grain. In general our findings were similar to that of Fouad et al. (2013), who studied relationship between physico-chemical characteristics of corn kernels and susceptibility to S. cerealella.