ABSTRACT
Potassium dynamics of soils is constituted by constantly changing relationship between soil K forms, and this relation is affected by some soil physical and chemical properties. Most Sidama (south Ethiopia) farmers grow enset crops which have high K requirements. The soils were collected from Awassa-Zuriya and Dale districts; ’Woinadega’ (warm subtropical climate) and Hula district ‘Dega’ (wet, cool temperate climate). Overview of K dynamics in soils via Quantity-Intensity (Q/I) curves was used to evaluate the dynamics of K in fifteen soil samples representing the enset farming systems of Sidama. All of the Hula district soils and half of the Dale district soils had low percent K saturation. There were significant correlations between some soil properties and Q/I parameters and among equilibrium solution parameters and Q/I parameters. Variations among the mean quantity (±âˆ†K) values of the soils were not significant. The Dale and Hula district soils had higher K intensity than the Awassa-Zuriya district soils; where the Hula (Adola kura kebele) soil had the highest value. Therefore, the Dale and Hula district soils will require frequent and split K applications since they have lower capacity to maintain long-term supply of K. On the other hand, Awassa-Zuriya district soils had high K quantity than the Dale and Hula district soils. This shows that the Awassa-Zuriya district soils have a higher potential to supply K for a longer period of time from the exchangeable pool. However, the Awassa-Zuriya district soils require less frequent and higher K fertilization to saturate the exchangeable pool to meet immediate potassium requirement of crops. The low equilibrium activity ratio of potassium and low potassium replenishing capacity of nearly all of the soils studied also indicated the need for K application.
Key words: Dynamics of potassium, potential buffering capacity, activity ratio, quantity-intensity isotherms, potassium saturation.
Enset (Enseteventricosum Cheesman) is a part of sustainable production system and has been cultivated in Ethiopia since ancient times (Garedew et al., 2017). It is most commonly grown in home-gardens, frequently intercropped with peas or beans, which is suitable to compensate the low protein level in enset foods (Abebe et al., 2010). It is also intercropped with cereal crops (maize, sorghum), root crop (sweet potato), coffee, cabbage, papaya and avocado. Forms of soil potassium are partitioned into four different pools on the bases of the degree of availability to plants (Romheld and Kirkby, 2010). Among the pools the labile, soil solution and exchangeable K meet the immediate requirements of growing plants while the non-labile, non-exchangeable and mineral K are responsible for the long-term supply of K to plants (Askegaard et al., 2003). Potassium dynamics in soils is described as the constantly changing relationship between labile and non-labile forms of K (Yawson et al., 2011). It helps to explain the movement of K in soil-solution-plant systems in relation to driving forces. Potassium dynamics depends on the magnitude of equilibrium among the K forms and it is mainly governed by the physicochemical properties of soils, mineral make up, exchange properties and rate of weathering (Lalitha and Dhakshinamoorthy, 2013). Constant change of K in soils is derived by gravitational and diffusion forces (Frissel, 1978).
These forces cause dynamic equilibrium of K in soils and the dynamic equilibrium in turn distributes K into different forms. However, soil K forms and other soil properties are not homogeneously distributed in soils since the parent material, degree of weathering, K gains through manures and fertilizers and losses due to crop removal, erosion and leaching differs for different soils (Bogunovic et al., 2017; Rodrigo-Comino et al., 2017). In spite of this, farmers lack sufficient knowledge on soil conservation techniques and the importance of the soils in the bio-geological cycles (Biratu and Asmamaw, 2016; Cerdà et al., 2017). So far, concentration of exchangeable K has been determined by traditional method that employs chemical extractants. However, Bansal et al. (2002) reported the insufficiency of exchangeable K alone for evaluating K availability under intensive cropping. This could be mainly due to the fact that dynamic interactions among different K pools control plant availability of soil potassium. As of late, new techniques that use adsorption isotherms and thermodynamic parameters such as ionic activity, activity coefficient, ionic strength, free energy of replacement, activity ratio and buffering capacity are considered by several researchers as accurate methods for evaluating potassium status and its availability in soils (Al-Zubaidi et al., 2008).
These can be partly achieved through the study of the relationship that exists between changes in concentration of adsorbed K to changes in concentration of solution K; that is, Quantity/Intensity (Q/I) relationship (Uddin et al., 2011). Both intensity and soils inherent capacity to buffer K against changes are important parameters which determine availability of K to plants (Raheb and Heidari, 2012). Hence, misunderstanding of these dynamics leads to mismanagement of soil fertility. However, to assess the conditions of potassium uptake by plants, the extensive parameters such as potassium, calcium and magnesium contents of soils are also required (Yong-Hong, 2010). In this case, the activity ratio (AReK) described by Beckett (1964) is one of the satisfactory measures of the K dynamics and its availability, because it measures the chemical potential of labile K present to the chemical potential of labile calcium plus magnesium in the same soil. To date, no research has been conducted and published on potassium dynamics in Sidama soils (south Ethiopia). The objective of this study was therefore to evaluate the dynamics of potassium under enset farming systems of Sidama, Southern Ethiopia and hence it was expected that the research will provide detailed information on the status of potassium.
Study area
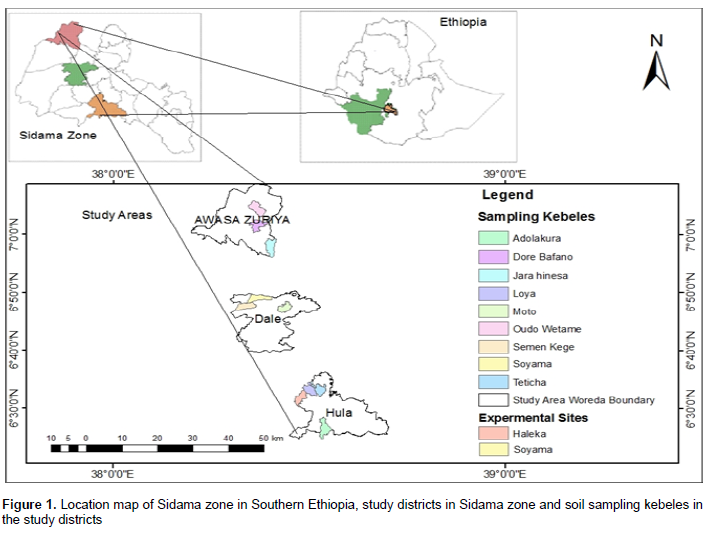
This study was conducted in Awassa-Zuriya, Dale and Hula districts of Sidama zone, Southern Ethiopia (Figure 1) in 2016. Sidama administrative zone is located within 5°45’- 6°45’N latitude and 38°-39°E longitude covering a total area of 6,538.17 square kilometers (SZPEDD, 2010). It lies in the area varying from flat land (warm to hot) to highland (warm to cold). The regional and zonal capital, Hawassa, which is located in the northern tip of Sidama zone, has a distance of 275 km from Addis Ababa (capital city of Ethiopia). Sample study areas (districts) from the zone were randomly selected because nearly all areas in the zone have good potential for enset production irrespective of productivity variation due to rainfall and altitude discrepancy. The selected districts are located between 38°20'7.8" - 38°32'36.5"E and 06°28'15.5" - 07°04'50.3"N. Awassa-Zuriya and Dale districts have moist to humid, warm subtropical climate with a mean annual precipitation of 1000 to 1800 mm, and have a mean annual temperature of 15 to 20°C. In these districts, perennial crops such as ‘enset’, ‘chat’ (catha edulis), coffee (Coffea arabica), Avocado (Persea americana) and annual crops such as maize (Zea mays L.), tomato (Solanum lycopersicum), sweet potato (Ipomea batatas) and haricot bean (Phaseolus vulgaris L.) are widely grown. The Hula district has wet, cool temperate climate and receives an annual rainfall of 1200 to 1800 mm, and has the mean annual temperature of 10 to 15°C. In this district, enset (Ensete ventricosum), barley (Hordeum vulgare), bread wheat (Triticum aestivum L.), cabbage (Brassica carinata), and potato (Solanum tuberosum) are widely grown (SZPEDD, 2010).
Soil sampling
Forty five composite samples were collected in November, 2015 from the three randomly selected districts in Sidama zone where animal dung and manures fertilizers have been applied. After selecting representative farmers’ enset farms in the farmer associations (kebeles), each field was divided into three stratum with 12 m long in the direction from home vicinity to far located fields. Composite soil sample (12 cores) from 50 cm depth was collected in a plastic pail from each stratum based on the method outlined in Hussen (2007) using auger. The soils were placed on a plastic sheet with an area of 3 m2 and thoroughly mixed. About 1 kg sample was taken and kept in a polyethylene plastic bag and labeled. Before laboratory analysis, samples were air-dried at room temperature, ground using mortar and pestle, homogenized, and passed through a 2 mm sieve. Finally, samples were stored in clean and dry area at room temperature until the time of use.
Soil physical and chemical analysis
Selected physical and chemical properties of the soils were determined using standard procedures. The pH value was determined by 1:2.5 soil-water suspensions by a glass electrode (Jackson, 1973). Electrical conductivity was determined in supernatant solutions by electro conductivity meter. Organic carbon was determined by the wet oxidation method of Walkley-Black (1934). Cation exchange capacity (CEC) was determined by the 1N NH4OAc extraction method; and exchange acidity by the 1N KCl extraction method. Soil texture was determined by the hydrometer method (Bouyoucos, 1951) and the textural classes were determined using United State Department of Agriculture (USDA) soil textural triangle. Effective cation exchange capacity (ECEC) was determined by summation method. Lastly, the exchangeable potassium was determined using Mehlich III extractant (Mehlich, 1984).
Equilibration procedure
Soil samples selected were analyzed by the Quantity/Intensity procedure based on the method outlined in Beckett (1964). A stock solution of potassium chloride, 10 mmole/L KCl and Calcium chloride, 10 mmole/L CaCl2 were prepared separately. From these separate solutions, graded concentrations of potassium (0.0, 0.2, 0.4, 1.0, and 2.0 mmol/L in 10 mmole/L CaCl2) were prepared and used for equilibration study. From each soil samples, duplicates of 5 g soils were weighed and quantitatively transferred into each of five plastic tubes. Then, 50 ml of the graded concentration solutions from each was added to the correspondingly labeled plastic tubes. The suspensions were then shaken with a horizontal flask shaker for half an hour and allowed to equilibrate overnight. After equilibration, suspensions were filtered using Whatman No. 42 filter paper, and the equilibrium solutions were analyzed for potassium by Flame Photometer (BWB, 2012); for Electrical conductivity (EC) by EC meter and for Ca and Mg by EDTA titration (Tucker and Kurtz, 1961).
Equations used to determine thermodynamic parameters and graphical analysis of Quantity/Intensity plots
Ionic strength (µ) mol/L in equilibrium solutions was calculated from the electrical conductivity (EC) using the equation.
µ = 0.0129*EC, (Lindsay, 1979). (1)
Activities (a) of potassium, calcium and magnesium in equilibrium solutions were calculated as product of concentration of ions by their activity coefficient (γ) values. Activity coefficient of ions was calculated using extended Debye-Hückel equation:
Where:
Zi: valency of ion
A: 0.508 for water at 25°C
B: 0.328 ×10⁸ for water at 25°C
d: is the effective distance of closest approach measured in centimeter and corresponds roughly to the effective size of hydrated ions (d values for different ions are tabulated in Lindsay (1979)).
The gain (loss) of potassium in relation to the adsorbed phase (±ΔK) was calculated by measuring the corresponding increase or decrease in the concentration of potassium in the equilibrium solution, compared to the original solution using the following equation:
Where Initial conc. is K added and Final conc. is K in equilibrium solution.
The intensity (I) of labile K in the soil was determined by employing the formula of activity ratio of potassium to the sum of activities of calcium and magnesium in equilibrium solutions as:

Where Initial conc. is K added and Final conc. is K in equilibrium solution.
The intensity (I) of labile K in the soil was determined by employing the formula of activity ratio of potassium to the sum of activities of calcium and magnesium in equilibrium solutions as:

Where: a is activity
A graph of increase or decrease of K (on the y-axis) and the activity ratio of potassium (on the x-axis) were plotted. On this graph, the equilibrium activity ratio (AReK) was obtained by reading the value on the abscissa where increase or decrease of K (±ΔK) = 0 (Figure 2). ‘L’ and ‘C’ denote linear and curvilinear portions of the Q/I lines respectively. These were obtained by extrapolating from the lower x, y coordinate points to the y-axis. Non-specific K (KLa-p) was obtained from y-intercept of linear portion of the curve where ARK = 0. Specific K (Ks) was obtained by extrapolating the linear portion of the curve to the ordinate, by drawing a tangent from the point of abscissa where ±ΔK = 0 and by measuring from the point of labile K (planar and non-specific K) to the end of tangent line on ordinate. Potential buffering capacity was determined by calculating the slope of the linear portion of the curve. K-potential was determined by multiplying the non-specific potassium by the buffering capacity of potassium (PBCK). The free energy or the potential of the soil for K-(Ca + Mg) replenishment was determined using the equation reported by woodruff (1955):

Where, T = Absolute temperature at 25°C (298K), R (universal gas constant), constant = 1.987 Cal/mol and a = activity of metal ions. Labile K (-Klab) released by the soil was obtained graphically by extrapolating the linear portion of the Q/I plot to its y-intercept (Figure 2). Potassium saturation percentage was calculated using:
Lastly, Potassium equilibrium parameters were computed with Excel sheet facilities.
Statistical data analysis
Correlation analysis between soil properties and Quantity/Intensity parameters, between equilibrium solution parameters and Quantity/Intensity parameters were performed with the statistical analysis system (SAS Institute, 2012)
Soil properties
The selected soils physico-chemical properties are presented in Table 1. The pHs of the soils were interpreted as per the ratings of EthioSIS (2014) and it ranged from 4.7 to 7.6, where neutral soils prevail. All of the Hula district soils were strongly acidic while 25% of the Dale district soils had moderately acidic reaction. The Awassa-Zuriya district soils were dominated with neutral and moderately alkaline pH ranges. These results are in line with the findings of David (2015) who suggested the effect of high exchangeable cations on the pH of soils. Organic carbon (OC) ranged from 1.2 to 4.1%. Based on Landon (2014), all soils of Awassa-Zuriya district were categorized as very low in OC while nearly all soils of the Dale and Hula districts had low level of OC. The result is in agreement with the findings of Laekemariam (2015) who reported low levels of OC in enset fields. The mean particle size distribution in Awassa-Zuriya district is in the order of clay (35.67) > silt (34.67) > sand (29.33), whilst the distributions in Dale and Hula districts are in the order of clay (42) > sand (30.75) > silt (27.25) and sand (39.2) > clay (33.6) > silt (27.2), respectively. These values indicated that the Dale and Awassa-Zuriya district soils had relatively high clay fraction suggesting their ability to retain K than its loss through leaching. However, more K could be fixed in these areas. The Hula district soils, on the other hand, had relatively high sand fraction which aids leaching and the likelihood of acidic conditions than retention of K.
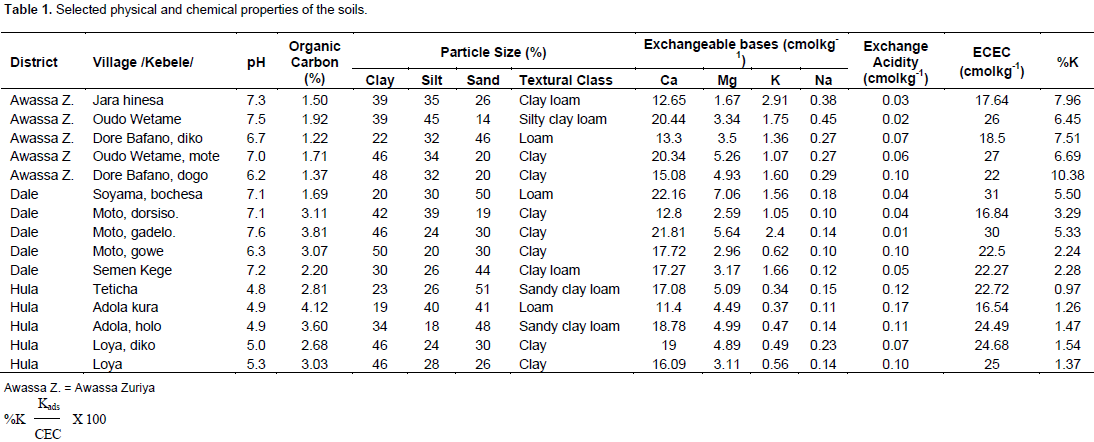
Based on Landon (2014), soils in all studied districts were sufficient in exchangeable Ca while closer values of exchangeable Mg content were found for all districts. Soils of Dale and Awassa-Zuriya districts had high amounts of soil exchangeable K while soils of Hula district had low amount (EthioSIS, 2014). There is a positive correlation between pH and ECEC and an inverse relation between pH and exchange acidity (Evangelou and Blevins, 1998). Consequently, considering the pH and the exchange acidity of Dale district Motto dorsiso. village, the high ECEC can be expected. Potassium saturation percentage (%K) was found to range from 0.97 to 10.38 and had a mean of 4.28±3.0. Although the mean is above the critical, all soils of Hula district along with 50% of Dale district were found far below critical value of 2.3 (FAO-UNESCO, 1997). This indicated the saturation of CEC with other cations in these areas while on the contrary, all soils of Awassa-Zuriya district and half of the Dale district had potassium proportion of above the critical level.
Evaluation of equilibrium solution parameters
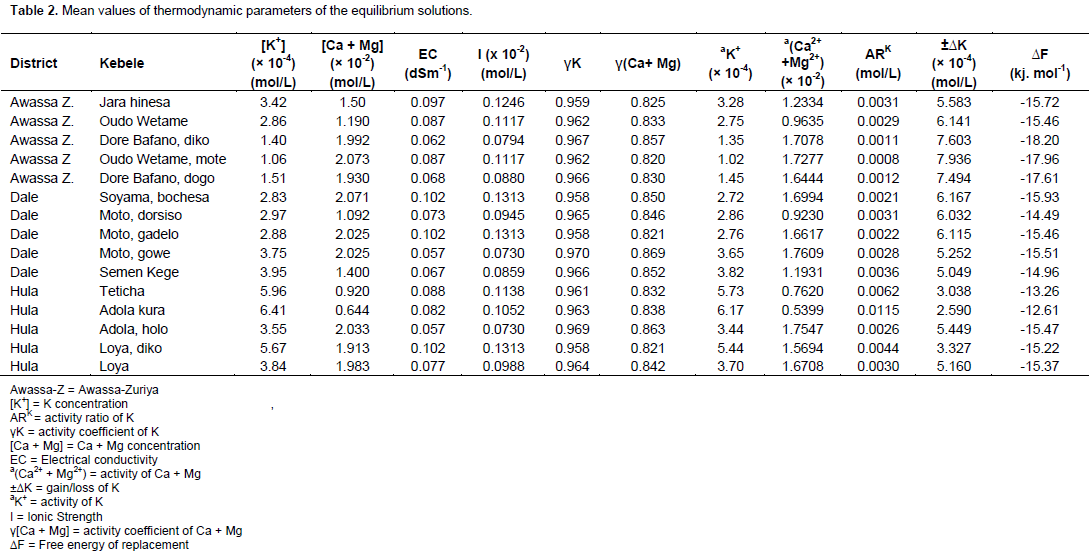
The mean values of parameters in the equilibrium solutions are presented in Table 2. In the table, the mean K+ concentration in moles/L ranged from 1.06 × 10⁻⁴ (Awassa-Zuriya district, Oudo wetame village) to 6.41 × 10⁻⁴ (Hula district, Adola kura village). The Hula district, Adola kura, Teticha and Loya diko village soils had high K+ concentrations and K activity. The Ca and Mg concentrations ranged from 0.644 × 10⁻² to 2.073 × 10⁻² moles/L and in the range, Awassa-Zuriya district, Oudo Wetame mote, Hula district Adola holo, Dale district, Soyama Bochesa, Moto gadelo and Moto gowe village soils had high values. On the contrary, the Hula district, Teticha and Adola kura village soils had low values. However, the activity coefficients for both [K+] and [Ca2+-Mg2+] did not vary significantly; while the opposite can be said of the activity of both K and Ca-Mg. According to Affinnih et al. (2014), soil K+ concentration can be used to assess the K status of soils.
K intensity
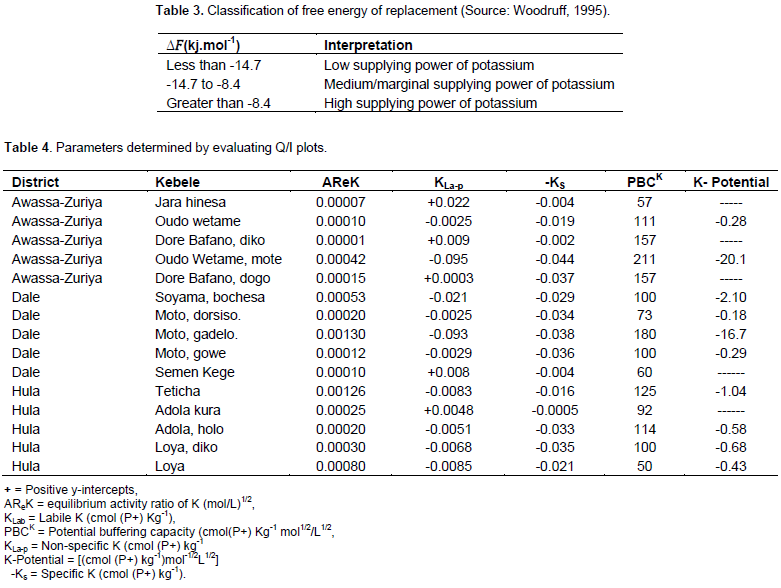
The availability of potassium is satisfactorily estimated from the activity ratio of K (ARK) in a solution in equilibrium with a soil. Activity ratio (ARK) is a measure of the intensity (I) of labile K in the soil and represents the K that is immediately available to crop roots. From Table 2, the mean values of ARK ranged from 0.0008 to 0.0115 moles/L and increased with increasing concentrations of the equilibrating solutions. The range reported here is lower than those reported for some soils: 0.2231 to 0.5394 for Ghana soils (Yawson et al., 2011), 0.00174 to 0.0199 for Iran soils (Abaslou and Abtahi, 2008) and 0.0071 to 0.0320 for Egypt soils (Mahdy and Abu El-Eyuoon, 2017). Reason for these variations could be due to differences in the concentration of equilibrating solutions, equilibration time, the Ca and/or Mg contents and the differences in the mineralogy of the soils. Quantity/Intensity plots are presented in Table 4. In Table 4, Awassa-Zuriya district, Oudo Wetame mote village soil showed high value (-0.095 (mol/L)1/2) of Planar K (easily exchangeable K or non-specific K) indicating the high release of K into soil solution. The lowest value, -0.0025.
K quantity
The quantity factor or gain/loss of K (±âˆ†K) indicates the non-exchangeable and total elemental K reserves. It ranged from 0.000259 (Hula district Adola kura village) to 0.000794 moles/L (Awassa-Zuriya Oudo Wetame mote village). It was observed during the equilibration analysis that these values also increased with increasing concentrations of the equilibration solutions. Obviously, unlike the variation in intensity values (0.00329 ± 0.00265), the variation in the quantity values for the soils is not wide (0.000562 ± 0.000163). However, the range is lower than those reported for some soils: 1.3302 to 1.3327 for Ghana soils (Yawson et al., 2011), 0.001 to 0.0025 for Indian soils (Lalitha and Dhakshinamoorthy, 2015), and 0.00005 to 0.0031 for Poland soils (Bernard et al., 2006).
The free energy of replacement (∆F)
The free energy of replacement that is used to determine the soils K supplying power was determined based on the method in Woodruff (1995) as shown in Table 4. In the table, soils whose ∆F value is lower than -14.7 kj.mol-1 are classified to have poor supplying power of potassium while soils whose ∆F ranges from -14.7 to -8.4 kj.mol-1 have medium supplying power. Lastly, soils whose ∆F value is less than –8.4 kj.mol-1 are classified as poor in replenishing potassium. Values obtained ranged from -18.2 to -12.61 kj.mol-1 and averaged to -15.55 ± 1.53 kj.mol-1. This indicated that soils had poor supplying power of potassium and supplying power varied from soil to soil due to variations in soils’ mineralogical properties.
Parameters obtained from Graphical analysis of Q/I plots and their evaluation
The parameters obtained from evaluations of the(mol/L)1/2 was determined in Dale district Moto dorsiso and Awassa-Zuriya district Oudo wetame villages indicating the soils’ strong ability to absorb K. Moreover, examination of Quantity/ Intensity plots showed that soils of Awassa-Zuriya district, Jara hinesa, Dore Bafano and Dore Bafano diko; soil of Dale district, Semen Kege and soil of Hula district, Adola kura village have positive values (positive y-intercepts). The positive y-intercepts indicate the lack of planar K and strong ability of soils to absorb K. Due to this, K was not desorbed from the non-specific binding sites of these soils. Apart from these values, the rest soils have negative values of planar K indicating more K release into soil solution (Jalali, 2007). Specific potassium (Ks) is the quantity of potassium held on specific edges or peripheral interstices of stacks of clay plates (Holzmueller et al., 2007). This potassium was determined by extrapolating quantity-intensity (Q/I) curves to the ordinates (Figure 2). Values of Ks ranged from -0.0005 to -0.044 (mol/L)1/2 (Table 3). In the range, the lowest value was determined in Hula district Adola kura village soil, and Awassa-Zuriya district, Oudo Wetame mote village soil showed the highest. The highest Ks value in Awassa-Zuriya district could be due to high clay content (46%). On the contrary, the lowest Ks value of Hula district soil might be due to low clay content and high acidic reaction pH (4.7).
Moreover, somewhat less from the highest Ks values were obtained in soils of Hula district Loya diko and Adola holo; in soils of Dale district Moto gadelo, Moto gowe and Moto dorsiso and in soils of Awassa-Zuriya district Dore Bafano diko and Oudo wetame mote villages. The Ks values of these soils also indicate high K fixing capacity that demands plants to apply more energy to take up potassium. On the other hand, the inverse can be said for soils with low Ks values in Awassa-Zuriya district Dore dogo and Jara hinessa, and in Dale district Semen Kege and in Hula district Adola kura villages. Potential buffering capacity (PBCK) expresses the ability of a soil to maintain a supply of K as crop use or leaching decreases the content of K in solution and is proportional to CEC. Although PBCK often leads to low K intensity, a high value is indicative of greater capacity of the soil to maintain K for longer periods. On the other hand, soils having low PBCK require frequent K fertilization since such soils fail to maintain a given supply of K for a considerable period of time (Wang et al., 2004). The PBCK values varied from 50 (Hula district Loya village) to 211 (Awassa-Zuriya district Oudo Wetame M. village (Table 4). According to Zharikova (2004), the values of PBCK in cmol (p+) kg-1 were rated as very low (<20), low (21 to 50), medium (51 to 100), elevated (101 to 200) and high (> 200). Based on the rate, the Awassa-Zuriya district, Oudo Wetame, Dore Bafano diko, Dore dogo, the Hula district, Adola holo, Teticha and the Dale district, Moto gadelo village soils had elevated buffering potential.
On the other hand, soils of the Awassa-Zuriya district, Jara hinessa, the Hula district, Adola kura and Loya and the Dale district, Moto dorsiso, Moto gowe, Soyama bochessa and Semen Kege villages indicated medium buffering potential. On the contrary, soils of the Hula district, Loya diko and Awassa-Zuriya district, Oudo Wetame M. villages had low and high PBCK, respectively. Soils PBCK values of greater than 200 cmol(p+) kg-1 indicates the lowest percent K saturation (Zharikova, 2001). According to Adinarayana et al. (1987), PBCK correlates positively with ECEC. Hence, the high PBCK of the Awassa-Zuriya Oudo Wetame mote village soil can be attributed to its high ECEC (Table 1) and a low activity coefficient of Ca-Mg (Table 2). Moreover, the elevated PBCK of the Awassa-Zuriya district, Audo Wetame, Dore diko and Dore Bafano dogo, the Dale district, Moto gadelo, the Hula district, Adola holo and Teticha village soils could be attributed to their ECEC, high clay and Ca-Mg contents (Table 1). This suggests a preference for Ca-Mg over K adsorption (Schneider, 1997). The equilibrium activity ratio (AReK) in (mol/L)1/2, derived from the Q/I plots, ranged between 0.00001 (Awassa-Zuriya district Dore diko village) and 0.0013 (Dale district Moto gadelo village and Hula district Teticha village). This range is by far lower than the range obtained by Sharma et al. (2009), 0.00046 to 0.0213 (mol/L)1/2 and the range obtained by Samadi (2012) for two different soil types, 0.0047 to 0.012 and 0.008 to 0.013 (mol/L)1/2, which were reported as declined.
However, the range of AReK in the present study is higher than the suggested minimum range 0.0005 (mol/L)1/2 by Beckett and Webster (1971). Soils of Dale district, Moto gadelo, the Hula district, Loya and Teticha, the Awassa-Zuriya district, Oudo Wetame mote villages had relatively high AReK values and it could be attributed to their high percent organic carbon (Table 1). On the other hand, these soils had low percent K saturation since Caex and Mgex concentrations influenced the overall potassium activity ratios (McLean and Watson, 1985). According to Fergus et al. (2005), in soil having low exchangeable K pool, the intensity (AReK) was reduced by the exhaustive cropping to 0.00047 (mol/L)1/2. In the present study, about 73% of soils indicated AReK values of lower than this minimum. On the contrary, soils of Dale district, Moto gadelo, Hula district, Teticha and Loya and Awassa-Zuriya district, Oudo wetame mote had high values of K intensity. This shows greater tendency to maintain K supply to crops though K could be lost through leaching. The K-potential is the product of non-specific K and PBCK and it indicates K availability in soil solution. From Table 4, the Awassa-Zuriya district Oudo Wetame mote village soil had the highest K-potential and Ks while the Dale district Moto dorsiso village soil showed the lowest K-potential. This confirmed the soil’s lower preference for specific adsorption of K. Soils of Hula district, Adola kura,
Dale district, Semen Kege and Awassa-Zuriya district, Jarra hinesa, Dore Bafano diko and Dore Bafano dogo villages, had no K-potential but low Ks values. In these soils, more K may be fixed at specific adsorption sites and creates a lower PBCK on equilibration (Abaslou and Abtahi, 2008). On the other hand, soils of Awassa-Zuriya district, Audo Wetame mote and Dale district, Moto gadelo villages had high K-potential and Ks. These soils release more K from non-specific (planar) sites, leading to higher PBCK on equilibration. A cross-correlations between the soil properties and the Q/I parameters are presented in Table 5. From Table 5, AReK shows intermediate positive correlation with ECEC. This is expected since ECEC of soils plays a positive role on the availability of plant nutrients. Potential buffering capacity indicates intermediate positive correlation only with Mgex. K-potential shows intermediate negative relationships with Caex and ECEC while intermediate positive relationships existed with pH. This could be due to high concentration of Ca in solution which prevented K from desorbing into soil solution and the same explanation can be given for the relation with ECEC (Diatta et al., 2006). Non-specific K shows intermediate negative correlations with Caex and ECEC. Since non-specific K represents K desorbed from the exchangeable pool, high concentration of Caex in soil solution and high ECEC might reduce the extent of K desorption.
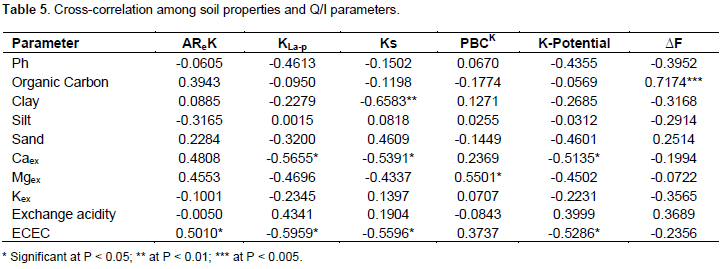
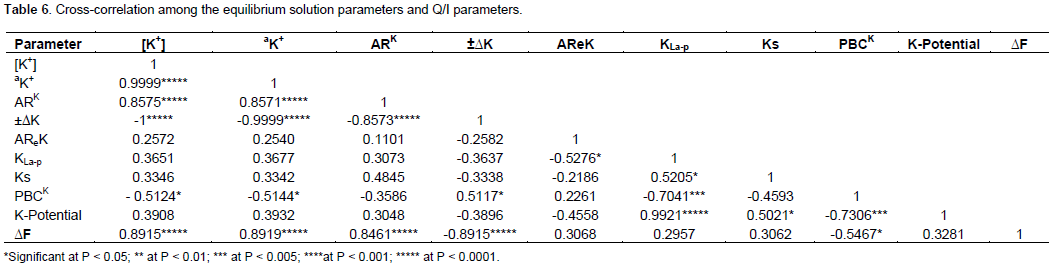
Specific K shows intermediate negative correlations with Clay, Caex and ECEC. This is very convincing that K desorption from specific sites is lowered as clay percent increases and the same can be suggested for Caex and ECEC. Finally, free energy shows an intermediate positive relationship with only organic carbon. This indirectly agrees with Talibudeen (1972) who pointed out the dependence of free energy on CEC which in turn depends on soil organic matter. Lastly, no significant relationships were found among the rest of the soil properties and the Q/I parameters. In Table 6, the results of cross-correlation among equilibrium solution parameters and Q/I parameters are presented. In the table, strong positive correlations were found among [K+], aK, ARK and ∆F. Such associations existed because these parameters explain K status in equilibrium solution. On the other hand, PBCK shows intermediate negative associations with aK and [K+]. This indicates that soils K buffering capacity declines as exchangeable K desorbs while equilibrium K content increases. In agreement to this, ±âˆ†K correlated positively and intermediately with PBCK. Equilibrium K [K+] indicates perfect negative correlation with ±âˆ†K. This shows inverse relation since complete increase in the amount of adsorbed K is accompanied by complete decrease in equilibrium K concentration. Moreover, intermediate positive correlations occurred between Ks and KLa-p, and K-potential and Ks. From this it can be said that Ks is directly proportionate to KLa-p and the same can be said for K-potential and Ks. Furthermore, K-potential shows intermediate negative correlation with PBCK. This indicates the decrease of soils K buffering potential as crop available K increases. Lastly, AReK shows intermediate negative correlation with KLa-p though unexpected.
So far, the evaluation of soil potassium in terms of its availability to crops has been based on the figure obtained using chemical extractants. The problems are however weak correlations found between this K-pool and crop yields. Therefore, identifying, quantifying and monitoring soil properties and K changes are necessary to prevent soil degradation. Supporting this fact, growing researches on this issue are indicating that Quantity-Intensity (Q/I) isotherms provide a better estimation of plant available potassium. Due to this, Quantity/Intensity isotherms were used to evaluate the K dynamics in fifteen selected soils with varying properties representing the enset farm systems of Sidama, south Ethiopia. It was believed that high silt proportion at Awassa-Zuriya district could increased the K adsorption capacity of soils. The higher K ratio (intensity) at Dale and Hula districts obtained while high quantity is measured at Awassa-Zuriya district soils shows that, Awassa-Zuriya district soils have a higher potential to supply K for a longer period of time from the exchangeable pool. On the other hand, the Dale and Hula soils will have high K concentration in solution immediately after K fertilization. Nevertheless, this high K intensity can be rapidly depleted through leaching and/or plant uptake. Moreover, According to the results of previous findings, higher K+ intensity and activity lead to a lower PBCK which is a better indicator of the ability of soil to maintain K intensity. Consequently, the Dale and Hula district soils which had higher K intensity will have lower PBCK. Moreover, the Hula and Dale district soils had low potassium saturation. Therefore, the Dale and Hula district soils will require split and frequent K fertilization. On the other hand, the low free energy of replacement values determined indicated poor capacity of soils to supply K with minor exception. This also pointed out that the studied areas require K fertilization to boost crop production. From the graphical analysis of Quantity/intensity plots, nil K-potential was determined for half of the Awassa-Zuriya district samples while low AReK values obtained nearly for all samples. This also pointed out the need for K application in Awassa-Zuriya district. Furthermore, indirect and direct associations existed between soil physico-chemical properties and the Q/I parameters further illuminated light on the behavior of K in soils and simplified the evaluation of its dynamics.
The authors have not declared any conflict of interests.
Authors are very indebted to International Potash Institute (IPI) for covering all research expenses and their devotion to support food insecure society through very indispensible and timely researches on potassium status of soils.
REFERENCES
|
Abaslou H, Abtahi A (2008). Potassium quantity intensity parameters and it with selected soil properties in some soils of Iran. J. Appl. Sci. 8(10):1875-1882.
Crossref
|
|
|
|
Abebe T, Wiersum KF, Bongers E (2010). Spatial and temporal variation in crop diversity in agroforestry homegardens of southern Ethiopia. Agrofor. Syst. 78:309-322.
Crossref
|
|
|
|
|
Adinarayana V, Subba Rao A, Krishna Reddy B, Subba Rao IV (1987). Relationships between Q/I parameters of potassium and some characteristics of soils of Nellore district, Andhra Pradesh. The Andhra Agric. J. 34:128-131.
|
|
|
|
|
Affinnih KO, Salaw IS, Isah AS (2014). Methods of Available Potassium Assessment in Selected Soils of Kwara State, Nigeria. 14:1.
|
|
|
|
|
Al-Zubaidi A, Yanni S, Bashour I (2008). Potassium status in some Lebanese soils. Lebanese Sci. J. 9(1):81-97.
|
|
|
|
|
Askegaard M, Eriksen J, Olesen JE (2003). Exchangeable potassium and potassium balances in organic crop rotations on a coarse sand. Soil Use Manage. 19:96-103.
Crossref
|
|
|
|
|
Bansal SK, Rao CS, Pasricha NS, Imas P (2002). Potassium dynamics in major benchmark soil series of India under long - term cropping. 17th World Congress of Soil Science, Bangkok, Thailand.
|
|
|
|
|
Beckett PHT (1964). Studies on soil potassium. I. Confirmation of ratio law: Measurement of labile potassium in the soil. J. Soil. Sci. 15:9-23.
Crossref
|
|
|
|
|
Beckett PHT, Webster R (1971). Soil variability: A review. Soil Fert. 34:1-15.
|
|
|
|
|
Bernard JD, Kociałkowski ZW, Grzebisz W (2006). Evaluation of potassium quantity-intensity parameters of selected polish agricultural soils. Electronic J. Pol. Agric. Univ. Agron. 9:4.
|
|
|
|
|
Biratu AA, Asmamaw DK (2016). Farmers' perception of soil erosion and participation in and water conservation activities in the Gusha Temela watershed, Arsi, Ethiopia. Int. J. River Basin Manage. 14:329-336.
Crossref
|
|
|
|
|
Bogunovic I, Bilandzija D, Andabaka Z, Stupic D, Comino JR, Cacic M, Brezinscak L, Maletic E, Pereira P (2017). Soil compaction under different management practices in a Croatian vineyard. Arab. J. Geosci. 10:1-9.
Crossref
|
|
|
|
|
Bouyoucos GJ (1951). Recalibration of hydrometer method of mechanical analysis of soil. Agron. J. 43(2):434-435.
Crossref
|
|
|
|
|
BWB (2012). A guide to flame photometer analysis. Version 1.0 – 16, BWB Technologies UK Ltd.
View
|
|
|
|
|
Cerdà A, Rodrigo-Comino J, Giménez Morera A, Keesstra SD (2017). An economic, perception and biophysical approach to the use of oat straw as mulch in Mediterranean rainfed agriculture land. Ecol. Eng. 108PA:162-171.
Crossref
|
|
|
|
|
Davis CW (1962). Ion Association. Butterworths, London, England.
|
|
|
|
|
David C (2015). Soils and Plant Nutrients Extension Gardener Handbook Retrieved from:
View
|
|
|
|
|
Diatta JZ, Waclaw M, Grezebisz W (2006). Evaluation of potassium quantity- parameters of selected Polish agricultural soils. Agronomy 9:4-15.
|
|
|
|
|
EthioSIS (Ethiopia Soil Information System) (2014). Soil fertility status and fertilizer recommendation atlas for Tigray regional state, Addis Ababa, Ethiopia
|
|
|
|
|
Evangelou VP, Blevins RL (1998). Effect of longterm tillage systems and nitrogen addition on K quantity-intensity relationships. Soil Sci. Soc. Am. J. 52:1047-1054.
Crossref
|
|
|
|
|
Food and Agriculture Organization (FAO) United Nations Educational, Scientific and Cultural Organization (UNESCO) (FAO-UNESCO) (1997). FAO-UNESCO soil map of the world. Revised legend with correction and updates. Technical paper 20, ISRIC Wageningen.
|
|
|
|
|
Fergus IF, Martin EA, Little IP, Haydock KP (2005). Studies on soil potassium: II. The Q/I relation and other parameters compared with plant uptake of potassium. Aust. J. Soil Res. 10(1):95-111.
Crossref
|
|
|
|
|
Frissel MJ (1978). Cycling of mineral nutrients in agricultural ecosystems. Elsevier B.V., Amsterdam, Netherlands.
|
|
|
|
|
Garedew B, Ayiza A, Haile B, Kasaye H (2017). Indigenous Knowledge of Enset (Ensete ventricosum Cheesman) Cultivation and Management Practice by Shekicho People, Southwest Ethiopia. J. Plant Sci. 5(1):6-18.
|
|
|
|
|
Hussen A (2007). PhD Thesis, Addis Ababa University, Addis Ababa.
|
|
|
|
|
Holzmueller EJ, Jose S, Jenkins MA (2007). Influence of calcium, potassium, and magnesium on Cornus florida L. density and resistance to dogwood anthracnose. Plant Soil 290:189-199.
Crossref
|
|
|
|
|
Jackson ML (1973). Soil chemical analysis. Prentice Hall of India (P) Ltd., New Delhi.
|
|
|
|
|
Jalali M (2007). A study of the Quantiti/Intensity relationships of potassium in some calcareous soils of Iran. Arid Land Res. Manage. 21(2):133-141.
Crossref
|
|
|
|
|
Laekemariam F (2015). Soil spatial variability analysis, fertility mapping and soil plant nutrient relations in wolaita zone, Southern Ethiopia. Ph.D Thesis. Haromaya University Ethiopia.
|
|
|
|
|
Lalitha M, Dhakshinamoorthy M (2015). Quantity-intensity characteristics of Potassium (K) in relation to potassium availability under different cropping system in alluvial soils. Afr. J. Agric. Res. 10(19):2097-2103.
Crossref
|
|
|
|
|
Lalitha M, Dhakshinamoorthy M (2013). Forms of soil potassium-a review. Afr. J. Agric. Res. 35(1):64-68.
|
|
|
|
|
Landon JR (2014). Booker tropical soil manual: A handbook for soil survey and agricultural land evaluation in the tropics and subtropics. Routledge, Abingdon, UK 532p.
|
|
|
|
|
Lindsay WL (1979). Chemical Equilibria in Soils. Join Wiley, New York.
|
|
|
|
|
Mahdy HH, Abu El-Eyuoon AZA (2017). Evaluation of Potassium Quantity- Intensity in some Soils of El-Dakhla Oasis, New Valley, Egypt.
View
|
|
|
|
|
McLean ED, Watson ME (1985). Soil measurements of plant available potassium. In: R.D. Munson (Ed.). Potassium in Agriculture. ASA-CSSA-SSSA, Madison, WI., USA. pp. 277-308.
|
|
|
|
|
Mehlich A (1984). Mehlich III soil test extractant: A modification of Mehlich II extractant. Comm. Soil Sci. Plant Anal. 15:1409-1416.
Crossref
|
|
|
|
|
Mutscher H (1995). Measurement and Assessment of Soil Potassium. Inter. Potash Inst., Basel/Switzerland. IPI Research Topics, No. 4.
|
|
|
|
|
Raheb A, Heidari A (2012). Effects of clay mineralogy and physicochemical properties on potassium availability under soil aquic conditions. J. Soil Sci. Plant Nutr. 12(4):747-776.
|
|
|
|
|
Rodrigo-Comino J, Senciales González JM, Ramos MC, Martínez-Casasnovas JA, Lasanta Martínez T, Brevik EC, Ries JB, Ruiz-Sinoga JD (2017). Understanding soil erosion processes in Mediterranean sloping vineyards (Montes de Málaga, Spain). Geoderma 296:47-59.
Crossref
|
|
|
|
|
Romheld V, Kirkby EA (2010). Research on potassium in agriculture; needs and prospects. Plant Soil 335:155-180.
Crossref
|
|
|
|
|
SAS institute (2012). User's Guide. SAS/STAT® 9.3. Statistical Procedures, Second edition. SAS institute inc, Cary, NC, USA.Schneider A (1997). Influence of soil solution Ca concentration on short-term K release and fixation of a loamy soil. Eur. J. Soil Sci. 48:513-522.
|
|
|
|
|
Sharma A, Jalali VK, Vivak M, Arya, Pradeep R (2009). Distribution of various forms of Potassium in soils representing intermediate zone of Jammu region. J. Indian Soc. Soil Sci. 57(2):205-207.
|
|
|
|
|
Sidama Zone Planning and Economic Development Department (SZPEDD) (2010). Sidama Administrative zone: A socio-economic profile. Awassa, Ethiopia.
|
|
|
|
|
Talibudeen O (1972). Exchange of potassium in soils in relation to other cations. 9th Colloq. of the International Potash Institute, Berne, Switzerland pp. 97-110.
|
|
|
|
|
Tucker BB, Kurtz LT (1961). Calcium and Magnesium Determinations by EDTA Titrations1. Soil Sci. Soc. Am. J. 25:27-29.
Crossref
|
|
|
|
|
Uddin MS, Abedin MMJ, Islam MR, Saleque MA, Islam MS (2011). Potassium status of four rice growing soils of Bangladesh. Bangl. J. Agric. Res. 36(4):633-646.
|
|
|
|
|
Walkley A, Black IA (1934). An examination of the Degtjareff method for determining soil organic matter and a proposed modification of the chromic acid titration method. Soil Sci. 37:29-38.
Crossref
|
|
|
|
|
Wang JJ, Dustin LH, Paul FB (2004). Potassium buffering characteristics of three soils low in exchangeable potassium. Soil Sci. Soc. Am. J. 68:654-661.
Crossref
|
|
|
|
|
Woodruff CM (1995).The energy of replacement of calcium by potassium in soils. Soil Sci. Soc. Am. Proceed. 19:167-171.
Crossref
|
|
|
|
|
Woodruff CM (1955). Ionic Equilibria Between Clay and Dilute Salt Solutions. Soil Sci. Soc. Am. Proc. 19:36.
Crossref
|
|
|
|
|
Yawson DO, Kwakye PK, Armah FA, Frimpong KA (2011). The dynamics of potassium (k) in representative soil series of Ghana. ARPN J. Agric. Biol. Sci. 6(1):1990-6145.
|
|
|
|
|
Yong-Hong L (2010). Effects of potassium behaviour in soils on crop absorption. Afr. J. Biotechnol. 9(30):4638-4643.
|
|
|
|
|
Zharikova EA (2004). Potential Buffer Capacity of Soils with Respect to Potassium (by the Example of the Amur River Region). Euro. Soil Sci. 37(7):710-717.
|
|
|
|
|
Zharikova EA (2001). In Ecological Risk: Proceedings of the 2nd All-Russia Conference P 166.
|
|