ABSTRACT
Beressa is a major perennial river in the North Shewa Zone of Amhara regional state and it takes the north-west ward to join the Jema River, which form the tributary of the Blue Nile around a place known as Sundo Meskel near the lower side of Abay Bereha. On its natural flow way, the River provides different uses that can be determined in terms of environmental, economical and social values. However, the River is facing an interruption on its potential service especially for irrigation due to its quality deterioration by the discharge of untreated wastes from different sectors in the town of Debre Berhan. Thus, this study was conducted to reveal the impact the river water quality on the chemical properties of the irrigated soils along the river bank. On the bases of their position and extent of water pollution, three different farms were identified and representative soil samples were collected from each for laboratory analysis. All the soils were clay loam in texture with the lowest amounts of pH (6.10), electrical conductivity (EC) (0.10 dS cm-1), organic matter (OM) (3.46%), total N (0.22%), C:N (9.12), available P (30.35 mg kg-1), cation exchange capacity (CEC) (23.75 cmol(+) kg-1), Na (0.11 cmol(+) kg-1), K (0.73 cmol(+) kg-1), Ca (8.25 cmol(+) kg-1), Mg (4.32 cmol(+) kg-1), Cu (1.19 mg kg-1), Zn (2.18 mg kg-1), Cr (1.15 mg kg-1) and Pb (1.11 mg kg-1) at farm 2 (never been irrigated from the River water), and had no detected Cd, Ni, As and Hg. Therefore, in addition to the difference in agronomic management practices, the River water had a direct connection with almost all presences of the concerned chemicals specifically in the soils of irrigated farms. Eventually, conducting pollution remediation studies is as such important in curing the current illness in the Beressa River water and in some instances in the soils under irrigation.
Key words: Water quality, heavy metals, micronutrients, soil chemical compositions.
Unsafe industrial and municipal wastes can introduce hazardous chemicals into the environment which cause ecological imbalance and health problems (Pierzeynski et al., 2000). These wastes, although useful as a source of nutrients, are also sources of carcinogens and toxic me-tals (Zhen-Guo et al., 2002). Unwise and poorly practiced urban and industrial activities can degrade the physical, chemical and biological properties of the soil and in many cases they irreversibly reduce its multi functionality (Blum, 1996). Moreover, undesirable and over use of agricultural chemicals has different effects on fertility and productivity of the soil and quality of fauna and flora in the ecosystem. For example, triclopyr inhibits soil bacteria that transform ammonia into nitrite (Pell et al., 1998). Glyphosate reduces the growth and activity of free-living nitrogen-fixing bacteria in soil (Santos and Flores, 1995) and 2,4-D reduces N fixation by reducing the growth and activity of bacteria that live on the roots of bean plants (Fabra et al., 1997).
Excess entrance of inorganic pollutants into the soil reduces the natural filtering and buffering capacity of the soil (Blum, 1996) and according to Ma and Rao (1997), the function of the soils in the ecosystem is affected. For instance, a polluted soil causes a pressure on sensitive microorganisms and changes their diversity and population size (Zaguralskaya, 1997; Pawlowska and Charvat, 2004). Moreover, pollution reduces the fertility status of a soil which finally affects the quality of food products (McGrath, 1996). According to Sawyer and McCarty (1978), organic pollutants with high chemical oxygen demand (COD) levels comprise a reduced chemical species (Fe, Mn and S) which determine the quality of the soils to support life. Most of the time, atmospheric and aquatic pollutants finally come back to soil and has different effects on plants and animals (Miller and Gardiner, 1998) and make the soil pollution to be more serious than both water and air pollutions; because, once the pollutants are accumulated in the soil, they may require centuries to be removed through leaching, plant uptake, erosion or other means to alleviate (Basta and Tabatabai, 1992).
Beressa is a major perennial River in the North Shewa Zone of Amhara Regional State with a maximum and minimum discharges of 58.78 and 0.40 m3 s-1 in August and January, respectively (MoWR, 1995). The River has a total catchment area of 211 km2 and a source on the Qundi highlands at about 30 km east of Debre Berhan town and takes the north-west ward to join the Jema River, which form the tributary of the Blue Nile around a place known as Sundo Meskel near the lower side of Abay Bereha. In its flow of natural way, the River has different purposes that can be determined in terms of environmental, economical and social values. For instance, it is mainly used for irrigated commercial vegetable production during dry season.
However, the River is facing an interruption on its po-tential service due to unwise and uncontrolled discharge of liquid and solid wastes from municipality and industries which resulted from ignorance or non-ethical attitude, lack of environmental impact assessment, lack of awareness and absence of control measures. According to Negash et al. (2011), the River has been polluted with oxygen demanding wastes (biological oxygen demand/BOD and chemical oxygen demand/ COD), water soluble inorganic chemicals (acids, salts and heavy metals such as Cd, Cr, Pd, Ni, As and Hg), inorganic plant nutrients (water soluble nutrients and phosphate), organic chemicals (plastics, pesticides), sediment or suspended matter and thermal pollution (using River water for cooling process).
All the aforementioned inconvenient conditions create an opportunity for deterioration of the water quality for various domestic uses and in turn affect the property (physical, chemical and biological) of the soils under irrigation and the plants grown on these soils. Thus, this study was initiated and conducted with a specific objective:
- To reveal the impact of the Beressa River water quality on the chemical properties of soils along its bank.
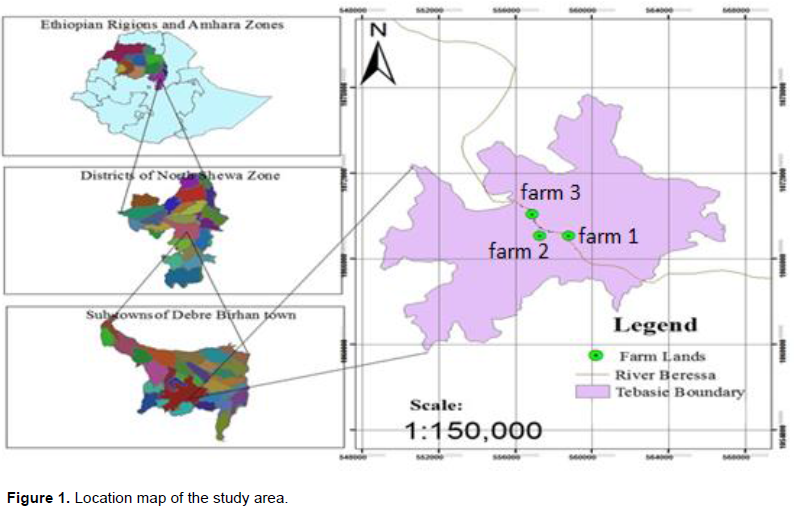
Description of the study area
The study was conducted at Tebasie sub-town of Debre Berhan town which is located at 09° 35' 45'' to 09° 36' 45'' North latitude and from 39° 29' 40'' to 39° 31' 30'' East longitude and found at 125 km North east of Addis Ababa with an elevation ranging between 2800 and 2845 meters above sea level. The twenty seven (27) years (1985 to 2011) data obtained from the Ethiopian National Meteorological Agency indicates that, the area receives a mean annual rainfall of 927.10 mm and characterized by a unimodal rainfall pattern with a maximum (293.02 mm) and minimum (4.72 mm) peaks in August and December, respectively. The mean monthly maximum and minimum temperature range from 18.3 to 21.8°C and from 2.4 to 8.9°C, respectively.
Site selection, sample collection and preparation
Three different farm sites were selected based on their position and exposure to pollution; one was the Debre Berhan University’s Research and Demonstration Field (Farm 2) that has never been irrigated by the Beressa River water, the rest two were the different farms around the Eyerusalem (Farm 1) and Tera (Farm 3) vegetable farms that are located at the upper and down streams of the River on its way through the Tebasie sub-town (Figure 1). These two sites have been under irrigation by the River water especially at the time of dry season for commercial vegetable crop production. Representative soil samples were collected from each farm by considering the slope gradient (bottom, medium and upper) and other visual variability (soil colour, farm management and plantation) in a zigzag pattern at a depth of 0 to 20 cm using an auger, with an interval of ten steps and above fifteen spots per single farm. Then, it was air dried on a clean plastic tray at a room temperature for about eight weeks in a dust free atmosphere and mixed properly on a 2 m by 2 m plastic sheet to make a composite sample. The soil samples were ground by using mechanical grinder and were passed through a 2 mm sieve in preparation for laboratory analysis.
Laboratory analysis
The soil pH was determined in H2O using a 1:2.5 soil to water ratio (Van Reeuwijk, 1993). Electrical conductivity was measured by conductivity meter on saturated soil paste extracts obtained by applying suction (Okalebo et al., 2002). Organic carbon of the soils was determined following the wet digestion method as described by Walkley and Black (1934), while the percentage organic matter (OM) of the soils was determined by multiplying the percent organic carbon value by 1.724. Total N was determined by the micro-kjeldahl digestion, distillation and titration method and the available P was determined using the Olsen extraction method (Olsen et al., 1954).
Cation exchange capacity (CEC) was determined at soil pH level of 7 after displacement by using 1 N ammonium acetate method in which it was, thereafter, estimated titrimetrically by distillation of ammonium that was displaced by sodium (Chapman, 1965). The exchangeable bases (Ca, Mg, Na and K) in the soil were determined from the leachate of 1 molar ammonium acetate (NH4OAc) solution at pH 7. Exchangeable Ca and Mg were determined by atomic absorption spectrophotometer, while K and Na were read using flame photometer (Rowell, 1994). Percent base saturation was calculated as the ratio of the sum of the base forming cations (Ca, Mg, Na and K) to the CEC of the soil and multiplied by 100.
As described by Lindsay and Norvell (1978), extractable micronutrients (Fe, Mn, Zn and Cu) and heavy metals (Cd, Cr, Pb, As, Ni and Hg) contents were extracted from the soil samples with DTPA and aqua ragia digestion, respectively, and all were quantified by flame atomic absorption spectrometry (AAS). Moreover, soil particle size distribution was determined by the Bouyoucos hydrometer method after destroying the OM using hydrogen peroxide (H2O2) and dispersing the soil with sodium hexametaphosphate (NaPO3) (Bouyoucos, 1962).
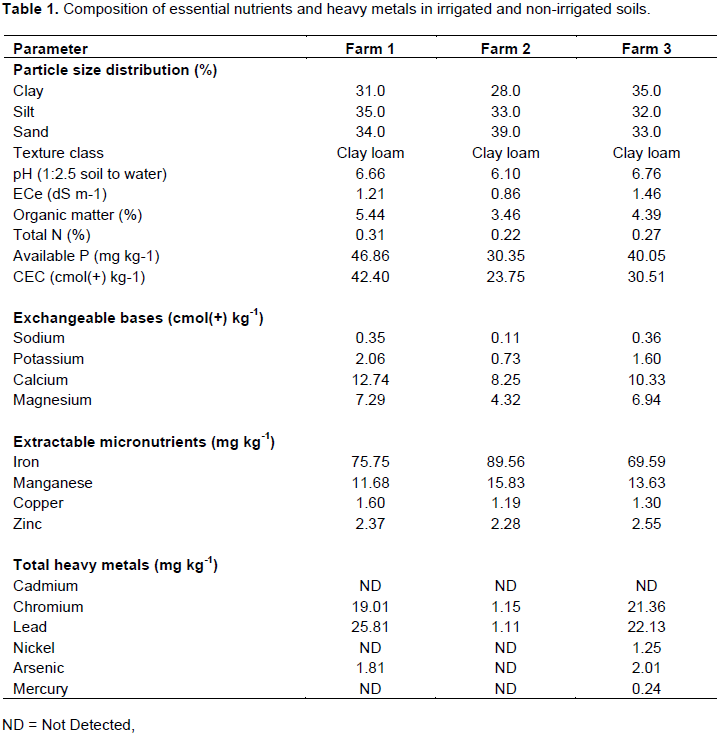
The soil textural class of all farms was clay loam with relatively high silt (35.0%), sand (39.0%) and clay (35.0%) compositions at Farms 1, 2 and 3 (Figure 1), respectively (Table 1). According to Ranst (1991), soil texture is a stable characteristic that influences the physical and chemical properties of the soils depending on the nature and amounts of clay and organic matter. Having a similar texture implied that the quality of the Beressa River water had nothing to do with the textural class of the soils. However, the River might have a concern on the distribution of particle size at the soil surface; because the farms along the bank had a relatively higher amount of easily transported finer soil particles (clay and silt) that probably modify the textural class through a time. The texture of a soil may be modified due to the removal of finer particles by erosion; leaching and mixing up of surface plus sub-surface soils during mechanical tillage and other management practice (Wakene, 2001).

The soil pH values were 6.66, 6.10 and 6.76 at farms 1, 2 and 3 (Figure 1), respectively (Table 1) that was found as neutral (6.6 to 7.3) and slightly acidic (6.1 to 6.5) (Bruce and Rayment, 1982). The two concerned farms would have a connection with the river through irrigation, due to its slightly alkaline pH (Awgchew et al., 2015). Irrespective of their nutrient adsorption, solubility and exchanging differences, soils having a pH value between 5.5 and 8 are considered as ideal for plant growth (Gazey and Davies, 2009).
The electrical conductivity of saturated extracts (ECe) values of the soils at farms 1, 2 and 3 were 1.21, 0.86 and 1.46 dS m-1, respectively (Table 1) that found under a non saline (< 2 dS m-1) range (USSLS, 1954). Eventhough the river water had no effect of salinity, it was possible to say that the river had some relation with the irrigated soils; because as indicated by Awgchew et al. (2015), there was a detectable amount of salinity in the water near the irrigated farms that directly brought a relatively higher ECe values for the irrigated soils than non-irrigated one and also from the irrigated farms, Farm 1 (Figure 1) had the lower salinity.
The amounts of organic matter (OM) in the soils of Farms 1, 2 and 3 (Figure 1) were 5.44, 3.46 and 4.39%, respectively (Table 1) that were under very high (> 5.15%) and high (3 to 5.15%) ranges (Charman and Roper, 2007). Generally, the irrigated soils had higher amount of OM than the non-irrigated but the Beressa River had no negative concern on the OM content of the irrigated farms; because according to Awgchew et al. (2015), the concentrations of oxygen demanding organic pollutants (COD and BOD) in the water taken from the sites near farm 1 were very low.
The amounts of total nitrogen (TN) were 0.31, 0.22 and 0.27% in the soils of Farm 1, 2 and 3 (Figure 1), respectively (Table 1) and were under high (0.25 to 0.50%) and medium (0.15 to 0.25%) ranges (Bruce and Rayment, 1982). Moreover, the C:N of these farms were 10.18, 9.12 and 9.43 accordingly that found under low (10 to 15) and very low (< 10) ranges (Newey, 2006) with a fairly good (8:1 to 15:1) level of C: N (Prasad and Power, 1997). In addition to the differences in the type, source, amount and rate of applying OM and N containing fertilizers, the Beressa River water might contribute a little for the TN content of the irrigated soils; because, there were significant amount of ammonia and nitrate in the water samples near Farms 1 and 3 (Awgchew et al., 2015).
The amounts of available P were 46.86, 30.35 and 40.05 mg kg-1 in the soils of Farms 1, 2 and 3 (Figure 1),
respectively (Table 1) and were found under very high (> 25 mg kg-1) range (Holford and Cullis, 1985). Nevertheless, the Beressa River water might have a connection with the detected amounts of available P in the irrigated soils; because, relatively the higher detections were in the irrigated soils (Farm 1 and 3) and phosphate was one of the pollutants in the river (Negash et al., 2011; Awgchew et al 2015). However, the differences could arise either from the current P status (indigenous/native P) in the soil and/or from the previous P fertilizer application (residual P) (Indiati, 2000) or from the variations in vegetation cover, biomass production and nutrient cycling (Solomon et al., 2002). Moreover, the physico-chemical properties (the nature and amount of soil mineral, soil pH, cation and anion effects, reaction time and temperature) of soils were reported to influence the availability and adsorption of P in the soil (Landon, 1991; Tisdale et al., 1993).
The values of cation exchange capacity (CEC) (42.40, 23.75 and 30.51 cmol(+) kg-1) and percentage base saturation (PBS) (52.93, 56.46 and 63.03%) were recorded at Farms 1, 2 and 3, respectively (Table 1). According to Metson (1961), the CEC were under very high (> 40 cmol(+) kg-1), moderate (12 to 25 cmol(+) kg-1) and high (25 to 40 cmol(+) kg-1) ranges while the PBS were under moderate (40 to 60%) and high (60 to 82%) ranges. Generally, CEC is derived from the clay and OM fractions (Landon, 1991) and can be affected by the different soil management practices such as cultivation, fertilization and irrigation (Gao and Chang, 1996). This means, the River water might act indirectly on the CEC of the Farm 1 and 3 soils, irrigated, (Figure 1) through irrigation that led to redistribution of finer soil particles and increasing of OM level. The contents of Na were 0.35, 0.11 and 0.36 cmol(+) kg-1 in the soils of Farms 1, 2 and 3, respectively (Table 1) and were in moderate (0.3 to 0.7 cmol(+) kg-1) and low (0.1 to 0.3 cmol(+) kg-1) ranges (Metson, 1961). Even though, the concentration of Na in the Beressa River was below the maximum permissible limit, there was a significant amount in the water near the two irrigated farms, Farms 1 and 3, (Figure 1) (Awgchew et al., 2015) that could have a direct concern with the relatively raised levels in soils upon irrigation.
The lowest (0.73 cmol(+) kg-1) K content was recorded in the soils of Farm 2 while the highest (2.06 cmol(+) kg-1) at Farm 1 (Table 1). In addition to the difference in the amount and extent of ash application, previous plantation and farm management practices, the river water might have a connection with the raised amounts in the irrigated soils (Farm 1 and 3, Figure 1); because the concentration of K in the water near the two irrigated farms was a little below its maximum permissible limit (Awgchew et al., 2015). However, all the soils had no problem of K shortage and were under very high (> 2 cmol(+) kg-1) and high (0.7 to 2 cmol(+) kg-1) ranges (Metson, 1961).
The amounts of Ca and Mg were 12.74, 8.25 and 10.33 cmol(+) kg-1 and 7.29, 4.32 and 6.94 cmol(+) kg-1 in the soils of Farms 1, 2 and 3 (Figure 1), respectively (Table 1) at which the Ca found under the range of moderate (5 to 10 cmol(+) kg-1) and high (10 to 20 cmol(+) kg-1) while the Mg under high (3 to 8 cmol(+) kg-1) range (Metson, 1961). The higher presence of these two elements in the soils of the two irrigated farms (Farms 1 and 3, Figure 1) was possibly due to the River water; because there were a significant amount of Ca and Mg in the water near the irrigated farms (Awgchew et al., 2015) and even upon repeated irrigation, their bicarbonate from the river water might precipitate and concentrate them in the soil solution as carbonate.
The highest amounts of Fe (89.56 mg kg-1) and Mn (15.83 mg kg-1) were recorded in the soils of the non-irrigated farm (Table 1). But, they were under high (5.1 to 250 mg kg-1) Fe and medium (10 to 20 mg kg-1) ranges Mn, respectively (Jones, 2003). The River could have no concern with the detected amounts of Fe and Mn in the soils of the irrigated farms (Farms 1 and 3, Figure 1); because there was no detection of Fe and Mn in the Beressa River water near these farms (Awgchew et al 2015).
The lowest Cu (1.19 mg kg-1) and Zn (1.11 mg kg-1) concentrations were detected in the soils of Farm 2 (Table 1) at which the Cu was under low (0.3 to 2.5 mg kg-1) while the Zn under high (1.1 to 10 mg kg-1) ranges (Jones, 2003). The river water had connection with the amounts of Cu and Zn in the soils of the irrigated farms (Figure 1); because there was a considerable amount of Cu and Zn in the river water near the two irrigated farms (Awgchew et al., 2015) and also the solubility of most micronutrients like Cu, Zn, Mn and Fe is strongly dependent on the soil reaction (Zovoko and Romic, 2011) and form toxic concentrations that hinder plant growth (Miller and Donahue, 1995). Moreover, differences in soil temperature, wetting and drying, tillage practices, redox process, liming and organic matter maintenance can affect the availability of micronutrients in the soil (Fisseha, 1996). Cadmium was not detected in the soils of all farms (Table 1) and neither in the water around the two irrigated farms (Farms 1 and 3, Figure 1) (Awgchew et al., 2015) implying that there was no worry of Cd. On the other hand, the two higher (19.01 and 21.36 mg kg-1) amounts of Cr were recorded in the soils of Farms 1 and 3, respectively (Table 1). But, all the soils of each farm were below the maximum tolerable limit of 100 mg kg-1 (USEPA, 1995). This means, the river might be a source of Cr in the irrigated farms; because there was a detected concentration in the water near these farms (Awgchew et al., 2015; Negash et al., 2011).
The amounts of Pb were 25.81 and 22.13 mg kg-1 in soils of irrigated farms and 1.11 mg kg-1 in the soils of non-irrigated farm (Table 1) at which all the soils were below the maximum tolerable limit of 150 mg kg-1 (USEPA, 1995). The Beressa River appeared to have connection with the detected levels of Pb in the irrigated farms (Farm 1 and 3, Figure 1); because it was the one among the pollutant in river water (Awgchew et al., 2015; Negash et al., 2011). Basically, Ni was not detected in the soils of Farms 1 and 2 and was 1.25 mg kg-1 at Farm 3 (Table 1) which was below the maximum tolerable limit of 60 mg kg-1 (USEPA, 1995). The River water could be a factor for the presence in the soils of Farm 3 (Figure 1); because the amount in the water near this farm was relatively higher (Awgchew et al., 2015; Negash et al., 2011).
In soils of the non-irrigated farm (Farm 2, Figure 1), it was not detected but was 1.81 and 2.01 mg kg-1 in the soils of Farms 1 and 3, respectively (Table 1). Addi-tionally, Hg was not detected at Farms 1 and 2 and was 0.24 mg kg-1 at Farm 3 (Table 1). However, the detected As and Hg were below their respected maximum tolerable limit of 20 and 1 mg kg-1, respectively(USEPA, 1995). The Beressa River might be blamed for the presence of As in the soils of Farms 1 and 3 and that of Hg in the soils of Farm 3; because they were detected in the water at the sites around the concerned farms and were reported as pollutants in the river (Awgchew et al., 2015; Negash et al., 2011).
There was a difference in the particle size distribution of the soils; however, all were similar in their textural class, clay loam. The soil of the non-irrigated farm was the lowest in its pH, ECe, OM, total N, C:N, available P, CEC, Na, K, Ca and Mg which were 6.10, 0.86 dS m-1, 3.46%, 0.22%, 9.12, 30.35 mg kg-1, 23.75 cmol(+) kg-1, 0.11 cmol(+) kg-1, 0.73 cmol(+) kg-1, 8.25 cmol(+) kg-1 and 2.32 cmol(+) kg-1, respectively. The higher amounts of Fe (89.56 mg kg-1), Mn (15.83 mg kg-1), Cu (1.60 mg kg-1) and Zn (2.55 mg kg-1) were recorded at Farms 2, 2, 1 and 3, respectively. Generally, Cd was not detected in the soils of all farms, Ni and Hg at Farms 1 and 2 and As only at Farm 2. Moreover, the lowest amounts of Cr (1.15 mg kg-1) and Pb (1.11 mg kg-1) were found in the soils of Farm 2.
The soil textural class of all farms was clay loam with no salinity problem and commonly all the soils had a favourable/conducive pH and essential nutrients content for health functioning of the soils in the ecosystem but heavy metals like Cr, Pb, As and Hg require extra attention to be adjusted or corrected to their safe level.
The authors have not declared any conflict of interest
REFERENCES
|
Basta NT, Tabatabai MA (1992). Effect of cropping systems on adsorption of metals by soils. Soil Sci. 153(3):195-204.
Crossref
|
|
|
|
Blum WEH (1996). Soil Pollution by Heavy metals causes, processes, impacts and need for future action. Mitteilungen der Osterreichischen Bodenkundlichen Gesselschaft. 54:53-78.
|
|
|
|
|
Bouyoucos GJ (1962). Hydrometer method improvement for making particle size analysis of soils. Agron. J. 54:464-486.
Crossref
|
|
|
|
|
Bruce RC, Rayment GE (1982). Analytical methods and interpretations used by the Agricultural Chemistry Branch for Soil and Land Use Surveys. Queensland Department of Primary Industries. Bulletin 8. Indooroopilly, Queensland. Australia.
|
|
|
|
|
Chapman HD (1965). Cation exchange capacity. pp. 891-901. In: Black CA. Methods of soil analysis. American Society of Agronomy. Wisconsin, USA.
|
|
|
|
|
Charman PEV, Roper MM (2007). Soil organic matter. In: Charman PEV, Murphy BW. Soils their properties and management. 3rd ed. Oxford University Press. Melbourne. Australia. pp. 276-285.
|
|
|
|
|
Fabra A, Duffard R, Evangelista D (1997). Toxicity of 2,4-dichlorophen-oxyacetic acid in pure culture. Bull. Environ. Contam. Toxicol. 59:645-652.
Crossref
|
|
|
|
|
Fisseha I (1996). Micronutrient status of three Ethiopian Vertisol landscapes at different agro ecological zones. In: Proceedings of the third conference of Ethiopian Society of Soil Science (ESSS), February 28-29, 1996, Addis Ababa, Ethiopia. pp. 194-198.
|
|
|
|
|
Gao G, Chang C (1996). Changes in cation exchange capacity and particle size distribution of soils associated with long term annual applications of cattle feed lot manure. Soil Sci. 161:115-120.
Crossref
|
|
|
|
|
Gazey G, Davies S (2009). Soil acidity guide for farmers and consultants. The Department of Agriculture and Food. Western Australia. 24p.
|
|
|
|
|
Haymanot Awgchew, Heluf Gebrekidan and Adamu Molla (2015). Effects of municipal and industrial discharges on the quality of Beressa river water, Debre Berhan, Ethiopia. J. Ecol. Nat Environ. 7(2):23-28.
Crossref
|
|
|
|
|
Holford ICR, Cullis BR (1985). Effects of phosphate buffer capacity on yield response curvature and fertilizer requirements of wheat in relation to soil phosphate tests. Aust. J. Crop Sci. 2:417-427.
Crossref
|
|
|
|
|
Indiati R (2000). Addition of phosphorus to soils with low to medium phosphorus retention capacities. II. Effect on soil phosphorus extractability. Commun. Soil Sci. Plant Anal. 31:2591-2606.
Crossref
|
|
|
|
|
Jones JB (2003). Agronomic Handbook: Management of Crops, Soils, and Their Fertility. CRC Press LLC, Boca Raton, Florida, USA. 482p.
|
|
|
|
|
Landon JR (1991). Booker Tropical Soil Manual: a handbook for soil survey and agricultural land evaluation in the tropics and subtropics. John Wiley & Sons Inc., New York.
|
|
|
|
|
Lindsay WL, Norvell WA (1978). Development of a DTPA soil test for zinc, iron, manganese, and copper. Soil Sci. Soc. Am. J. 42:421-428.
Crossref
|
|
|
|
|
Ma LQ, Rao GN (1997). Chemical fractionation of cadmium, copper, nickel and zinc in contaminated soils. J. Environ. Qual. 26:259-264.
Crossref
|
|
|
|
|
McGrath D (1996). Application of single extraction procedures to polluted and unpolluted soils. Sci. Total Environ. 178:37-44.
Crossref
|
|
|
|
|
Metson AJ (1961). Methods of chemical analysis for soil survey samples. Soil Bureau Bulletin No. 12, New Zealand Department of Scientific and Industrial Research, Government Printer: Wellington, New Zealand. 171p.
|
|
|
|
|
Miller RW, Gardiner DT (1998). Soils in Our Environment, 8th ed. Upper Saddle River, Prentice Hall Inc. New Jersey. 361p.
|
|
|
|
|
Miller RW, Donahue RL (1995). Soils in Our Environment. 7th ed. Prentice Hall Inc. A Simon and Schuster Company Englewood Cliffs. New Jersey. USA. 297p.
|
|
|
|
|
Ministry of Water Resource (MoWR) (1995). Water supply and sanitation program for 34 Towns of the country.
|
|
|
|
|
Negash T, Bzuayehu T, Agete J (2011). Investigation of pollutants and its mitigation measure to conserve the potential of Beressa River. In: Debre Brihan University research and community service. Research proceeding II, 2(1). Debre Brihan, Ethiopia. pp. 30-49.
|
|
|
|
|
Newey A (2006). Litter carbon turnover with depth. PhD Thesis, Australian National University, Canberra. Australia.
|
|
|
|
|
Okalebo JR, Gathna KW, Woomer PL (2002). Laboratory methods for soil and plant analysis. A working manual. 2nd ed. Tropical soil fertility and biology program, Nairobi, Kenya. TSBFCIAT and SACRED Africa, Nairobi, Kenya. 128p.
|
|
|
|
|
Olsen SR, Cole CV, Watenabe FS, Dean LA (1954). Estimate of available phosphorous in soil by extraction with sodium bicarbonate. USDA Circular. 939:1-19.
|
|
|
|
|
Pawlowska TE, Charvat I (2004). Heavy metal stress and developmental patterns of arbuscular mycorrhizal fungi. Appl. Environ. Microbiol. 70(11):6643-6649.
Crossref
|
|
|
|
|
Pell M, Stenberg B, Torstensson L (1998). Potential denitriï¬cation and nitriï¬cation tests for evaluation of pesticide effects in soil. Ambio 27: 24-28.
|
|
|
|
|
Pierzeynski GM, Sims JT, Vance GF (2000). Soils and environmental quality, 2nd ed. Boca Raton, CRC Press. Florida. 209p.
|
|
|
|
|
Prasad R, Power JF (1997). Soil fertility management for sustainable agriculture, Lewis Publishers, New York. USA. 87p.
|
|
|
|
|
Ranst V (1991). Land Evaluation: Principles in land evaluation and crop production calculations (Part I). International Training Center for Post-Graduate Soil Scientists. State University Gent, Belgium.
|
|
|
|
|
Rowell D (1994). Soil Science: Methods and applications. Addison Wesley Longman (Pvt) Ltd., UK. 350p.
|
|
|
|
|
Santos A, Flores M (1995). Effects of glyphosate on nitrogen ï¬xation of free living heterotrophic bacteria. Lett. Appl. Microbiol. 20:349-352.
Crossref
|
|
|
|
|
Sawyer CC, McCarty PL (1978). Chemistry for environmental engineers, McGraw Hill, New York. USA. 465p.
|
|
|
|
|
Solomon D, Fritzsche F, Tekaligne M, Lehmann J, Zech W (2002). Soil organic matter dynamics in the sub-humid Ethiopian highlands: Evidence from natural abundance and particle. Soil Sci. Soc. Am. J. 66:969-978.
Crossref
|
|
|
|
|
Tisdale SL, Nelson WL, Beaton JD, Havlin JL (1993). Soil Fertility and Fertilizers. 6th ed. Macmillan Publishing Company, Inc. USA. 312p.
|
|
|
|
|
United States Environmental Protection Agency (USEPA) (1995). Guidance for environmental risk characterization and Assessment. Published by office of Research and Development. National Center for Environmental Protection Agency. Washington, DC. USA.
|
|
|
|
|
United States Salinity Laboratory Staff (USSLS) (1954). Diagnosis and improvement of saline and alkali soils. USDA Agriculture Handbook. No. 60.
|
|
|
|
|
Van Reeuwijk LP (1993). Procedures for Soil Analysis. 4th ed. International Soil Reference and Information Center, Wageningen, the Netherlands. 103p.
|
|
|
|
|
Wakene N (2001). Assessment of Important Physico-Chemical Properties of District Udalf (District Nitosols) Under Different Management Systems in Bako Area, Western Ethiopia. MSc. Thesis. Alemaya University.
|
|
|
|
|
Walkley A, Black CA (1934). An examination of different methods for determining soil organic matter and the proposed modifications by the chromic acid titration method. Soil Sci. 37:29-38.
Crossref
|
|
|
|
|
Zaguralskaya LM (1997). Microbiological monitoring of forest ecosystems in the Northern Taiga subzone in conditions of anthropogenic impact. Lesovedenie. 5:3-12.
|
|
|
|
|
Zhen-Guo S, Xian-Dong L, Chun-Chun W, Huai-Manand C, Hong C (2002). Lead phytoextraction from contaminated soil with high biomass plant species. J. Environ. Qual. 31:1893-1900.
Crossref
|
|
|
|
|
Zovoko M, Romic M (2011). Soil contamination by trace metals: Geochemical behaviour as an element of risk assessment. University of Zagreb, Croatia. J. Agric. 19:437-456.
|
|