Full Length Research Paper
ABSTRACT
The investigation was undertaken at Hamesa watershed of Wolayita Zone with the aim to assess the consequences of land-use systems and topography on the physical and chemical properties of selected soils. Surface soil samples taken at 0-15 and 15-30 cm depths from three land-use systems (enset, grassland and maize fields) were collected under three slope positions (upper, middle and lower). Both the clay and bulk density increased with depth, while total nitrogen (N), OC, available P and micro-nutrients (Fe, Zn, Mn, and Cu) decreased. On the landscape positions, increase in exchangeable Ca and K, pH, bulk density and available Mn down the slope was observed; whereas total N, OC, available P and available Fe showed decreasing trend down the slope. At 0-15 cm soil depth, grassland soils exhibited higher bulk density and lower porosity as a result of livestock movement which was compacted. Grasslands had higher OC and TN compared to the other two land-use systems, due to the accumulation of humus in the root system in the grassland. Application of household refuses and manure contribute to increasing available P, TN, Zn, Ca and K contents in enset farmland. On the contrary, maize land use had lower CEC, K, PBS, Mg, TN and OC, which might be due to crop removal, erosion phenomena, and excessive tillage activities. These results suggest that for sustainable crop production, proper management practices should be in place by considering different slope positions and land-use systems.
Key words: Land use system, slope position, physical, chemical soil properties.
INTRODUCTION
Soil is the most fundamental basis of life, as most of the requirements of life come from it. Copious expansion of life is found in an area that has fertile soil. Soil fertility has a connection with civilization in past history worldwide (Taffa, 2002). The quick rise in the world’s population demands the increase in the production of fuel, food, and fiber quantities from lands. Studies on the soil nutrient availability across landscapes have become a crucial point of ecological study (Benning and Seastedt, 1995). Landscape position and land use may be the dominant factors of soil properties under a hill-slope and small catchment scale, landscape positions influence runoff and soil erosion and consequently soil formation (Kosmas et al., 2000) Soil nutrient availability is a significant aspect of crop production control (Pastor and Post, 1986).
Soil properties mainly, soil texture and nutrient status, significantly differ along land use systems; whereas soil reaction (pH) do not vary, which is consistently affected by land use system (Lauber et al., 2008). For pasture land converted to cultivation, there was decrease in the soil OM, soil aggregation and the hydraulic conductivity; in terms of soil erosion, soils under cultivation were severely subjected to raindrops effects as compared to forest (Celik, 2005). The SOC, TN, and pH are low in agricultural land compared to rangeland and forest. Land reclamations and re-vegetation improve soil organic carbon and total nitrogen; there are higher SOC contents in afforested areas and natural forest (Lizaga et al., 2019).
Soil bulk density, available water content, organic matter, total nitrogen, available phosphorus, and CEC were major soil properties affected by slope positions in the central rift valley of Ethiopia (Yimer, 2017). In a similar way, soil moisture and soil chemistry could affect plant growth and distributions on certain ecosystems governed by topographic attributes (Yimer et al., 2006). Landscape positions were influenced by soil texture (clay content), organic carbon and CEC (Dessalegn et al., 2014; Negasa et al., 2017; Tellen and Yerima, 2018). In some cases, however, middle slope positions contain high levels of OC and TN in semi-arid small catchment on the loess plateau in China (Wang et al., 2001).
The study conducted at Delbo Atwaro watershed, Southern Ethiopia by Kiflu and Beyene (2013) shows that the highest values of soil pH, EC, phosphorus, Zn, K, Ca and PBS were obtained under enset farmland when compared to maize and grassland areas. Similarly, soils of cultivated lands have higher available phosphorus content; whereas exchangeable bases, OC and CEC were higher in grasslands (Beyene, 2017). Grasslands had higher Organic matter and nitrogen content as compared to agricultural land and agroforestry Soil P showed a significant variation between agroforestry and grassland (Panday et al., 2019). Reduction of OM, available phosphorus and porosity was observed as a result of the change of land use from forest to cultivation, while a reverse trend was examined for BD and pH (Bizuhoraho et al., 2018)
There were spatial distributions of soil properties influenced by topography and existed land uses. The study conducted by Hu et al. (2019) reveal that silt, OM and TN has higher values in cultivated lands; whereas shrublands has lower values in relation to topographic positions significant variations observed for clay, bulk density, organic matter, and total nitrogen. Forest land use has higher soil properties (OC, TN, and CEC), while relatively lower in cultivated land use system, along with toe-slope CEC, OM and TN values increased compared to the upslope position (Ezeaku and Eze, 2014). There are progressively increased inhabitants living in Southern Ethiopia, which are difficult to feed with agrarian cultivation system. Landscape features in most parts of
Ethiopia have influence on soil resources, including depth; thus, cultivation exercises aggravate the situation of reduced crop production. There is a need to improve these tendencies and this lies in the improvement of a long term development of the agricultural sector.
According to Ethiopia Mapping Authority (1998), classified soils in Wolayita zone is Nitisols, however, previous studies indicated that other soil orders, Ultisols, Inceptisols and Entisols (Mulugeta, 2006) do also exist in the Wolayita areas. In Ethiopia, Ultisols are some of the oldest, occupying most stable positions along with Oxisols, Alfisols, and soils of other orders on young or relatively less stable surfaces (Mesfin, 1998). The study of Hamesa watershed of South Ethiopia was characterized by undulated topography feature having varied slope conditions, and farmers practiced cultivation for long years directed to minimize the soil fertility and increased soil erosion. Hence, an integrated approach is needed for important soil nutrients in relation to topography and land use systems. Thus, this aim to assess identified physicochemical soil properties on different land use systems and topography.
MATERIALS AND METHODS
Description of the study area
Hamesa watershed is situated in Humbo Woreda, Wolayita Zone, Southern Nations, Nationalities and Peoples Regional State (SNNPRS) which was shown in Figure 1. The altitude of this Woreda is found between 1050 to 1500 meters above sea level and agro ecologically, it has Kola to Woinadega categories. Hamesa watershed has bimodal rainfall and its distributed peak months are between April and August for the last 30 years according to the national metrological agency report. The minimum and maximum temperatures are 25 and 32°C, respectively and average yearly rainfall ranges between 600 and 900mm. The major crops cultivated in the watershed are cereals (teff, maize, and sorghum), pulses (haricot bean and chickpea), and root crops (potato, sweet potato and enset).

The land use system selected for this research is enset (Enset ventricosum), since it has being cultivated for years in the watershed for major consumption crops, semi perennial that takes four to seven years to mature and requires continuous application of manure. In addition, it is drought-resistant. Household refuse and organic sweepings around the house are used on enset fields; this is to improve the physical structure and nutrient retention than for their nutrient content on homestead fields. Maize was selected as the second land use system since it is grown in most parts of the cultivated lands in the watershed. It is the major cereal in the watershed and it lacks application of cow dungs and households refuses because the location is far from the homestead. Grassland was considered as the third land use system. It is kept for tethered feeding in the front yard and is used for the establishment of small private grazing plots at the edge of the farm is common.
Three slope positions (upper, middle and lower) were identified based on topography and altitude ranges: with each slope section, three land use categories were recognized (enset, maize, and grassland). These were taken into account with experiences of major farmers. Thus, there were nine sampling sites identified in order to collect soil samples from various land use and landscapes in Hamesa watershed. For each sampling sites, three soil samples were randomly collected from both depths (0-15 and 15-30cm), these samples were mixed in a plastic bucket to form a composite sample. All soil samples were air-dried, ground and to pass through 2 mm sieve for physicochemical analysis. Determine the total nitrogen and OC, a 0.5 mm sieve was used.
Laboratory analysis of soil properties
Soil particle size was determined using the hydrometer method (Sahlemedhin and Taye, 2000) and bulk density was determined by employing the core-sampling method (BSI, 1975). In order to determine total nitrogen content, Kjeldahl method was used as described by Jackson (1958) and the available phosphorus content of the soil was determined following the procedures of Olsen (Olsen et al., 1954)
Soil pH was measured following the procedures described by Sahlemedhin and Taye (2000) and wet digestion (Walkley and Black, 1934) was employed to determine organic matter content. Cation exchange capacity was extracted using ammonium acetate processes outlined by Van Reeuwijk (1993). Exchangeable bases were extracted with 1 M ammonium acetate, in the extract; exchangeable Ca and Mg were determined using atomic absorption spectrophotometer (AAS) and exchangeable K and Na by flame photometer. The percentage base saturation (PBS) and exchangeable sodium percentage (ESP) were calculated using the Equations 1 and 2:

Micronutrients (Cu, Fe, Mn and Zn) were determined following the procedures of diethylenetriaminepenta-acetic acid method; the extract was measured by AAS at different wavelengths (248.3, 279.5, 324.7, and 213.9 nm) respectively.
Statistical method
The soil data from three land use systems and three landscape positions were explored with SAS software (SAS, 1997) using a general linear model to separate mean differences (LSD) among treatments at 5% and 1% significant levels, as per the requirements of statistical processes.
RESULTS AND DISCUSSION
Effects of land use types on soil physicochemical properties
Regarding soil textures variation recorded at both soils depths, in 0-15 cm depth enset farmland exhibited higher sand content followed by grassland and maize fields. Lower soil depth (15-30 cm depth) silt content was recorded in enset farmland had higher sand content followed by grassland and maize fields, on the contrary, higher clay content recorded in 15-30 cm of maize field (Table 1). The three land use systems had categorized as sandy loam textural class showed that land use system has no effect on soil texture since it is inherent soil physical property that might not change over a short period (Kiflu and Beyene, 2013). Continuous livestock movement for grazing purpose in grassland soils exhibit higher bulk density and lower porosity (Moges and Holden, 2008), whereas proper land management in homestead areas contributed to low bulk density and higher porosity in enset fields (Table 1)

At two soil depths, the soil pH ranged from very slightly acidic to slightly alkaline for the three land use systems at both depths described by London (1991). For the 0-15cm soil depth, enset field had higher soil pH followed by grassland and maize field (Table 2). This could be due to higher values basic cations owing to addition of household wastes; it is in agreement with the findings of Kiflu and Sheleme (2013).
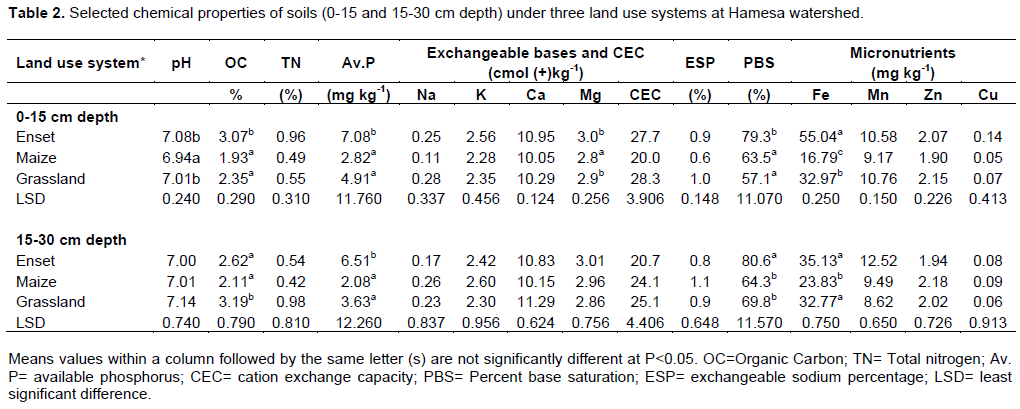
The organic carbon content of grassland and maize fields were lower than enset field (Table 2). It varied from 1.93 to 3.07% for 0-15 cm and from 2.11 to 3.19% for 15-30 cm depth. Tillage frequency in maize field might be a possible reason for attaining lower OC on maize field (Kiflu, 2007). Grassland soils had higher OC compared to maize field. This might be due to the presence of humus accumulation and roots in grassland (Elliot, 1986; Heluf and Wakene, 2006). Similarly, Woods and Schuman (1998) as well as Wakene (2001) found lower OC soils in cultivated land compared to grassland. Higher total nitrogen was recorded in the grassland compared to enset field at the 15-30 cm depth; this might be due to the strong relation of OM and TN (Ahn, 1993). At the 0-15 cm depth, on the other hand, enset field had thehighest total N among other land use systems, which is in line with the finding of Boke (2004). There were significant differences (P≤0.05) of available P observed among various land uses. Enset field obtained higher values compared with grassland and maize fields (Table 2), this might due to the application of cow dung and household wastes and associated microbial activity (Boke, 2004; Fetene and Amera, 2018). The result is consistent with that of Kokate and Adilo areas according to Boke (2004), who found that available P was higher in enset field due to transformation processes of P, in another way application of P containing fertilizers also increase the availability of P on maize field (Van der Eijk et al., 2006). Regarding exchangeable K, enset field had higher values compared to grassland and maize fields; this might be due to the application of household refuse on the enset field; crop harvest and repeated tillage practices were responsible for the lower K in the maize field. Previous findings also indicated that weathering intensity and application K containing fertilizers influence the movement and circulation of K in the soil system (Saikh et al., 1998).
In a similar manner, enset field had the highest exchangeable Ca and Mg; while maize field has the lowest which might be due to crop removal and erosion phenomena ((Wakene, 2001) in the maize field. There were significant differences observed among land use types with regard to PBS of the soils (P≤0.05). For 0-15 cm depth, enset field has the highest PBS (79.3%) and the lowest recorded at maize field (63.5%); in 15-30 cm enset field had a higher value (80.6%), while grassland had the lower record (69.8%). In both soil depths, comparatively enset field had the highest PBS compared to other land use; indicating that enset field had better soil fertility status because of proper land management practices by local farmers. The CEC content recorded decrease in the order of grassland< enset< maize fields at 0-15 cm (Table 2); meanwhile several authors reported that CEC was positively correlated with organic carbon at surface soils (Kiflu and Sheleme, 2013; Kiflu, 2007; Wakene, 2001). To decrease depletion of land, the natural resources utilization appropriate land management in grasslands and maize fields has to be effective. Agricultural development work emphasized fertility parameters to boost crop production (Cade-Menun et al., 2017).
Various land use systems has affected soil micronutrients (Fe, Cu, Zn and Mn) in both soil depths (P≤0.05). For 0-15 cm depth, enset field has higher available Fe (55.04 mg kg-1) followed by grassland (32.97 mg kg-1). Similar result was achieved for 15-30 cm depth that is enset field (35.13 mg kg-1) was higher compared to grassland soils (32.77 mg kg-1).
Reverse trends achieved in available Mn contents as compared to available Fe results in land use systems, had a greater value obtained in grassland compared to enset fields. In both depths, Mn concentration exceeds the critical values suggested by Lindsay and Norvell (1969), which were the deleterious level of the plants for three land use systems under study.
The highest concentration of available Zn (2.15 mg kg-1) was found on the upper surface (0-15cm) of grassland followed by enset field (2.07 mg kg-1); on the contrary, for maize, the lower depth (15-30 cm) had the highest available Zn (2.18 mg kg-1) followed by grassland (2.02 mg kg-1). The concentration of available zinc in enset, maize, and grasslands fulfilled the minimum requirements to support the plant growth (Havlin et al., 1999). At upper soil layer (0-15 cm) depth, available zinc concentration under maize filed was lowest when compared with the remaining two land uses; this may possibly be due to continuous crop harvest and removal of topsoil by erosion that would be aggravated by tillage practices (Wakene, 2001). Enset fields had higher available Cu value attained. Compared with other land use systems (Table 2), there might be a strong positive relation copper with organic carbon. All land use systems in the study area were not sufficient to support plant growth based on values of available copper concentrations (Havlin et al., 1999).
Effects of slope positions on soil physicochemical properties
With regard to textural classification, clay content was consistently lowered when compared to silt and sand fractions in upper, middle and lower slope position. The middle slope position had higher sand content, but silt fraction recorded lower values (Table 3). Deposition of sediment from the upper slope to middle slope contributed higher amounts of sand fraction. There was significant difference(P≤0.05) in clay; but silt and sand indicated clay fraction were easily transported to lower slopes resulting in sandy loam texture in the other two slope positions, while that of the lower slopes were sandy clay loam at both soil depths. For 15-30 cm depth, there is no significant difference on clay fraction at upper and middle landscape positions; however, great variations were observed in lower slopes. This result is in agreement with the previous study conducted at Umbulo catchment in Southern Ethiopia (Moges and Holden, 2008). The highest and lowest bulk densities were observed in lower and middle slope positions at 0-15 cm depth; this might be due to the variation in bulk densities, related to the contents of OC negatively and particle size distributions (Kiflu, 2007; Ellen and Yerima. 2018). Similar result was obtained in South Central Iowa of reconstructed prairies (Guzman and Al-Kaisi, 2011). Bulk densities of surface soils decreased with increasing elevation, this is supported by Hanawalt and Whittaker (1976). Depth of 0-15 cm had higher bulk density (1.15 g/cm3) measured at lower slope position, whereas lower BD (1.05 g/cm3) in the middle slope position and significant variation is observed (P≤0.05). The attained bulk densities in the study area under three slopes position were lesser than the optimum ranges outlined in various researches (London, 1991). This could facilitate root growth and facilitate water and gas movements (Worku et al., 2017).

Soil pH has shown slight increment trends at 0-15cm soil depth from upper (6.6) to lower slope positions (7.2); indicating the removal of basic cations from the upper slope and laterally by runoff to down slope, increasing soil pH (Chen et al., 1997). Organic carbon and total nitrogen content significant differences (P≤0.05) were attained in the upper soil depth (0-15 cm) due to slope positions, and generally higher OC and TN were observed on the upper and middle slopes compared to the lower slope position (Table 4). OC content increased with increase of elevation (Hanawalt and Whittaker, 1976); on the contrary, the research conducted by Guzman and Al-Kaisi (2011) indicated that organic carbon was lower at the middle slope compared to the summit and toe-slope positions. The highest available P (7.35 mg kg-1) was recorded in the upper slope position, while the lowest (2.35 mg kg-1) was recorded at the lower slope position of 0-15 cm depth. This increment may be attributed to the increment of OM content of soils along topo-sequence (Ahmed, 2002) and significant difference (P≤0.01) observed at 0-15 cm depth. CEC values of lower slopes were significantly (P≤0.05) different in the slope positions. The higher values were measured in the lower slope, followed by middle and upper slope positions (Table 4). This difference could be attributed to OC and clay (Moges and Holden, 2008). Generally, the highest exchangeable Na and K values were recorded in a lower slope position, whereas the lowest was measured in the upper slope positions; similar result was obtained in another area of Southwestern Ethiopia (Nigussie and Kissi, 2012). Regardless of slope positions and depths, the ESP values were lower than critical values (London, 1991). Higher amounts of exchangeable Ca and Mg were recorded at the lower slope positions of 0-15cm depth. The possible reason could be the movement of solutes from upper slopes and deposition on the lower slopes (Brubaker et al., 1993). PBS values followed the same trends as exchangeable cations concentrations at different slope positions. The highest available Fe content (43.03 mg kg-1) was registered at the upper position, in contrast, the lowest available Fe (21.98 mg kg-1) was observed at the lower positions of 0-15cm depth. On the other hand, the available Mn has shown an increasing trend from upper (9.14 mg kg-1) to lower slope position (11.50 mg kg-1) and significantly different (P≤.05) at 0-15 cm depth (Table 4). The accumulation of manganese lower slope position might be due to the fact that it has easier reduction and solubility process than Fe. The lowest available Zn value (1.80 mg kg-1) was measured in the upper slope position, while the highest (2.37 mg kg-1) was recorded in the middle slope position at 0-15cm depth. The lowest available Zn value observed at upper elevation could be due to the removal of topsoil by sheet erosion. Considering available Cu, the distribution along with slope positions slight variations were observed (Table 4).

CONCLUSION
The results of this research achieved through representative surface soils collected under different land use indicate that most of the selected physical and chemical soil properties were impacted by types of land uses in Hamesa watershed. Enset fields had higher values of pH, available Zn, exchangeable bases (K and Ca) and PBS when compared with the other two land use systems (Maize and grassland). Crop harvest and repeated tillage practices in maize fields were driving factors that contributed to having the lowest values of OC, TN, PBS, CEC, and exchangeable Mg. Moreover, the upper slope position had higher TN, OC, available Fe and P compared with other categories (middle and lower slope positions); whereas pH, available Ca, K, CEC, bulk density, and available manganese were higher at the lower slope positions in 0-15cm depth, suggesting the interaction effects of different land uses found in the three topographic positions considered in the study. The significant differences among soil properties in the study area indicates that land management practices should consider both land use changes and varied landscape features and for any natural resource management activities, soil properties should be considered. However, detailed studies on other areas should be conducted to examine the effects of climate, land management, soil types and other factors on soil properties, in spatial and temporal scales in addition to land use and topographic factors consideration.
CONFLICT OF INTERESTS
The author has not acknowledged any conflict of interest.
REFERENCES
|
Ahmed H (2002). Assessment of spatial variability of some physicochemical properties of soils under different elevations and land use systems in the western slopes of mount Chilalo, Arsi. MSc Thesis. Alemaya University, Ethiopia. |
|
|
Ahn P (1993). Tropical soils and fertilizer use. Intermediate tropical agriculture serious. Longman group UK limited, Malaysia, 264p. |
|
|
Benning TL, Seastedt TR (1995). Landscape-level interactions between topographic features and nitrogen limitation in tall grass prairie. Landscape Ecology 10(6):337-348. |
|
|
Beyene S (2017). Topographic positions and land use impacted soil properties along Humbo Larena-Ofa Sere toposequence, Southern Ethiopia. Journal of Soil Science and Environmental Management 8(8):135-147. |
|
|
Bizuhoraho T, Kayiranga A, Manirakiza N, Mourad Khaldoon A (2018). The effect of land use systems on soil properties; A case study from Rwanda. Sustainable Agriculture Research 7(2):30-40. |
|
|
Boke S (2004). Soil phosphorus fractions as influenced by different cropping systems in Andosols and Nitosols in Kembata-Tembaro and Wolayta Zones, SNNPRS. MSc Thesis. Alemaya University. |
|
|
Brubaker SC, Jones AJ, Lewis DT, Frank K (1993). Soil properties associated with landscape positions. Soil Science Society of America Journal 57(1):235-239. |
|
|
BSI (1975). Methods of testing soils for civil engineering purpose. British Standards 1377. British standard institution, London. |
|
|
Cade-Menun BJ, Bainard LD, LaForge K, Schellenberg M, Houston B (2017). Long-term agricultural land use affects chemical and physical properties of soils from southwest Saskatchewan. Canadian journal of soil science 97(4):650-666. |
|
|
Celik I (2005). Land-use effects on organic matter and physical properties of soil in a southern Mediterranean highland of Turkey. Soil and Tillage Research 83(2):270-277. |
|
|
Chen ZS, Hsieh CF, Jiang FY, Hsieh TH, Sun IF (1997). Relations of soil properties to topography and vegetation in a subtropical rain forest in southern Taiwan. Plant Ecology 132(2):229-241. |
|
|
Dessalegn D, Beyene S, Ram N, Walley F, Gala TS (2014). Effects of topography and land use on soil characteristics along the toposequence of Ele watershed in southern Ethiopia. Catena 115:47-54. |
|
|
Elliot EA (1986). Aggregate structure and carbon, nitrogen and phosphorus in native and cultivated soils. Soil science society of America journal 50(3):627-633. |
|
|
Ethiopian Mapping Authority (1998). National Atlas of Ethiopia, Addis Abeba, Ethiopia. |
|
|
Ezeaku P, Eze FU (2014). Effect of land use in relation to slope position on soil properties in a semi-humid Nsukka area, Southeastern Nigeria. Journal Agricultural Research 52(3):369-381. |
|
|
Fetene EM, Amera MY (2018). The effects of land use types and soil depth on soil properties of Agedit watershed, Northwest Ethiopia. Ethiopian Journal of Science and Technology 11(1):39-56. |
|
|
Guzman JG, Al-Kaisi MM (2011). Landscape position effect on selected soil physical properties of reconstructed prairies in South Central Iowa. Journal of soil and water conservation 66(3):183-191. |
|
|
Hanawalt R, Whittaker R (1976). Altitudinally coordinated patterns of soils and vegetation in-the San Jacinto Mountains, California. Soil Science 121(2):114-124. |
|
|
Havlin JL, JD Beaton, SL Tisdale, WL Nilson (1999). Soil fertility and fertilizers: an introduction to nutrient management, 6th ed. Prentice-Hall. Upper Saddle River, New jersey. |
|
|
Heluf GK, Wakene N (2006). Impact of land use and management practices on chemical properties of some soils of Bako area, western Ethiopia. Ethiopian Journal of Natural Resources 8(2):177-197. |
|
|
Hu C, AL Wright, Lian G (2019). Estimating the Spatial Distribution of Soil Properties Using Environmental Variables at a Catchment Scale in the Loess Hilly Area, China. International journal of environmental research and public health 16(3):1-14. |
|
|
Jackson ML (1958). Soil chemical analysis. Prentice Hall, Inc., Engle Wood Cliffs. New Jersy, USA. 582p. |
|
|
Kiflu A (2007). Effects of different land use systems and topography on selected soil properties at Delbo watershed, Wolayita Zone, south Ethiopia. MSc Thesis. Hawassa University, Ethiopia. |
|
|
Kiflu A, Beyene S (2013). Effects of different land use systems on selected soil properties in South Ethiopia. Journal of Soil Science and Environmental Management 4(5):100-107. |
|
|
Kosmas CS, Gerontidis S, Marathianou M (2000). The effect of land use change on soils and vegetation cover various lithological formations on Lesvos (Greece). Catena 40:51-68. |
|
|
London JR (Ed) (1991). Booker tropical soil manual: A handbook for soil survey and agricultural land evaluation in the tropics and subtropics. Longman Scientific and technical, Essex, New York 474 p. |
|
|
Lauber CL, Strickland MS, Bradford MA, Fierer N (2008). The influence of soil properties on the structure of bacterial and fungal communities across land-use types. Soil Biology and Biochemistry 40(9):2407-2415. |
|
|
Lindsay W, Novell W (1969). Development of DTPA micronutrient soil test. In Agronomy, Abstract 84:1-11. |
|
|
Lizaga I, Quijano L, Gaspar L, Ramos MC, Navas A (2019). Linking land use changes to variation in soil properties in a Mediterranean mountain agroecosystem. Catena 172:516-527. |
|
|
Mesfin A (1998). Nature and management of Ethiopian soils. Alemaya University of Agriculture, Harar, Ethiopia, 272p. |
|
|
Mulugeta D (2006). Soils in Kindo Koye Watershed Catena, Damot Woyde Woreda, Wolayita Zone, Southern Ethiopia. MSc Thesis. Debub University, Awassa, Ethiopia. 141p. |
|
|
Moges A, Holden NM (2008). Soil fertility in relation to slope positions and agricultural land use: a case study of Umbulo catchment in Southern Ethiopia. Environmental management 42(5):753-763. |
|
|
Negasa T, Ketema H, Legesse A, Sisay M, Temesgen H (2017). Variation in soil properties under different land use types managed by smallholder farmers along the toposequence in southern Ethiopia. Geoderma 290:40-50. |
|
|
Nigussie A, Kissi E (2012). The contribution of coffee agroecosystem to soil fertility in Southwestern Ethiopia. African Journal of Agricultural Research 7(1):74-81. |
|
|
Olsen SR, Cole CV, Watanabe FS, Dean LA (1954). Estimation of available phosphorus in soils by extraction with sodium bicarbonate. USDA Circular 939:1-19. |
|
|
Panday D, Ojha RB, Chalise D, Das S, Twanabasu B (2019). Spatial variability of soil properties under different land use in the Dang district of Nepal. Cogent Food & Agriculture 5(1):1-19. |
|
|
Pastor J, Post WM (1986). Influence of climate, soil moisture, and succession on forest carbon-nitrogen cycles. Biogeochemistry 2: 3-27. |
|
|
Sahlemedhin S, Taye B (2000). Procedures for soil and plant analysis. National soil research center, EARO, technical paper no. 74, Addis Abeba, Ethiopia, 110p |
|
|
Saikh H, Varadachari C, Ghosh K (1998). Effects of deforestation and cultivation on soil CEC and contents of exchangeable bases: A case study in Simplipal National park, India. Plant and Soil 204 (2):175-181. |
|
|
SAS (1997). SAS institute Inc., Cary, NC, USA. |
|
|
Taffa T (2002). Soil and water conservation for sustainable agriculture CTA. Mega publishing agency, Addis Ababa. |
|
|
Tellen VA, Yerima BP (2018). Effects of land use change on soil physicochemical properties in selected areas in the North West region of Cameroon. Environmental Systems Research 7(1):3. |
|
|
Van der Eijk D, Janssen BH, Oenema O (2006) Initial and residual effects of fertilizer phosphorus on soil phosphorus and maize yields on phosphorus fixing soils A case study in south-west Kenya. Agriculture, ecosystems & environment 116(1-2):104-120. |
|
|
Van R (1933). Procedures for soil analysis, 4th ed. International soil reference and information center, Netherlands. |
|
|
Wakene N (2001). Assessment of important physicochemical properties of dystric udalf (dystric Nitosols) under different management systems in Bako area, Western Ethiopia. MSc Thesis. Alemaya University, Ethiopia. |
|
|
Walkley A, Black CA (1934). An examination of DeGraff method for determining soil organic matter and proposed a modification of the chromic acid titration method. Soil science 37(1):29-38. |
|
|
Wang J, Fu B, Qiu Y, Chen L (2001). Soil nutrients in relation to land use and landscape position in the semi-arid small catchment on the loess plateau in China. Journal of Arid Environments 48(4):537-550. |
|
|
Worku K, Debela A, Shanko D (2017). Characterization of the existing soil management in relation to some selected physico-chemical properties at Bulehora Woreda, West Guji Zone. International Journal of Agricultural Research, Innovation and Technology 7(2):43-48. |
|
|
Yimer F (2017). Effect of Landscape Positions on Soil Properties in an Agricultural Land A Transect Study in the Main Rift Valley Area of Ethiopia. Journal of Science and Development 5(1):21-31. |
|
|
Yimer F, Ledin S, Abdelkadir A (2006). Soil property variations in relation to topographic aspect and vegetation community in the southeastern highlands of Ethiopia. Forest Ecology and Management 232(1):90-99. |
|
Copyright © 2024 Author(s) retain the copyright of this article.
This article is published under the terms of the Creative Commons Attribution License 4.0


