ABSTRACT
The soils of Jinka in Southern Ethiopia were studied based on the detail works on soil pit description, characterizing and classification following the FAO and USDA guidelines. For this, along with the topo-sequence and landscape, six soil profiles were opened on an area of 100 ha of research field to make them suit for sustainable soil management practices. The soils were generally described as dark reddish brown to very dark brown and deep. These soils were characterized as slightly (4.87) to moderately acidic (6.18). The OC and available phosphorus were found to range from low to medium. All micronutrients were found to be highly associated with lower soil reaction. These soils group can be classified as Cambisols. Therefore, amending the soil with lime based on exchangeable acidity, essential and deficient nutrients will be vital for supplying food and feed crops in the region. However, continuous assessment of the nutrient status at every five to seven years is necessary to make sure that the soil quality is maintained.
Key words: Blocky, consistency, friable, granular, sub-angular, structure.
In most developing countries where population grows very swift like Ethiopia, focusing only on the potential areas for agricultural use would not help to feed these mounting human and livestock populations. Therefore, exploiting the potential of marginal areas could be the best option to address agricultural product needs for local consumptions as well as export market through boosting agricultural production and productivity and hence economic development, too. In line with this fact that the Jinka Agricultural Research Center (JARC) was established in 2011 in order to address agricultural production constraints in marginal areas so as to fight poverty and exploit the potential of these areas thereby increasing the economic development of Ethiopia. Accordingly, it was intended to represents the humid lowlands of Ethiopia and to address the agricultural production related problems in the eight weredas. Six of them (Male, Salamago, Bena-Tsemay, Hamer, Gnangatom and Dasenech) are highly dominated by people who make their mainstay in agro-pastoral way of living while the rest two (Debub Ari and Semen Ari- Gelila) are known for crop production in the South Omo Zones of the South Nations, Nationalities and Peoples Regional state (SNNPR).
Generally, crop production involves a complex interaction among the environment, soil and nutrient dynamics. Because of this fact, the soil must be studied in terms of its dynamics and environment in order to make it more productive via proper management. Accordingly, failure to understand these complexities along with lack of proper management has resulted in poor crop production potential and hence agricultural production used to be very low (Bashour and Sayegh, 2007).
Management and exploitation of soil potential is strictly dependent on the critical and detail study on description, characterization and classification of the major soil types in the given area. However, there is no baseline information on the nutrient status and the overall characteristics of soils of the experimental site at JARC. The objective of this study is, therefore, to describe the major landforms, characterize and finally to classify the soils of Jinka.
Description of the experimental site
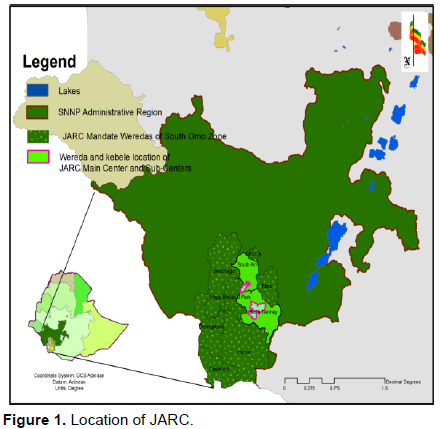
JARC, is one of the research center of SARI, located 729 kms South West of the capital Addis Ababa at E 36° 33’ 02.7” Longitude and N 05° 46’ 52.0” Latitude and at an altitude of 1383 masl (Figure 1). Long term weather data revealed that the maximum and minimum monthly average temperature is 27.55 and 16.55°C, respectively while the mean annual rainfall of the area is 1274.67 mm. It is characterized by gentle to flat land features. The slope of the research field ranges from 0 to 5%.
Soil description and sampling
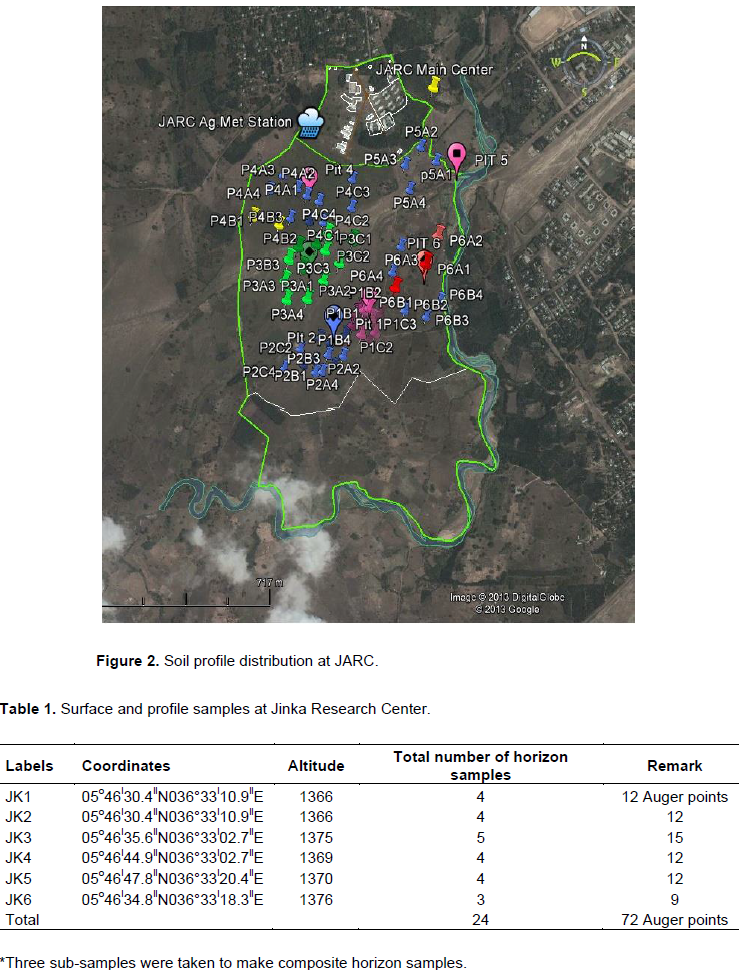
Based on unevenness of vegetation and land use system, six representative soil profile pits (Figure 2) were opened and described in situ according to the guidelines of FAO (2006). Besides, twenty four horizon samples (Table 1) from six profiles were collected from 72 auger points, recorded with GPS and analyzed for physico-chemical properties. Soil color notation was described according to Munsell Color Chart (KIC, 2000).
Laboratory analysis
Texture was determined by hydrometer method (Bouyoucos, 1962). The soil pH was potentio-metrically measured in the supernatant suspension of a 1:2.5 while the electrical conductivity was measured in 1:5 soil to water ratio (Rayment and Higginson, 1992). Organic carbon was determined using Walkley-Black oxidation method (Allison, 1965). Total nitrogen was determined by the micro-Kjeldahl digestion, distillation and titration method, and available P was determined using the standard Olsen extraction method (Olsen et al., 1954). Total exchangeable bases were determined after leaching the soils with ammonium acetate (Reeuwijk, 2002). Amounts of K+, Na+, Ca2+ and Mg2+ in the leachate were analyzed by AAS. Cation exchange capacity was determined at soil pH level of 7 after displacement by using 1N ammonium acetate method in which it was, thereafter, estimated titrimetrically by distillation of ammonium that was displaced by sodium (Chapman, 1965). Available micronutrient contents of the soil were extracted by diethylenetriaminepentaacetic acid (DTPA) method (Tan, 1996) and concentrations were determined by AAS.
Physical characteristics of the site
The main experimental site is quite flat and targeted to representing crop research. However, some wetlands have been formed at the heart of the experimental fields and at the peripheries, there is a river called Neri. It is used to be a common grazing land and has been partly cropped with maize (Zea maize) and Sorghum (Sorghum bicolor) by the surrounding farmers and those residing at the outskirt of Jinka town.
Morphological properties of the soils
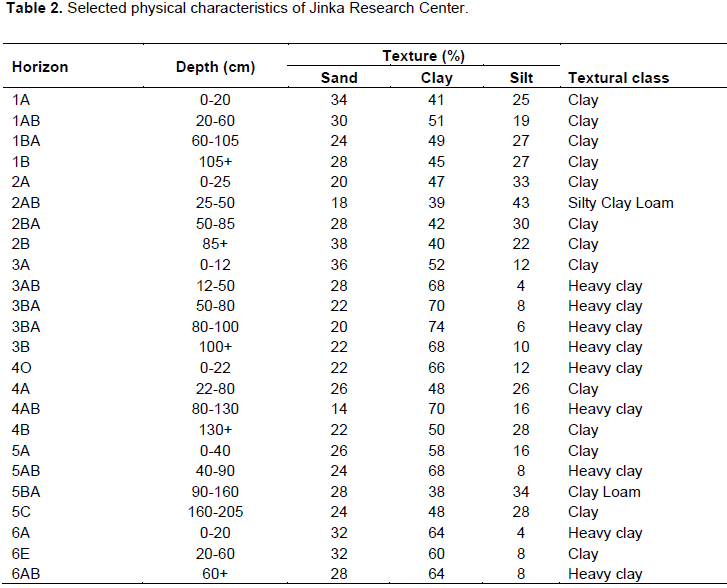
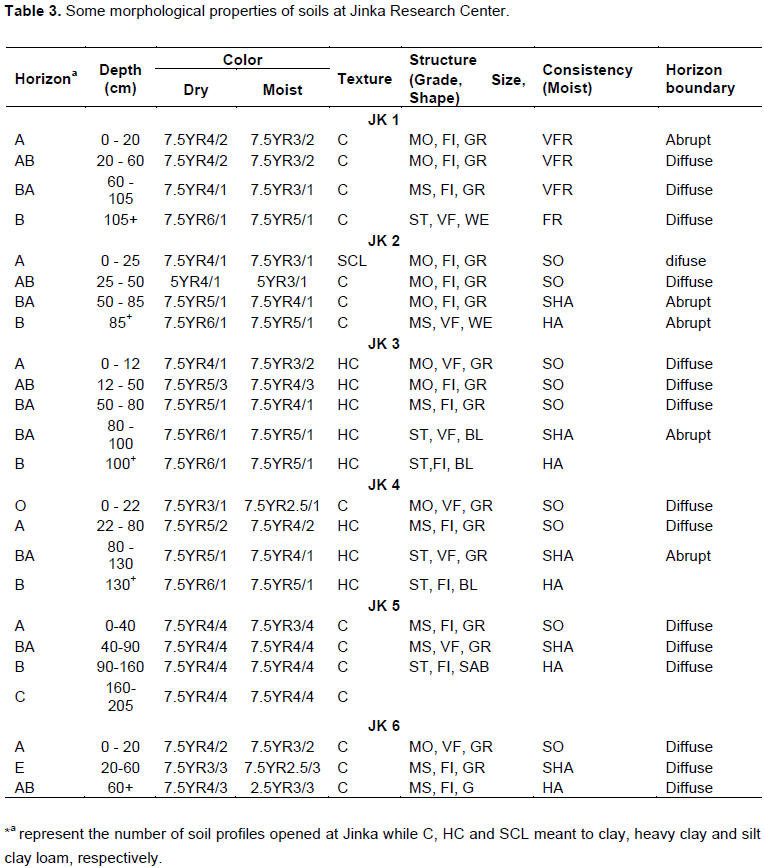
The soil depth has been identified as very deep (> 150 cm). Pedons in JK1, JK2, JK3, JK4, JK5 and JK6 were characterized by Ap-AB-BA-Bt, Ap-AB-BA-Bt, Ap-AB-BA-BA-Bt, O-A-BA-Bt, O-A-Bt-C and Ap-E-A/AB, respectively. The thickness of the A horizon, which is a ploughed layer, varied from 12 to 58 cm while E was observed in only a pedon by having 20 cm. It does also contain a well established AB, BA, B and C horizons. Significant amount of clay translocation was observed in the middle and lower horizons, as evidenced considerable increase in the clay content of the B horizon (Table 2). Generally, the distinctness of the boundaries between horizons was clear with abrupt and diffuse changes.

A Munsell color chart reveals that the soil color varies from very Dark Grey (7.5 YR 3/1) to Dark Brown (7.5 YR 3/2) and Dark Grey (7.5 YR 4/1) to Black (7.5 YR 2.5/1) for dry and moist conditions, respectively (Table 2). With increasing soil depth, Value keeps increasing with the same Hue and sometime chroma implying that the organic matter distribution in the soil profile declines as the soil textural class mainly dominated by clay. According to Foth (1990), reddish color is due to the presence of iron compounds in various states of oxidation. Abayneh (2005) found that wet soil profiles have darker hues in the B horizons compared to those with relatively dry horizons.
All surface horizons of the studied soils had moderate fine granular structure while the sub-surface horizons had moderately strong to strong fine to very fine granular to wedge structure (Table 3). Well developed structure of the subsurface soils could be due to the relatively higher clay content of the subsurface horizons than that of the surface horizons (Ahn, 1993). The moist consistencies of the surface layers ranges from soft to very friable while the sub-surfaces from friable to hard due to overburden effect of the overlay soils (Table 2).
Physico-chemical properties
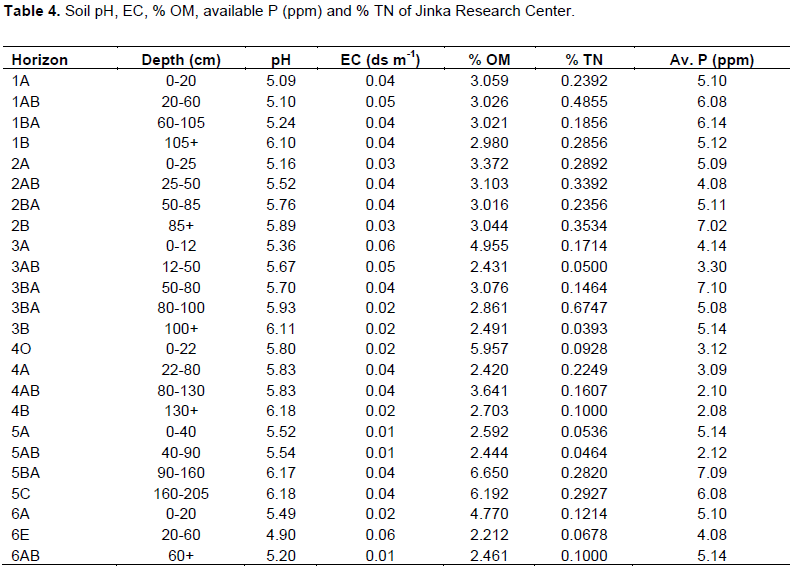
The results of the particle size analysis indicate that the soils within the Jinka are fine to very fine textured soils. Generally, the soil textural classes of each of the six pedons were clayey to heavy clay. The proportion of clays in these textural classes ranges from 38 to 74 while sand and silt varies 14 to 42 and 4 to 43%, respectively (Table 2). The soil pH-H2O in all the study profiles ranges from 4.87 to 6.18 and had shown a general tendency of increasing with soil depth (Table 4). According to Murphy (1968) and Tekalign (1991) classification, it has been rated as very strongly acidic to slightly acidic, which is preferred range for most crops with some management.

The organic matter contents were classified to ranges from low to very medium by having a range of values between 2.07 to 3.37% (Murphy, 1968; Berhanu, 1980; Tekalign, 1991). All the three authors, generally, agreed that these soils have low OM contents (Table 4). The total nitrogen contents of the soils of the sites ranges from 0.00.393 to 0.4855% and ranged from low to high according to the same authors. The high level of TN in the soil profile has probability been attributed to the effect of current cultivation and fertilization of the field with research experiments. These soils contains low to medium levels of available P, which was found to be little deficient to maintain annual crops (Olsen et al., 1954; Cottenie, 1980).
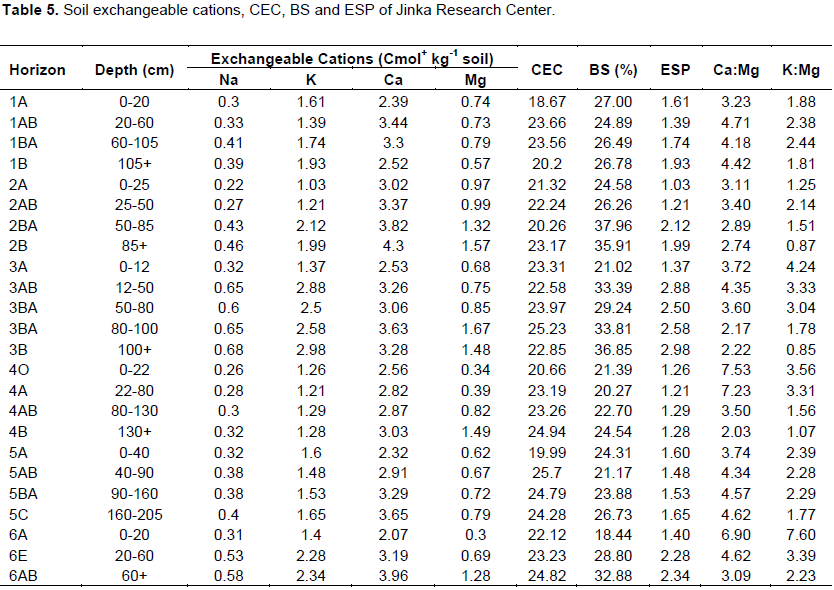
The cation exchange capacity (CEC) ranged from 18.16 to 25 Cmol (+) kg-1 (Table 5) and classified as a moderate which ranges from 12 to 25 Cmol (+) kg-1 soils for all profiles (Hazelton and Murphy, 2007; Landon, 1991). In general, there was an increase in CEC with depth which could be due to the strong association between clay contents and CEC. The exchange complex of the soils is dominated by Ca followed by Mg, K and Na (Table 5). According to Havlin et al. (1999), the prevalence of Ca followed by the rest in the exchange site of soils is favorable for crop production. Generally, the exchangeable cations increase with increasing soil depth. The increment was attributed to the leaching of exchangeable cations (Wakene and Heluf, 2003).

The range of critical values for optimum crop production for K, Ca and Mg are from 0.28 - 0.51, 1.25 - 2.5, and 0.25 - 0.5 cmol (+) kg-1 soil, respectively (Sims, 2000). Accordingly, the exchangeable K, Ca and Mg content of the soils are mostly within and sometimes little above the critical values. However, this does not prove a balanced proportion of the exchangeable bases. The ratio of exchangeable Ca/Mg should not exceed 10/1 to 15/1 to prevent Mg deficiency and also the recommended K/Mg are < 5/1 for field crops, 3/1 for vegetables and sugar beets and 2/1 for fruit and greenhouse crops. The Ca/Mg ratio of the studied soils was in the range of 2 - 7 indicating that the response of crops to Mg is not likely. The K/Mg ratio of the studied soils varied from 0.2 to 0.9 and hence it is within the acceptable range for crop production (Havlin et al., 1999). The base saturation (BS), calculated as the sum of exchangeable bases divided by the CEC and multiplied by 100, for all profiles ranges from very low-to-low (20.61 to 35.07%). Low BS is usually associated with low soil pH and the results of this project confirm this fact.
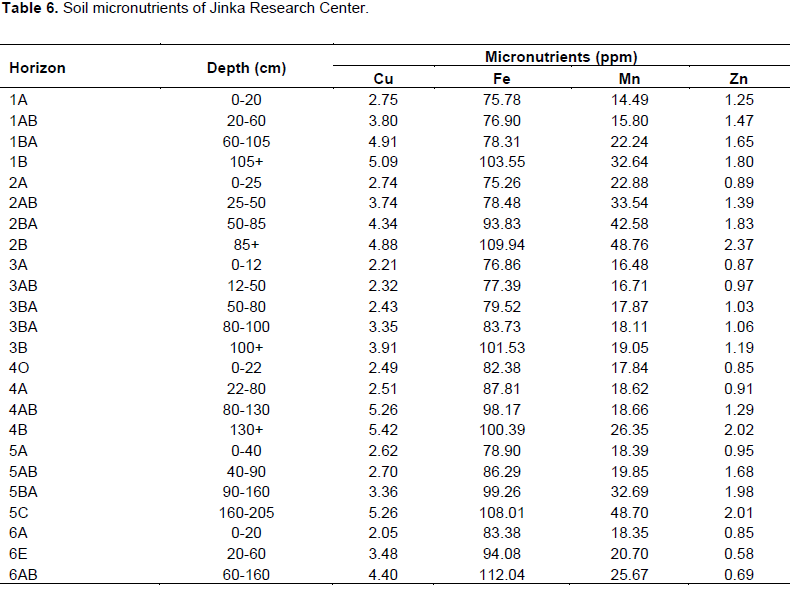
Generally, the concentration of available micronutrients were found to be Fe>Mn>Zn>Cu order. The micro nutrient content of soils is influenced by several factors among which soil organic matter content, soil reaction and clay content are the major ones (Fisseha, 1992). The soils at Jinka are classified as medium (2.21-5.47) for Cu, (75.78-138.73) for Fe, (14.49-48.76) for Mn and (0.58-2.37) for Zn (Table 6). Although they fell into medium classes, most of the figures are found close to the lower margins of the medium class. Therefore, care has to be made and monitoring their status at every five to seven years is vital to keep these soils productive.
CONCLUSION AND RECOMMENDATION
The majority of the fields of the main research field have a very deep (> 150 cm) soil depth. Very dark grey (7.5 YR 3/1) to Dark Brown (7.5 YR 3/2) and dark grey (7.5 YR 4/1) to Black (7.5 YR 2.5/1) for dry and moist conditions represent the color of Jinka soils for both in dry and moist conditions.
Generally, the soil reaction varies from strongly acidic to slightly acidic and further increases with soil depth as the root and all biological activities ceases as the soil depth increases. The soil OM and the associated total nitrogen contents found to be low for all but it varies upto medium. Available P follows similar trends with TN and OM and found to be generally low for all. Exchangeable bases ranges from low to medium. However, the exchangeable Calcium were found to be Medium as the soil reaction rose but for the rest two even goes upto very low. Consequently, the base Saturation found to vary from very low to low as the soil reaction is low that can be accompanied by low levels of exchangeable bases. At Jinka, the micronutrients found to fall in medium.
The dominant soils of JARC are classified based on the criteria of World Reference Base (2006) of FAO/UNESCO and Soil Taxonomy (2010) of USDA. Accordingly, these soils were found to have a clayey B horizon, brown in color, increasing clay content and low base saturation. Besides, they are having low soil pH (mostly less than 6), leached soils from humid areas of the tropics and having a base saturation of less than 50% in most soil profiles. Therefore, these types of soils can be classified as CAMBISOLS according to Soil Taxonomy (2010) and FAO/UNESCO (WRB, 2006). Cambisols generally make good agricultural land and are used intensively. More acid Cambisols, although less fertile, are used for mixed arable farming and as grazing and forest land. In the humid tropics are typically poor in nutrients but are still richer than associated Acrisols or Ferralsols and they have a greater CEC. Therefore, amending the soil with lime, essential and deficient nutrients will be vital for supplying food and feed crops in the region. However, continuous assessment of the nutrient status at every five to seven years is necessary to make sure that the soil quality is maintained.
The authors have not declared any conflict of interest.
REFERENCES
|
Abayneh E (2005). Characteristics, genesis and classification of reddish soils from Sidamo Ethiopia. Ph.D thesis, Universiti of Putra Malaysia. pp. 25-52.
|
|
|
|
Ahn PM (1993). Tropical soils and fertilizer use. Longman Group UK Limited, Longman House, Burnt Mill, Harlow. pp. 112-117.
|
|
|
|
Allison (1965). Methods of soil analysis. Agronomy Journal. pp. 1372-1378.
|
|
|
|
Berhanu D (1980). The physical criteria and their rating proposed for land evaluation in the highland region of Ethiopia. Land Use Planning and Regulatory Department, Ministry of Agriculture, Addis Ababa, Ethiopia.
|
|
|
|
Bouyoucos J (1962). Hydrometer method improved for making particle size analysis of soil. Agron. J. 54:464-465.
Crossref
|
|
|
|
Cottenie A (1980). Soil and plant testing as a basis of fertilizer recommendations. FAO soil bulletin 38/2. Food and Agriculture Organization of the United Nations, Rome.
|
|
|
|
FAO (2006). Plant nutrition for food security: A guide for integrated nutrient management. FAO, Fertilizer and Plant Nutrition Bulletin 16, Rome.
|
|
|
|
FAO (2008). Guideline for soil description. 4th edition. Food and Agricultural Organization of the United Nation, Rome, Italy.
|
|
|
|
FAO (2008). A guide to laboratory establishment for plant nutrient analysis. FAO fertilizer and plant nutrition bulletin no. 19. Food and Agricultural Organization of the United Nations. Rome, Italy.
|
|
|
|
Foth HD (1990).Fundmentals of soil: Routledge fundamentals of physical geography series, London. pp. 35-40.
|
|
|
|
Fisseha I (1992). Macro and micronutrients distribution in Ethiopian Vertisols landscapes. Ph.D. Dissertation submitted to Institute fur Bondenkunde und Standortslehre, University of Hohenheim, Germany. P. 201.
|
|
|
|
Havlin JL, Beaton JD, Tisdale SL, Nelson WL (1999). Soil fertility and fertilizers. Prentice Hall, New Jersely. pp. 345-355.
|
|
|
|
Hazelton P, Murphy B (2007). Interpreting soil test results: What do all the numbers mean? 2nd Edition. CSIRO Publishing. P. 152.
|
|
|
|
Landon JR (1991).Booker tropical soil manual. A handbook for soil survey and agricultural land evaluation in the tropics and sub tropics.John Wiley and Sons, New York. pp. 94-95.
|
|
|
|
Murphy HF (1968). A report on fertility status and other data on some soils of Ethiopia.
|
|
|
|
Olsen SR, CV Cole, FS Watanabe, LA Dean (1954). Estimation of available phosphorus in soils by extraction with sodium carbonate. USDA Circular 939:1-19.
|
|
|
|
Rayment G, Higginson F (1992). Australian Laboratory Handbook of Soil and Water Chemical Methods.Inkata Press, Melbourne. Australian Soil and Land Survey Handbook, 3 Reeuwijk L (2002). Procedures for Soil Analysis. 6th edition.– Technical Paper/International Soil Reference and Information Centre, Wageningen, The Netherlands.
|
|
|
|
Soil Taxonomy (2010). Key to Soil Taxonomy. Eleventh Edition. United States Department of Agriculture, Natural Resources Conservation Service.
|
|
|
|
Tan KH (1996). Soil smapling, preparation, and analysis. Marcel Dekker, Inc. New York, USA. pp. 68-78.
|
|
|
|
Tekalign T (1991). Soil, plant, water, fertilizer, animal manure and compost analysis. Working Document No. 13. International Livestock Research Center for Africa, Addis Ababa.
|
|
|
|
Wakene N, Heluf G (2003). Forms of phosphorus and status of available micronutrients under different land-use systems of Alfisols in Bako area of Ethiopia. J. Ethiopian Nat. Res. 5:17-37.
|
|
|
|
WRB (2006). World Reference Base for Soil Resources. A framework for international classification, correlation and communication Food and Agricultural Organization of the United Nation, Rome, Italy.
|