ABSTRACT
Soil erosion is of major concern in Abia State, Nigeria. This study adopts a combination of Geographic Information Systems (GIS) and Remote Sensing as a tool to study and map soil erosion menace in Abia State. For this research, several datasets that represent climate, soil, geology, topographic and anthropogenic factors were used as the basic requirements for environmental modeling of soil loss using Universal Soil Loss Equation (USLE) for 1986 and 2003. The results show that 1082.58 tons/acres were lost in 1986 and 1120.59 tons/acres in 2003 in the study area. Also, a negative correlation was found to exist between soil loss and NDVI (Normalized difference vegetation index) value. Soil erosion vulnerability index map as well as risk prone areas maps was produced. This study shows the integration of GIS with remote sensing as an efficient and effective tool in the study and mapping of soil erosions.
Key words: Geographic Information Systems (GIS), Soil erosion, normalized difference vegetation index (NDVI), mapping, Abia State.
Soil erosion is an ecological issue of great concern in the southeastern part of Nigeria in general and Abia State in particular. Erosion problems arise mainly from natural causes but their extent and severity are increasingly being attributed to man's ignorance and unintentional actions (Enabor and Sagua, 1988). According to Ofomata (2009), soil erosion, which is simply a systematic removal of soil, including plant nutrients, from the land surface by the various agents of denudation occurs in several parts of Nigeria under different geological, climatic and soil conditions.
Soil erosion is a dynamic geomorphic event operating on the landscape (Ojo and Johnson, 2010). In spite of technological advancement, erosion menace still remains a major problem in Nigeria (especially in South Eastern Nigeria). The yearly heavy rainfall has very adverse impacts altering existing landscape and forms. Such landforms create deep gullies that cut into the soil. The gullies spread and grow until the soil is removed from the sloping ground. Soil erosion when formed expand rapidly coupled with exceptional storm or torrential rain down the stream by head-ward erosion gulping up arable lands,economic trees, homes, lives, and sacking of families and valuable properties that are worth millions of naira (Umudu, 2008).
In this research, a combination of GIS and remote sensing techniques was adopted as an approach to study soil erosion in Abia State. The research seeks to establish correlation between Normalized Difference Vegetation Index (NDVI) and soil loss. The aim is to explore the possibility of using NDVI as a proxy for indirect measurement of soil erosion. This method involves a quantitative remote sensing study of soil erosion. By utilizing a Landsat ETM+ and Thematic Mapper (TM 5) imagery, this study was aimed at introducing much more simple and handy combinatorial method to retrieve some biophysical parameters so as to examine the soil erosion changes in Abia State. The remote sensing technique has often proved to be a veritable tool for modelling and estimating some biophysical parameters. For instance, recently remote sensing was successfully used to estimate evapotranspiration in the Tajan catchment area of Iran using MODIS images (Rahimi et al., 2015).
Specifically, the objectives of the present study are:
1. To estimate amount of soil loss to erosion in tons per acre per year.
2. To determine the land use types in Abia State from 1986 to 2003.
3. To determine the impact of vegetal cover in soil erosion process using NDVI.
4. To develop erosion vulnerability index for the State.
5. To develop a risk index and determine possible affected towns in the State for mitigation purposes.
The study area
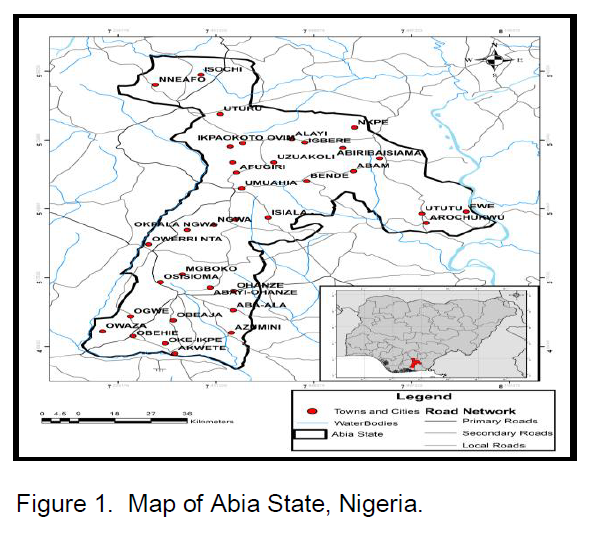
The study area is Abia State, which is one of the 36 states in Nigeria. It lies between latitudes 4°45' and 6° 00’North and longitudes 7°00' and 8°09'East. The State is located east of Imo State and shares common boundaries with Anambra, Enugu and Ebonyi States to the North-West, North and North-East respectively. To the East and South-East, it is bounded by Cross River and Akwa Ibom States and by Rivers State to the South. It occupies a landmass of 5,833.77 square kilometers (Figure 1). Abia State comprises of seventeen (17) Local Government Areas (LGAs).
The rock system and geological history of this area are due to events that took place during the Mesozoic and Cenozoic eras respectively. Her geological structure is divided into three namely, upper coal measure, false-bedded sand stones, and lower coal measure. The upper coal measure formation is the largest geological formation in this region. It comprises mainly of coarse grains, alternating sediments of grey sands, dark shale which contains sands of impure coal in place of vertical horizon.
Abia State experiences a high annual rainfall (about 2000 mm mean/year) with corresponding high discharge of water as runoff that encourages soil erosion. It has a peak period between July and September. Rainfall events have been found to be highly correlated to erosion in all the representative land surface types (Jimoh, 2005).
In this research GIS coupled with the remote sensing technique was adopted to achieve the stated aim and objectives. The primary data include SRTM DEM of Abia State. Also collected were certain relevant existing maps of the state relating to vegetation/land use, population data, geology, rainfall, administrative map, and soil map. The maps were printed and published by the State Ministry of Lands, Survey and Urban Planning, Umuahia, Abia State (2010). The population data was collected from the National Population Commission (NPC) office in Umuahia, Abia State (2011). The secondary data include information on rainfall distribution from January to December (1972-2010). The rainfall data was collected from the Meteorological Department, National Root Crop Research Institute (NRCRI), Umudike, Umuahia (2010).
Available maps were scanned, converting paper map to digital/raster image. The scanned maps were georeferenced and digitized in ArcGIS 9.3 software environment. Feature extraction for Aster DEM and Elevation were also done using ArcGIS software. The bands 4, 5 and 7 of the acquired Landsat ETM, TM, and MSS imagery were enhanced using histogram equalization. The image was already rectified to a common UTM coordinate system (WGS84), and then radiometrically corrected. The rectified image was used in the creation of color composite map; a False Color Composite (FCC) was adopted for this research using bands 4, 5, and 7. In this research supervised classification was used. The homogeneous representative samples of the different surface cover types (information classes) of interest (known as training area) were identified on the imagery. The selection of appropriate training areas was based on the researchers’ familiarity with the geographical area and their knowledge of the actual surface cover types present in the imagery. Maximum likelihood classification (MLC) method was used with remote sensing image data using Idrisi (R15).
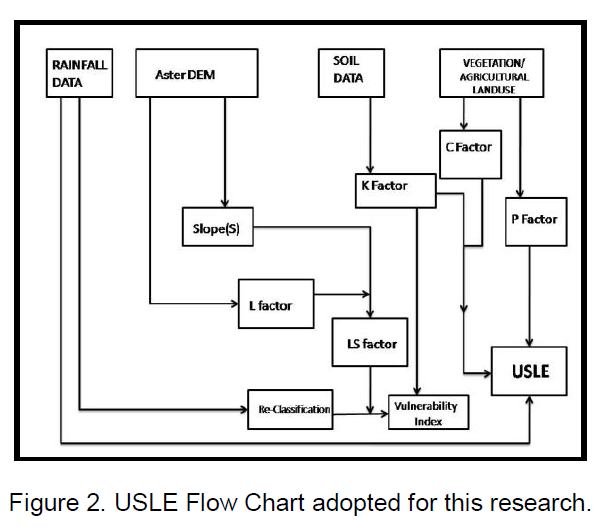
The Universal Soil Loss Equation (USLE), which is a mathematical model used to describe soil erosion processes (Wischmeier et al,. 1960, 1978), was used to derive soil loss in Abia State. USLE was used in ArcGIS 9.3 (using Arc tool box) environment to calculate the soil erosion index for the study area (i.e. Abia State). A model was developed that executed the USLE formula using data from the study area (Figure 2). USLE is an empirical model and its formula is given as:
A = R L S K C P (1)
Where: A = average annual soil loss in tons per acre, R = rainfall and runoff erosivity factor, L = slope length factor, S = slope steepness factor, K = soil erodibility factor,C = cover and management factor, and P = supporting and conservation practices factor.
In general, the USLE model estimates soil erosion by rain drop impact and surface runoff.
Runoff erosivity (R) index
R is the rainfall and runoff erosivity index which is given as:
R = EI30/100.
EI for a given rainstorm equals the product: total storm energy (E) multiplied by the maximum 30-min intensity (I30), E is the kinetic energy in the rainfall and I30 is in inches per hour. R depends on the amount of raindrop energy and rainfall intensity.
Slope length factor
L factor is the slope length factor. Slope length determines the concentration of water. Therefore, the greater the length of slope of a field the greater the concentration of water and run off. A DEM of the study area was used as the source data, and then flow direction and flow accumulation of the study area were computed using ArcGIS tools. The equation used for computing slope length is:
(DEM>Flow Direction>Flow Accumulation*Cell size / 22.13)0.4 (2)
Slope steepness factor
S factor is the slope steepness factor. This is the steepness of the area of study. As a rule, the greater the slope steepness the more erosion that can be expected. DEM data for Abia State was used to compute the S factor in ArcGIS 9.3. The equation used to compute the slope steepness is:
(DEM > Slope > * 3.14 / 180 > sin slope / 0.0869)1.3 (3)
Slope steepness factor (S) was then multiplied with the length factor (L) to derive the LS factor, which is the topographic factor of Abia State.
Soil erodibility factor
K factor is the soil erodibility factor. This is an estimate of the ability of soils to resist erosion, based on the physical characteristics of each soil. It depends on soil structure, texture and composition. In this project, K factor is based on values established in literature. A high K factor indicates a lower water infiltration rate thus more prone to erosion. K factor was derived from tables provided by Roose (1977).
Cover and management factor
Cover and management factor (C factor) indicates the influence of cropping systems and management variables on soil erosion. This factor depends on four sub factors: Prior land use, canopy cover, soil surface cover and surface roughness. The C factor for Abia State was obtained from two sources. C factors for Agriculture (land use), barren ground, primary and secondary forests, urban (Build-up area) and water were obtained from literature review (Roose, 1977). Based on the above, C factor was created for agricultural/vegetation land use, and land use/land cover type for 1986 and 2003.
Supporting and conservation practices factor
P factor is the supporting practices factor. These are the erosion control practices such as contouring, strip cropping, terracing etc. as well as land management practices that reduce soil erosion. The P-factor is the ratio of soil loss under the given condition to soil loss from up-and-down-slope farming as observed in the study area. Therefore it is a value between 0 and 1for each land use type in Abia State. A field trip to carry out ground truthing revealed that there were no measurable conservation measures in the study area.
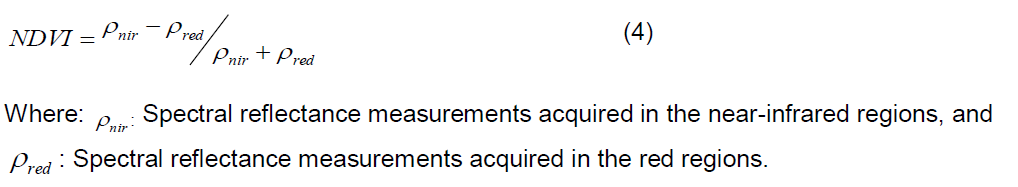
Derivation of normalized difference vegetation index (NDVI)
The normalized difference vegetation index (NDVI) is a simple numerical indicator that can be used to analyze remote sensing measurements, to ascertain whether the target being observed contains live green vegetation or not (Jensen, 2007; Rouse et al., 1973). The NDVI is calculated as follows:
The NDVI value is transformed from -1 to 1 into an 8 bit (0-255) value image. The scale value was used in statistical analysis using correlation model.
Correlation model
The Pearson Product Moment Correlation model was used to determine relationship between soil erosion loss and NDVI value. The correlation model is expressed as follows.
Risk assessment
Risk = H * V (5)
H = Hazard, and V = Vulnerability
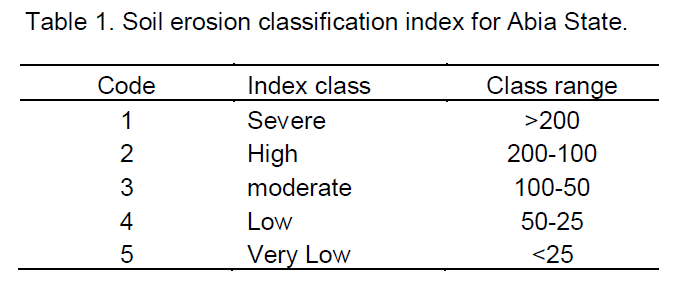
The soil erosion risk was determined from Equation (5) and the values obtained were reclassified into five classes using ArcGIS software based on the criteria stated in Table 1.
Analysis of land use/land covers change
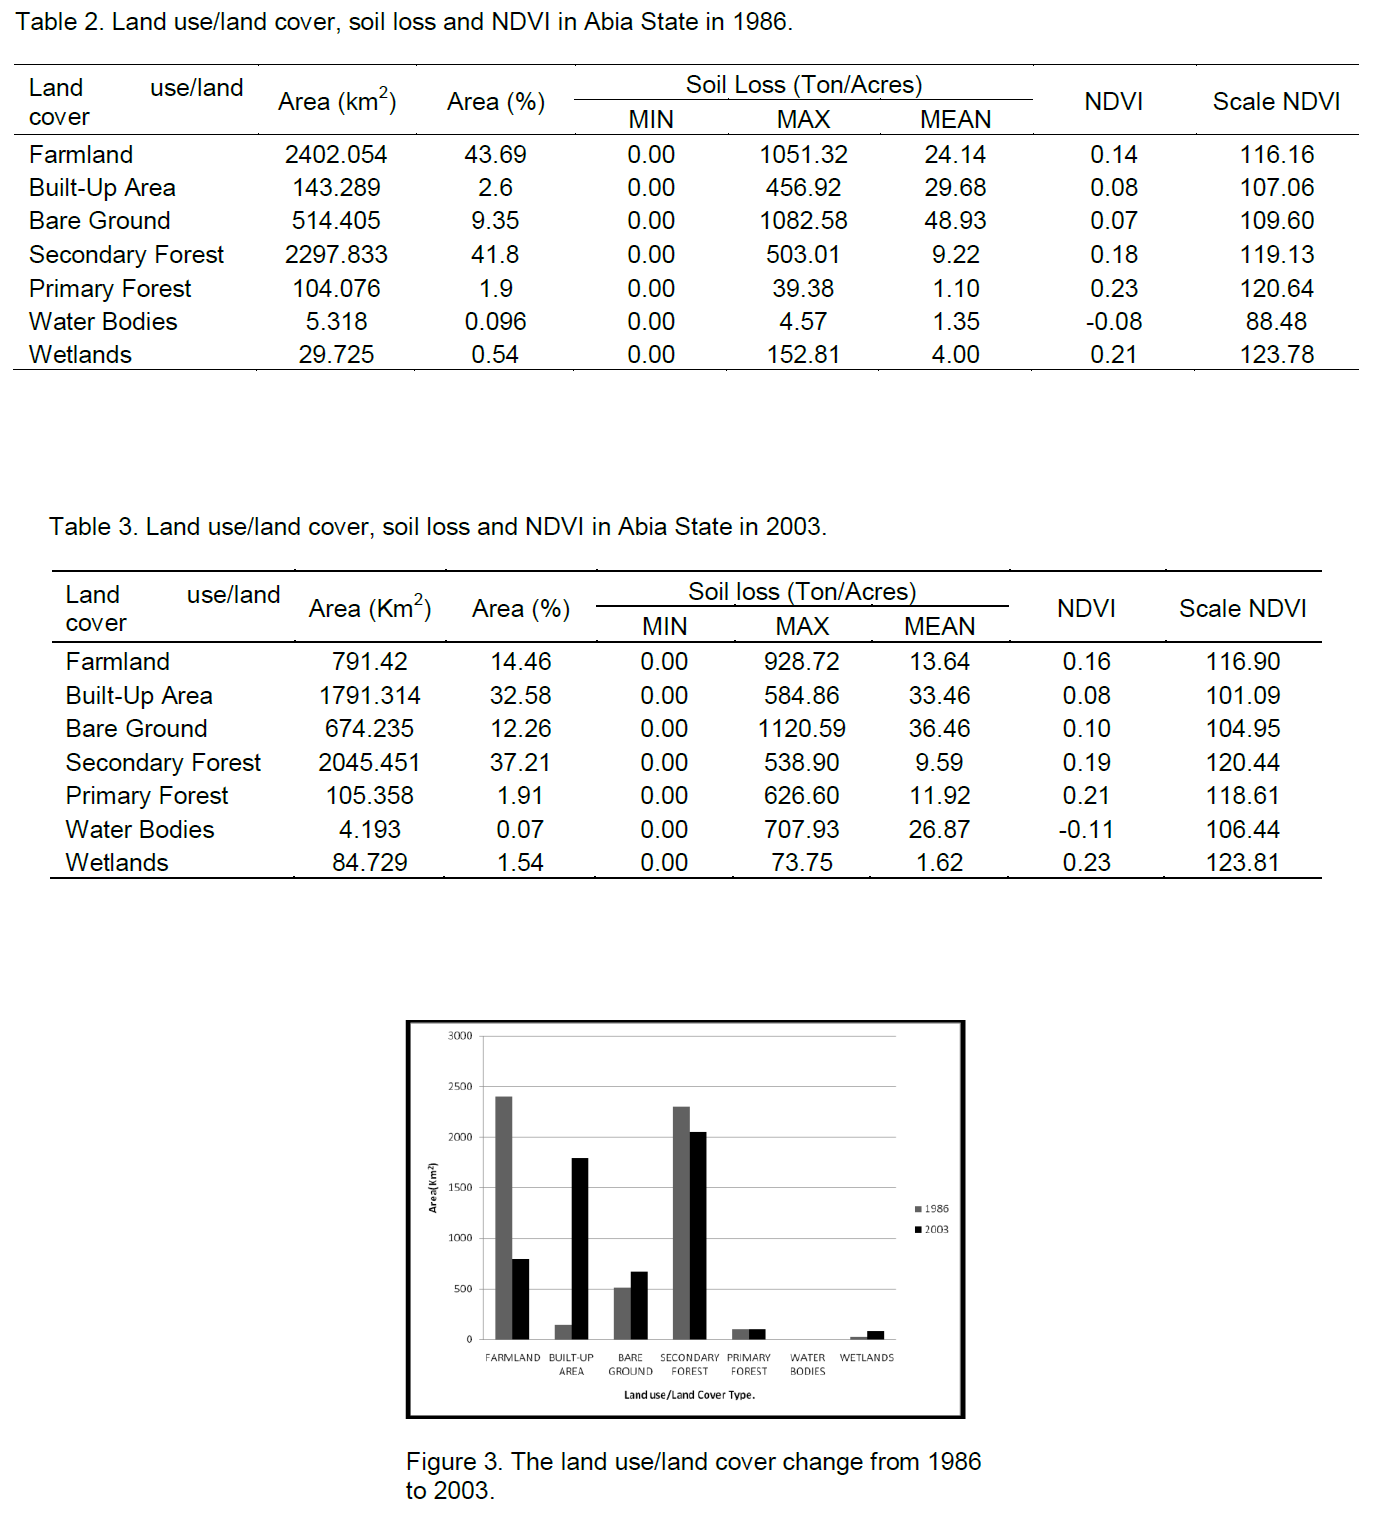
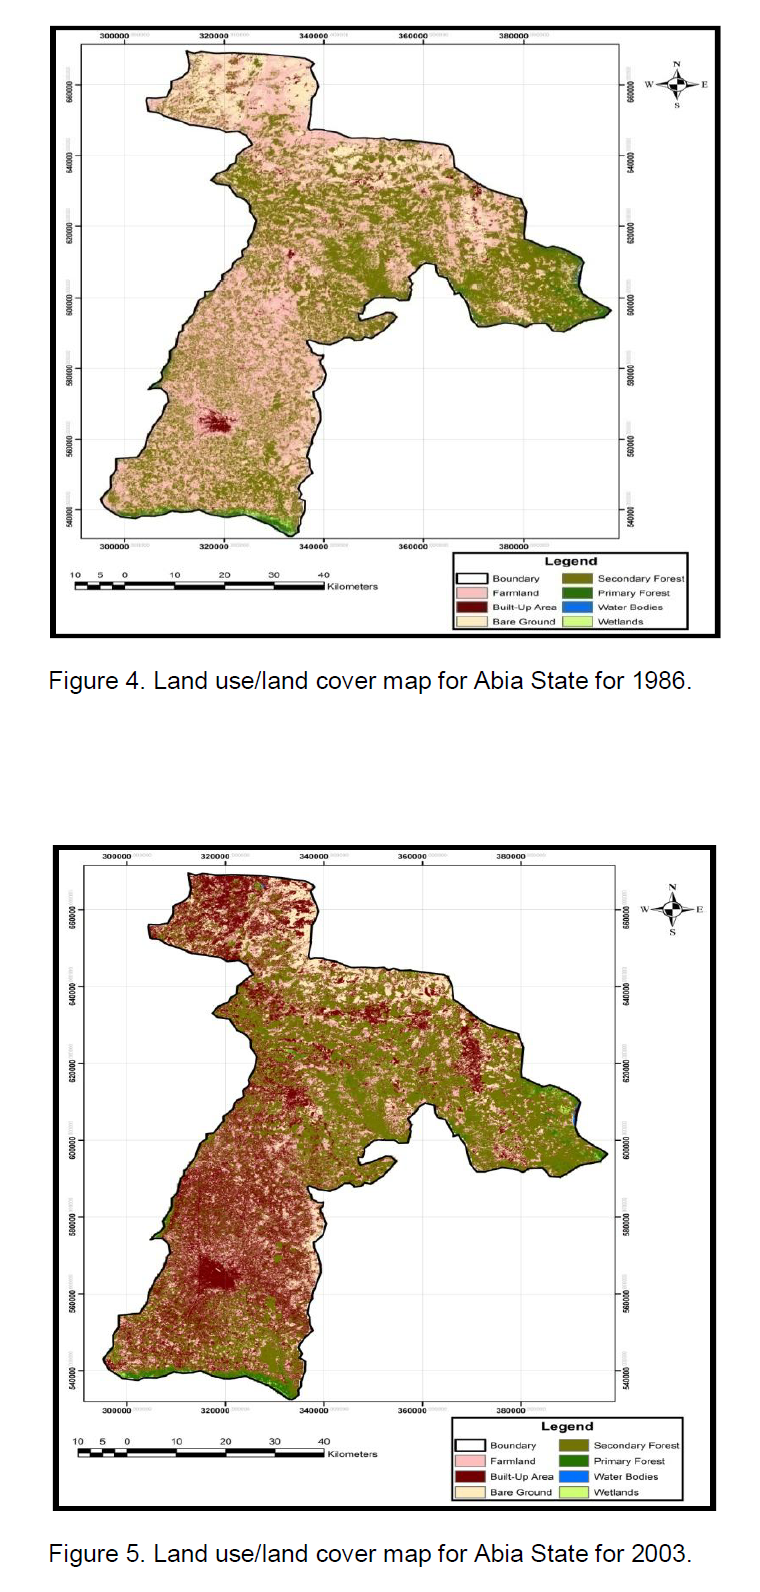
For the purpose of land use/land cover (LU/LC) change analysis, features on the Landsat images were classified into 7 categories namely, built-up areas, farmland (agricultural), primary forested land, secondary forested land, bare ground, wetlands and water bodies. The images were taken in December and February when active agricultural activities in the study area are virtually non-existent. Tables 2 and 3 show the distribution of land use/land, soil loss, and NDVI for Abia State in 1986 and 2003 respectively. Change analysis was conducted on each of the LU/LC categories. The results obtained showed that farm land in the study area was about 2402.05 km2 in 1986 but by 2003 this had reduced to 791.42 km2. On the other hand, while built-up area was 143.289 km2 in 1986 (covering 3%) it increased to 1791.314 km2 in 2003 (covering 33%). The wetland witnessed a loss from 84.729 km2 in 1986 to 29.725 km2 in 2003. Bare ground areas experienced a 12% (674.235 km2) increase in 2003 over the 1986 figure (514.405 km2). Secondary forest in the study area was about 2297.83 km2 in 1986 but it was reduced to 2045.45 km2 in 2003. Primary forest increased marginally from 104.076 km2 (2%) in 1986 to 105.358 km2 in 2003. A decrease in the area of water bodies was experienced from 5.318 km2 in 1986 to 4.16 km2 in 2003.
Figure 3 shows the distribution of land use/land cover change in the study area from 1986 to 2003. Figures 4 and 5 show land use/land cover of Abia State for 1986 and 2003, respectively.
Soil loss estimation
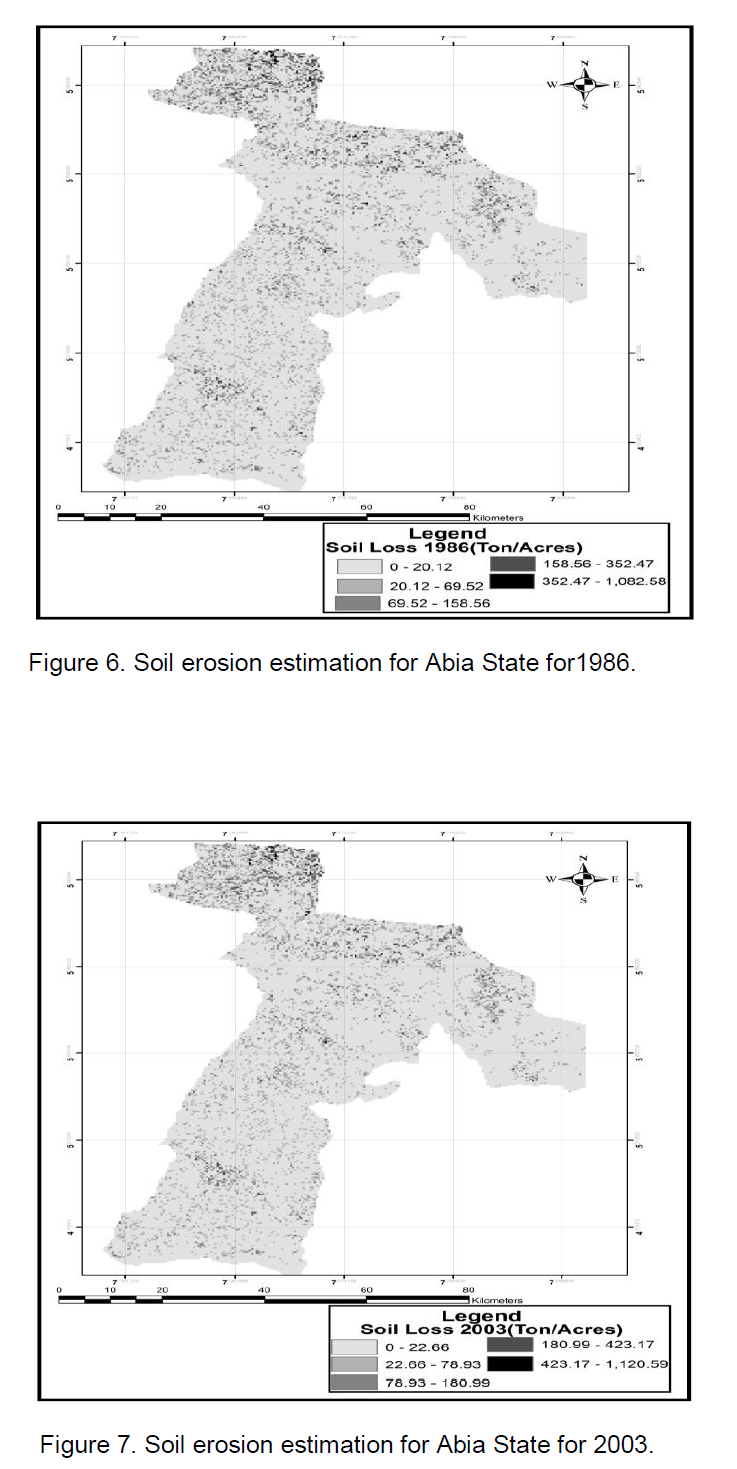
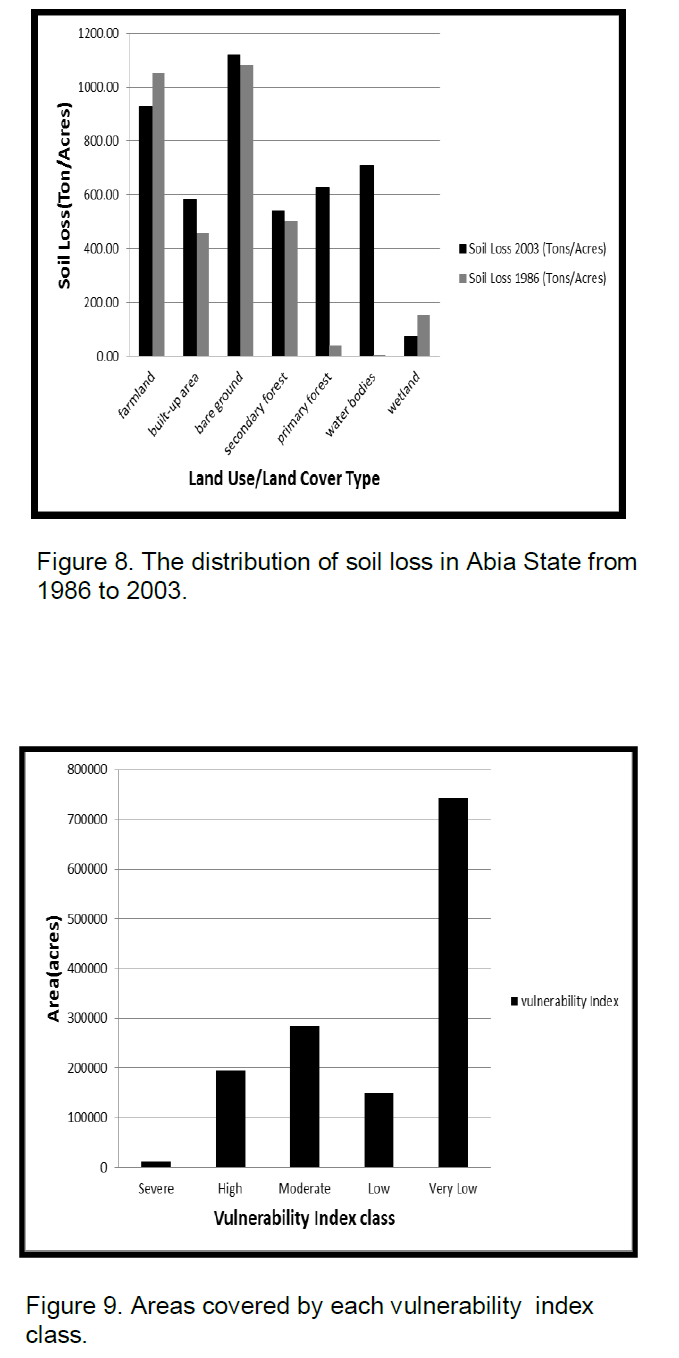
In this study all factors of the USLE model (R, K, SL, C, and P) were integrated to estimate soil loss (ton/acres/year) for the study area due to erosion. Modeling erosion-induced soil loss using the land use/land cover type (as C factor) in the study area and the value ranges from 0 to 1,082.58 ton/acre in 1986 and 0 to 1,120.59ton/acre in 2003 (Figures 6 and 7). Soil loss for various land use/land cover was computed for the study area. For farmlands, in 1986 about 1051.32ton/acre (with a mean value of 24.14 ton/acre) was lost to soil erosion and 928.72 ton/acres (with a mean value of 13.639 ton/acre) in 2003. For built-up areas 584.863 ton/acres (with a mean value of 33.46 ton/acre) was lost in 2003 and 456.921 ton/acres (with a mean value 29.6803 ton/acre) in 1986. Bare ground being the most vulnerable to soil loss experienced 1082.58 ton/acres (with a mean value 48.9331ton/acres) in 1986, and in 2003, 1120.59 ton/acres (with a mean value 36.46 ton/acres) was lost to soil erosion in the State.
The value for secondary forest was found to be 503.009 ton/acres (with a mean value of 9.21ton/acres) in 1986 and 538.903 ton/acres (with a mean value of 9.58ton/acres) in 2003. Primary forest experienced an increase in soil loss from 39.38 ton/acres (in 1986) to 626.60 ton/acres (in 2003). For wetlands, 152.80 ton/acres (with a mean value of 3.99 ton/acres) in 1986 and 73.75 ton/acres (with a mean value of 4 ton/acres) in 2003 were lost to soil erosion in the area. Figure 8 shows soil erosion estimation map for each land use type in the study area.
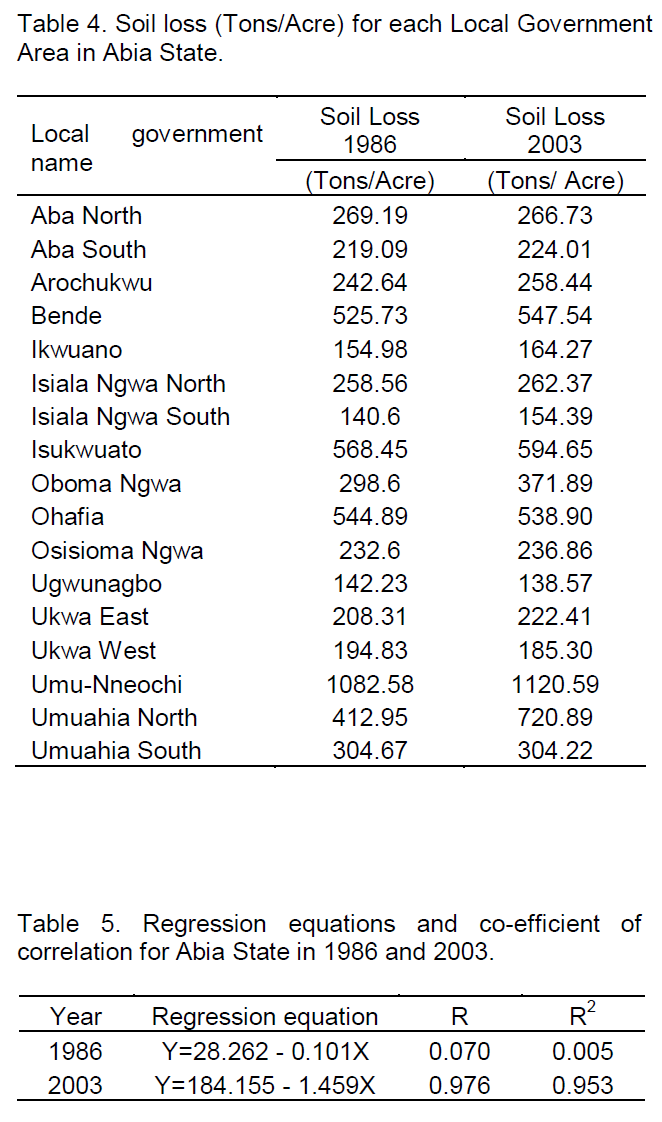
Also, still using the land use/land cover type (as C factor) to model soil erosion, soil loss estimation was determined for each Local Government Area (LGA) in Abia State, for both 1986 and 2003 (Table 4). From the result of the analysis done, Umu-Nneochi has the highest value of 1082.58 tons/acres in 1986 and 1120.59 tons/acres in 2003. Isuikwuato ranks second with 568.45 tons/acres in 1986 and 594.65 tons/acres in 2003. In Ohafia, 544.89 ton/acres was lost in 1986 and 538.90 ton/acres was lost in 2003. Bende experienced an increase in soil loss from 525.73 ton/acres (in 1986) to 547.54 ton/acres (in 2003). In Ikwuano, 154.98 ton/acres and 164.27 ton/acres was lost to soil erosion in 1986 and 2003 respectively. Soil loss values in the Abia State for each land use type are shown in Tables 2 and 3.
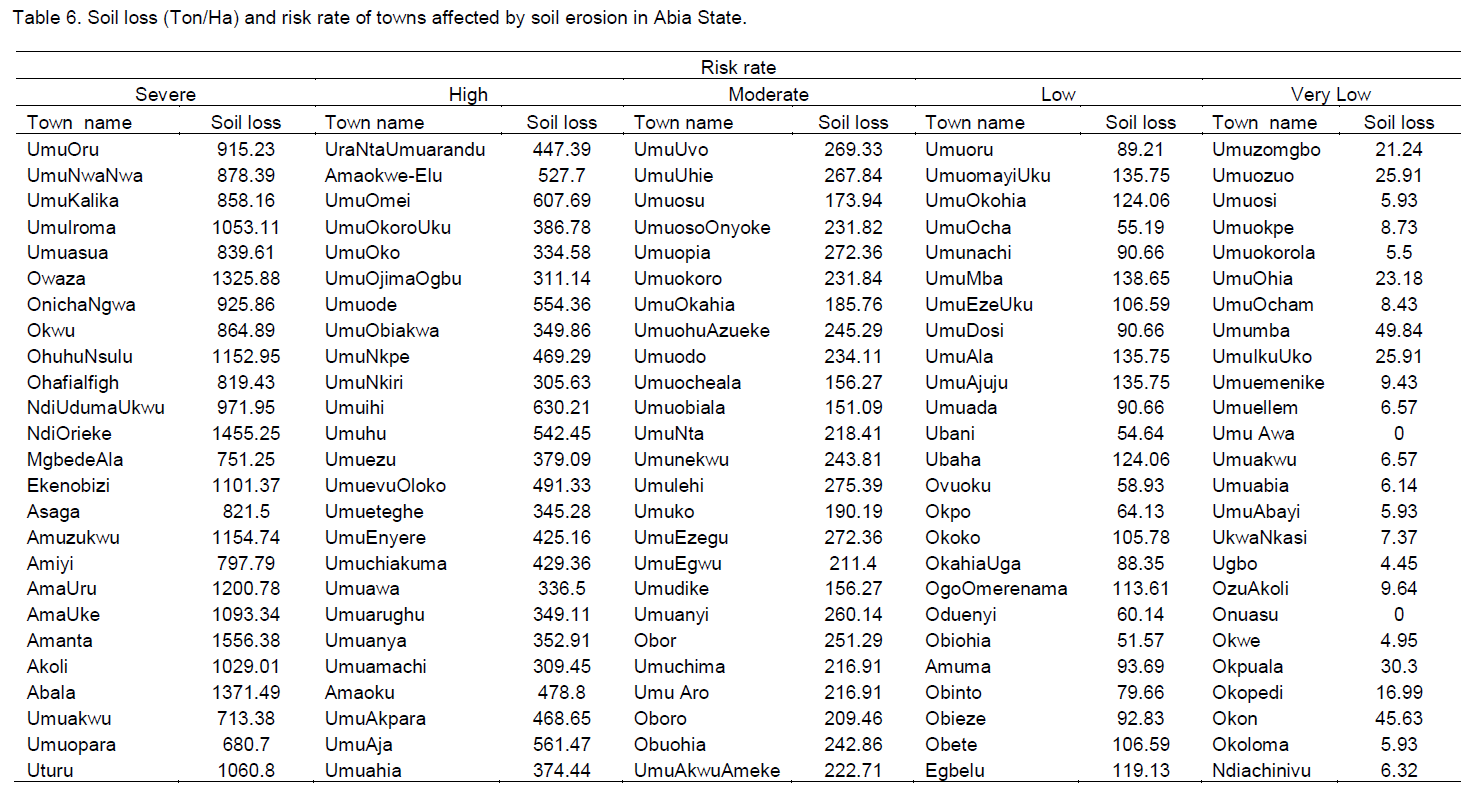
Mapping soil erosion vulnerability
The soil erosion vulnerability of Abia State was analyzed and mapped based on the criteria developed. As shown in Table 6, 7% (120,501 acres) of the State is vulnerable to severe soil erosion while 13% (195,493 acres) is covered by high soil erosion. The tendency of the State being affected by moderate form of soil erosion is just 20% (284,349.99 acres). In the State 27% (148,929.42 acres) is affected by low soil erosion while 33% of the remaining parts of the State experience very low level of soil erosion. Figure 9 shows the distribution of soil erosion vulnerability in the State.
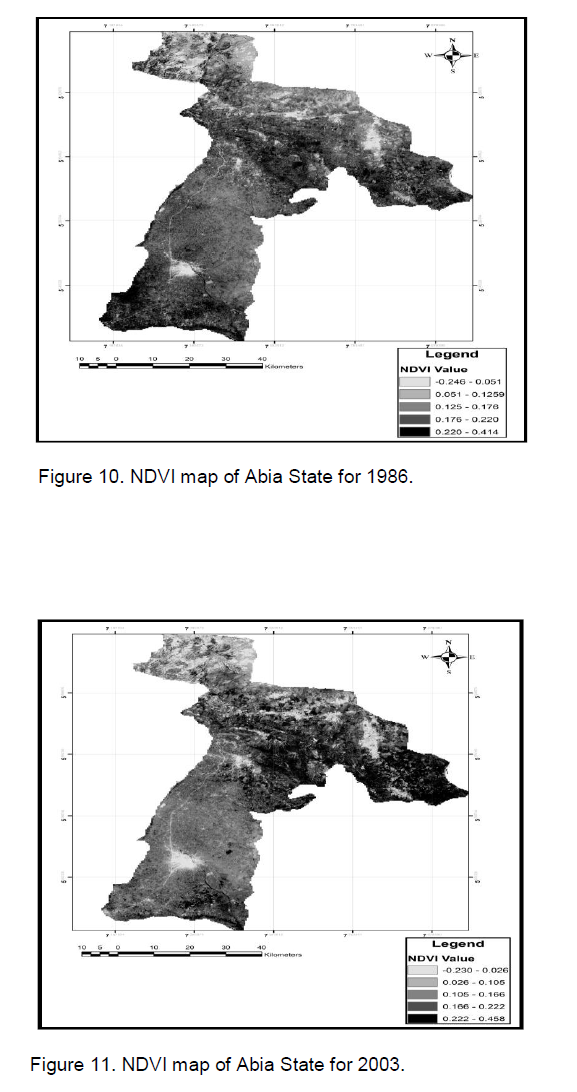
Analysis of vegetation density (NDVI)
The normalized difference vegetation index (NDVI) was analyzed using Landsat-7 ETM+ and TM 5 imagery. NDVI values range from 1 to -1. The value 1(high) represents pixels covered by substantial proportion of healthy vegetation while -1(low) represents pixels covered by non-vegetated surface including water, manmade features, bare soil, and dead or stressed vegetation. NDVI value was scaled to 8 bit image to remove negative values for easy analysis in SPSS. The NDVI values are contained in Tables 3 and 4. As shown in the two tables, forested areas had the highest NDVIvalue while built-up areas had the lowest. This was due to urban development whereby natural vegetation is removed and replaced by non-evaporating and non-transpiring surfaces such as metal, asphalt and concrete. Figures 10 and 11 show NDVI of the study area from 1986 to 2003.
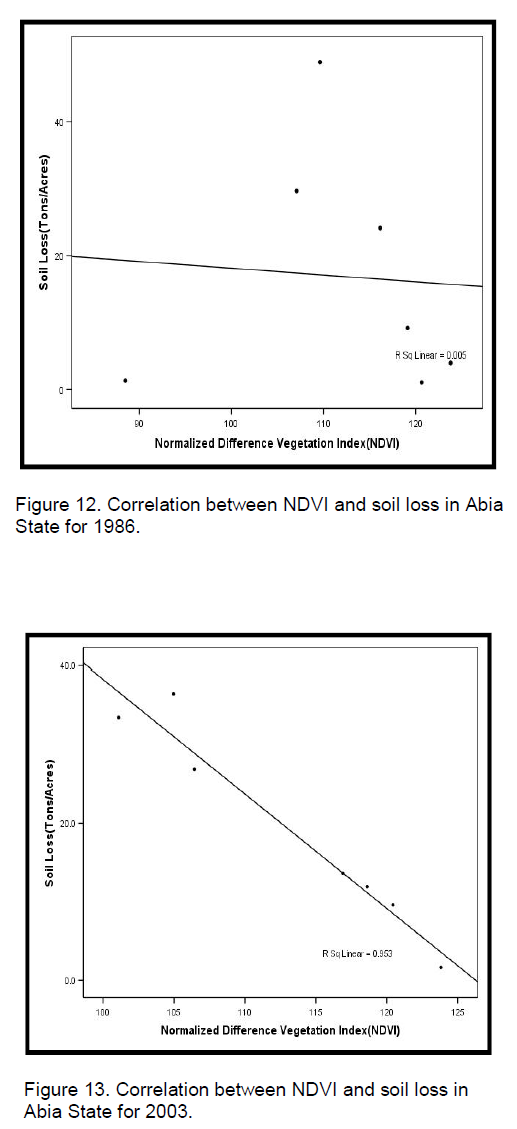
Correlation analysis between NDVI and soil loss
The relationship between soil loss and NDVI was investigated for each land cover type through correlation analysis. It is apparent from the figures obtained that surface temperature values tend to negatively correlate with NDVI values for all land cover types. These correlations can be visualized by plotting the corresponding mean surface temperature values for all land cover types against the NDVI. The regression graphs of the study area from 1986 to 2003 are shown in Figures 12 and 13.
The negative correlation between soil loss estimation and NDVI clearly indicates that the higher the biomass a land cover has, the lower the soil loss. Thus, it is clear from this result that changes in land use/land cover affect soil loss. Regression equations and co-efficient of correlation values are tabulated in Table 5.
Modelling soil erosion risk and affected communities in Abia State
Risk in the context of this paper means the expected degree of soil loss due to potentially damaging erosion phenomenon within a given time. Soil erosion risk was determined by calculating its intensity across the study area. The results obtained were used to rate the various communities on the level of their proneness to soil erosion risk.
Soil erosion risk was determined by multiplying the hazard by vulnerability. The risk index and area coverage was determined for the State and is presented in Table 1. A spatial query analysis was conducted on the database to provide some useful information necessary to understand the phenomenon of soil erosion risk in the study area. Spatial queries were used to determine risk prone areas (Towns) for different index classes in the study area. The communities were classified into severe, high, moderate, low and very low risk prone areas. The towns in Abia State affected by soil erosion and the level of risk are presented in Table 6. As Table 6 indicates, there are twelve (12) communities in the State with the highest values of soil loss (≥1000 tons/ha) and severe erosion risk. The communities are Amanta (1556.38 tons/ha), Ndiorieke (1455.25 tons/ha), Abala (1371.49 tons/ha), Owaza (1325.88 tons/ha), Amauru (1200.78 tons/ha), Amuzukwu (1154.74 tons/ha), Ohuhu-Nsulu (1152.95 tons/ha), Ekenobizi (1101.37 tons/ha), Amauke (1093.34), Uturu (1060.8 tons/ha), Umuiroma (1053.11 tons/ha), and Akoli (1029.01 tons/ha).
Overall, the results reveal that 40% of the State experiences severe form of soil erosion. About 32% experience high soil erosion; 17.51% experience soil erosion moderately, while only 1% of the State is affected by very low erosion. From the results, it is obvious that several communities in Abia State stand the risk of significantly losing their lands, infrastructure, crops, rich natural resources and even lives to soil erosion, if appropriate and effective control measures are not put in place.
Primarily, this research presents a methodology for GIS- based soil erosion risk assessment in Abia State, Nigeria, with relatively little basic information available. The study relied heavily on historical data, natural and human parameters, expert judgment, as well as the relationship between amount of soil loss and NDVI as an indicator to evaluate soil loss magnitude and risk intensity. The methodology adopted in this study can equally be replicated in areas or circumstances where there is little or no basic measurement or data for the direct study of soil erosion. The study of vulnerable areas and risk effects of soil erosion hazards is very helpful for determining the effect of certain mitigation measures, for which a cost-benefit analysis can be carried out. This type of information allows moving away from the “response-only” approach to disaster management, which has been endemic throughout the developing world, to one which incorporates prevention and reduction (Westen et al., 2010).
The authors have not declared any conflict of interest.
REFERENCES
|
Enabor EE, Sagau VO (1988). Ecological Disasters in Nigeria: Soil Erosion (An Introduction) in Sagamu VO, Enabor EE, Ofomata GEK, Ologe KO, Oyebande L. (Eds) Ecological Disasters in Nigeria: Soil Erosion (Federal Ministry of Science and Technology, Lagos). |
|
|
|
Jensen JR (2007). Remote Sensing of the environment: An earth resources.2nd edition, Pearson Prentice hall, Pearson education, Inc. New Jersey. |
|
|
Jimoh HI (2005). Tropical Rainfall Events on Erosion Rate in Rapidly Developing Urban Areas in Nigeria. Singapore J. Trop. Geogr. 26(1):77-80.
Crossref |
|
|
|
Ministry of Lands, Survey and Urban Planning (2010). Town Planning Department, Master Plan of Old defunct Imo State, 1984. |
|
|
|
National Population Commission (NPC) (2011). 2006 National Population Census, [Online] Available: www.population.gov.ng/ (Accessed in 8th October, 2011). |
|
|
|
National Root Crop Research Institute (NRCRI) (2010). Meteorological Laboratory, Meteorological Department, Umudike. |
|
|
|
Ofomata GEK (2009). Soil Erosion in Nigeria: The Views of a Geomorphologist. [Online] Available: www.nuc.edu.ng/nucsite/File/.../No%207%20Inaugral%20Lecture.pd.Accessed October 5, 2014). |
|
|
|
Ojo AD, Johnson O (2010). Erosion problems in a Nigerian rural community. J. Sustain. Dev. Africa, 12(1). |
|
|
Rahimi S, Sefidkouhi MAG, Raeini-Sarjaz M, Valipour M (2015). Estimation of actual evapotranspiration by using MODIS images (a case study: Tajan catchment). Arch. Agron. Soil Sci. 61(5):695-709.
Crossref |
|
|
|
Roose EJ (1977). Application of the universal soil loss Equation of Wischmeier and Smith in West Africa, Greenland DJ, Lal R (Eds) Soil Conservation and Management in the Humid tropics, John Wiley and Son ltd, Printed in Great Britain by William Clowe and Sons, Ltd, London, Beccles and Colchester. |
|
|
|
Rouse JW Jr, Haas RH, Schell JA, Deering DW (1973). Monitoring the vernal advancement and retrogradation (green wave effect) of natural vegetation, Prog. Rep. RSC 1978-1, Remote Sensing Center, Texas A&M Univ., College Station, nr. E73-106393, 93. (NTIS No. E73-106393). |
|
|
|
Umudu M (2008). Residence flees as erosion eats up Anambra Community. In: The Nation Newspaper, Monday, October 20, 2008. Vintage Press Ltd, Lagos. |
|
|
|
Western CJV, Montoya L, Boerboom L, Elena CB (2000). Multi-Hazard Risk Assessment Using GIS In Urban Areas: A Case Study for The City of Turrialba, Costa Rica, International Institute for Geoinformation Science and Earth Observation(ITC), Enschede, The Netherlands, Universidad de Costa Rica, San Jose, Costa Rica [Online] Available: www.adpc.net/audmp/rllw/themes/th1-westen.pdf. (Accessed September 5, 2014). |
|
|
|
Wischmeier WH, Smith DD (1960). A universal soil loss estimating equation to guide conservation farm planning. Proc. 7th Int. Congr. Soil Sci. Soc. 1:418-425. |
|
|
|
Wischmeier WH, Smith D (1978). Predicting rainfall erosion losses: a guide to conservation planning. USDA-ARS Agriculture Handbook No. 537, Washington DC. P. 58. |