Full Length Research Paper
ABSTRACT
Fungi range among the most important organisms in the world thanks to their ecological roles in the ecosystems and their socio-economic importance for human beings. Still, the global fungal species richness is full of uncertainties as evidenced by various estimates. Estimating fungal species richness and diversity is raising many questions related to the sampling effort (in space and time). This study aims to determine the effect of the sampling technique on the diversity measure and natural productions of wild macromycetes in the soudano-guinean forests. Six concentric plots different in the sizes and in the shape were installed in the Isoberlinia doka dominated woodlands. We recorded the number of fruit bodies and the fresh biomass of the species for each plot from June to October 2017. Dendrometric parameters were assessed by counting individual trees with dbh ≥ 10 within plots. A mixed linear model was applied through lme4 package to assess the influence of the size and shape of the plots on the abundance and species richness of macromycetes. An analysis of variances was used to assess the influence of the size and shape of the plots on the fresh biomass. Results showed that the abundance is higher in square plots at sizes 400 and 625m² but the biomass does not different significantly from one shape of plot to another (P = 0.228). Fresh biomass is higher in rectangular plots compared to the square and circular ones. Highest values of specie richness are obtained in the 25 m² for circular plots.
Key words: Diversity indices, sampling technique, macromycetes, natural production, Soudano-Guinean zone, Benin.
INTRODUCTION
Forest ecosystems of the world contain an extraordinary biological diversity. This biodiversity includes all the processes and functions that contribute to the maintenance of life and offering essential services to human beings (Tiecoura et al., 2015). Biodiversity measurement utilizes some techniques and methods that are specific to each taxonomic group of organisms, but the overall output depends upon the sampling effort invested. For each taxonomic group, sampling techniques (Picard, 2007) are defined by considering the specific objective of the study, the geographical and temporal heterogeneity and the human resources required to perform the sampling (Rondeux and Lecomte, 2002). Many others parameters related to the characteristics of the sampling units also should be considered. These include the nature, size, form and sometimes the orientation of the plots. Indeed, the minimal area approach is often used to identify the size of the sampling units in order to characterize plant communities (He and Legendre, 2002). The success of these techniques in the study of plant communities for example depends upon very precise choices of the shape, sizes and nature of the sampling units; whereas, the sampling frequency can vary from one observation per year (Straatsma et al., 2001, Straatsma and Krisai-Greilhuber, 2003) to a weekly interval (Al-thani, 2010). In addition, it is shown that the size of the plots is inversely proportional to the precision of the estimation (Shearer et al., 2007; Salako et al., 2013; Houéto et al., 2013).
Yet, there is no precise standardized technique for optimal measure of mycodiversity in the tropics (Vanié-Léabo et al., 2017; Milenge et al., 2018). Different sampling techniques are used to make an inventory of the fungal communities in an ecosystem (Martínez-Peña, 2008), ranging from opportunistic sampling for inventory purposes to a plots-based survey when it comes to monitoring. Sampling techniques for mycodiversity measures are either executed within permanent plots of square, circular or rectangular shapes, or based on transects of variable sizes (Yorou et al., 2001; Mueller et al., 2004; Hawksworth, 1991, 2003; Vanié-Léabo et al., 2017; Hayward et al., 2015).
Permanent plots of 900 to 2500 m2 have been used in some mycodiversity studies in tropical Africa (Vanié- Léabo et al., 2017; Milenge et al., 2018; Yorou et al., 2001; Kangas and Maltamo, 2006). Still, because the size of permanent plots differs and that the frequency of plots visited has changed from one investigation to another, it becomes difficult to make reliable comparisons even for similar ecosystems. Here we test the influence of plot size and shape on the species richness and fresh biomass of macromycetes in a tropical ecosystem.
MATERIALS AND METHODS
Study area
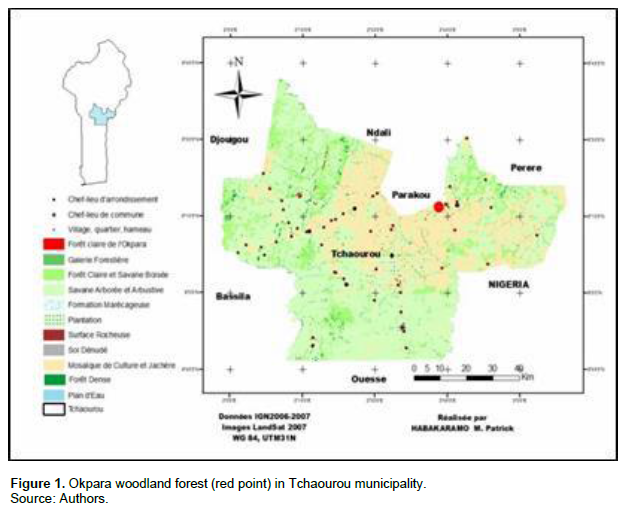
The Okpara woodland forest is located in the Northern zone of Benin, 15 km from Parakou City between 9° 18' and 9° 22' North latitude, 2° 33' and 2° 37' East longitude (Figure 1). It covers an area of 33,000 ha and peaks at an altitude of 295 m. It is a typically tropical climate with one rainy season (from May to October) that strongly contrasts with one dry season. The soil texture in this area is sandy, sandy-clay or loamy in places (Youssao et al., 2000). The vegetation is dominated by Isoberlinia doka and Uapaca togoensis, two forest trees typical for the soudano-guinean zone (White, 1983).
Collection, identification and preservation of specimens
Permanent plots of different shape and sizes were installed in one single vegetation type dominated by I. doka. Three shapes were used: Square (K), Circular (C) and Rectangular (R). For each shape, 6 concentric plots (25, 100, 225, 400, 625 and 900 m2) were installed. Plots are labeled according to their shape, notably; K1 to K6 for square, C1 to C6 for circular and R1 to R6 for rectangular plots. The Geographic Positioning System Garmin Etrex 20™ was used for georeferencing each plot. The surveys were performed at a fixed frequency of 48 h between two surveys during the mycological season from June to October 2017. Thus, 45 visits were carried out per plot, which corresponds to a total of 810 surveys for all 18 plots. During surveys, all fruit bodies of any Ectomycorrhizal (EcM) fungi were harvested and arranged according to the sampling date, plots shape and size. The samples were then transported to the laboratory. The specimens were identified by means of a compound microscope type Leica LMD6 Microdissection Systems available at the Laboratory of Ecology of Botany and Plant Biology (LEB) of the University of Parakou, using some field guide manuals (De Kesel et al., 2002, 2017, Eyi-Ndong et al., 2011) and a catalogue with more than 1000 color pictures. After counting the number of carpophores and measuring the fresh weight with a Sunto™ electronic balance (0.01g precision), the specimens were assigned a unique voucher number. The best specimens of each species were sorted and placed in sieves before final preparation for drying using the Stocklii Dorrex™ brand electric dryer. Drying was done at a temperature between 40 and 45°C for 24 h. Dried specimens were preserved in plastic bags type minigrip and deposited at the Mycological herbarium of the University of Parakou and the dried specimens were kept desiccated in the laboratory.
Data processing and analysis
Dendrometric parameters
The floristic homogeneity of the site was tested by measuring the dendrometric parameters of the trees in each shape of the plots.
Tree density: This is the average number of trees per plot. It is expressed in stems / hectare and mainly concerns trees with a dbh
≥ 10: Ni = n / s, where n: the total number of trees with dbh ≥ 10 cm in the plots and s: the area of the plots (block 6 plots) (ha).
The basal area: It expresses the sum of the basal sections of all trees of dbh ≥ 10 cm found in each block of plots. It is expressed in m² / ha and is represented by the formula below:
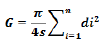
n: the total number of dbh trees ≥ 10cm in the plots; di: diameter of the tree i (m) and s: area of the plot (s = 0.01 ha).
Mycological data
The species richness, the number of fruit bodies, as well as the fresh biomass of each species is computed per sampling date, shape and size of the plot. Time series analysis was applied to assess the evolution of abundance, fresh biomass and specie richness by shape of plots as a function of time during the whole fruiting season. The statistical software R version 3.4.2 R was used (Oksanen et al., 2017; R Core Team, 2017). The rank-frequency curves of the sampled species were constructed for each shape of the plots in order to choose the appropriate diversity index to assess the diversity of macromycetes in the ecosystem. The Shannon diversity index (H) and Pielou equitability index (P) were calculated using the vegan package (Oksanen et al., 2017). Subsequently, the specific estimator (Chao1) was calculated under the Biodiversity R package (Kind and Coe, 2005). To assess the influence of the size and the shape of the plots on the number of fruit bodies and species richness of macromycetes, a Generalized Linear Mixed Effect Model (GLMM) was applied through the lme4 package™. To choose the appropriate minimum model, five models were compared on the basis of the Akaike Information Criterion (AIC). The chosen model was one with the lowest AIC. Analysis of variance (ANOVA) was used to assess the influence of the size and the shape on the fresh biomass of macromycetes by applying the statistical software R version 3.4.2 (R Core Team, 2017; Bates et al., 2015). The temporal sampling effort was assessed by constructing the species accumulation curves as a function of the number of surveys according to the rarefaction method for each shape by using the vegan package (Walker et al., 2008). The certification of floristic homogeneity of the site and the relationship between the dendrometric parameters and the fungal variables (number of fruit bodies, fresh biomass and specie richness) was made by the Spearman's correlation test in statistical software R version 3.4.2 (R Core Team, 2017).
RESULTS AND DISCUSSION
Specie richness of macromycetes by shape and size of the plots
During 19 weeks of investigations, 90 species of macromycetes sorted into 41 genera were harvested. The most represented genera in the ecosystem are essentially Amanita (11 species), Russula (9 species), Termintomyces (7 species) and Lactifluus (6 species). In particular, 63 species accommodated into 26 genera were listed in the square plots against 62 species accommodated into 32 genera within the circular and 60 species sorted into 25 genera in the rectangular plots. A large temporal variation of the specie richness of macromycetes among the plots was observed throughout the mycological season. This taxonomic richness recorded is smaller than those reported from similar but close to other forest ecosystems. Yorou et al. (2001), identified 126 EcM species after various surveys in different regions of Benin. Furthermore, in the Comoé National Park in the Ivory Coast, Vanié-Léabo et al. (2017) mentioned 123 species distributed in 23 genera; while Kamou et al. (2017) identified 179 species and 52 genera in the Fazao - Malfakassa National Park in Togo. Although these variations in species richness among studies can be due to the years covered by each of those surveys, it can obviously be explained by climatic variability, soil composition and also differences in host tree composition.
The standardized average curve in red (Figures 2 and 3) shows that maximal species richness is recorded in June with a peak observed towards the end of June (25 to 30); whilst lowest richness is recorded in July (15 to 25). We found out that the species richness increases with the size of the plots regardless of the shape (Figures 2 and 3). Whatever the size of a square plot is, higher specie richness was recorded in square-shaped plots, while the low scores are observed on the rectangular plots.

Effect of the shape and size of the plots on the species richness of macromycetes
The GLMM results (Table 1) show that the species richness of macromycetes is significantly higher in circular plots (β = 2.0822, p <0.0001) compared to square plots, but there is no difference between the rectangular (β = 0.2587, p = 0.1962) and square plots. Considering the sizes, the richness is significantly lower (β = -1.0761, p = 0.0003) at 25m² for all three shapes of plots. The interdependent effect between the size and the shape of the plots indicate that the greatest richness was noticed for the circular shape compared to the square one (β = 1.0761, p = 0.0004). Above this size, the richness becomes significantly low for circular plots. Guinberteau and Courtecuisse (1997) indicated that the number of fungal taxa collected depends on the sampling period and the size of the area (plot) as well as the survey frequency during the sampling campaign.
Diversity of macromycetes by shape and size of plots
Our results indicate the predominance of rare species than abundant in all blocks of plots (Figure 4). The Shannon diversity index was used for the specific diversity and Piélou's equitability index for the distribution of fruit bodies within the species (Table 2). The Shannon index shows that as the size of the plots increases, the diversity of species becomes more important regardless of the shape of the plots with a high diversity recorded at 900 m². Thus, circular plots harbor the highest diversity index (3.05) for 900 m2 followed respectively by the rectangular (2.95) and the square plots (2.85).
Species diversity estimated in the different plots is calculated with Chao 1 index from the effective specie richness observed in the field (Table 3). The specie richness and the estimated diversity are higher in square- shape plots. Species recovery from our sampling effort is higher in circular (84.64%) compared to rectangular (83.20%) and square (64.81%) plots. This attests that the fruit bodies are less distributed in the circular plots compared to the other two forms.
Abundance of macromycetes by shape and size of plots
We collected 7499 fruit bodies from all plots during the whole mycological season. Among these, 2782 were recorded in square plots, 2584 in rectangular and 2133 in circular plots. The standardized average curve of the abundance of fruit bodies shows almost the same dynamic regardless the shape and size of the plot (Figure5). June constitutes the period of highest abundance with a peak observed on mid-June (10 to 15) for all plots. The other months (July to October) recorded lower abundance.


Effect of the shape and size of the plots on the species abundance
According to the GLMM, the results show that the date of the survey impacted on the abundance at 50% and accounts for the random effect. The fruit bodies abundance is significantly higher in square plots (β =0.1939, p = 0.0297) compared to circular plots, but this difference was not significant between rectangular and square plots (Table 4). However, our results also indicate an interdependent effect between the size and the shape of the plots. The higher abundance observed in square plots compared to circular plots is observed especially for 400 m² (β = 0.2769, p = 0.0052), and 625 m² (β = 0.2705, p = 0.0015) sizes. The same results are noted by Engeman et al. (1994), Kangas and Maltamo (2006), mycological studies, and in several floristic studies reported by Houéto et al. (2013) and Salako et al. (2013) which recommend square plots.
Natural production of macromycetes
The natural production of all species harvested amounts to 92.95 kg/ha per year during the mycological season. The rectangular plots with the highest fresh biomass represent 95.53 kg/ha per year, 94.30 kg/ha and 89.04 kg/ha per year, respectively, for the square and circular plots (Figure 6). Highest fresh biomass was recorded in June (10 to 15) with a highest peak in the circular and rectangular plots and at the end of June (25 to 30) for the square plots. Our results are similar to those mentioned by Yorou et al. (2001) in Wari-Maro forest, but different than those noted by Vanié-Leabo et al. (2017). The difference observed in natural production of macromycetes in this study can be explained by the biotic and abiotic characteristics of the habitats as also noted by Ducousso et al. (2002) and Bonet et al. (2004). In accordance with Straatsma et al. (2001), the fresh biomass and specie richness of macromycetes show several fluctuations from one year to another and it is subjected to habitat fragmentation and climatic fluctuations. In addition, natural production as well as number of fruit bodies shows strong intra-annual fluctuation as already reported in similar ecosystems (Yorou et al., 2001, 2017). In the Soudano-guinean zone, on one hand, macromycetes are very abundant from mid- June to the end of the same month. On another hand, macromycetes are very few (abundance, specie richness and fresh biomass) between the end of July and the end of September during the mycological season.

Effect of the shape and size of the plot on the fresh biomass of macromycetes
According to the ANOVA test, only the size of the plot has a significant effect on the fresh biomass of macromycetes (Table 5). At identical size, the fresh biomass does not differ significantly from one shape of plot to another (p = 0.228); whereas, it does vary significantly according to the size of the plots regardless of the shape (p = <2e-16).
Optimal mycodiversity measure: Temporal sampling effort
Figure 7 illustrates the species accumulation curves as a function of the number of surveys (frequency of visits) within the plots. These curves have almost the same temporal sequential trends. The accumulation curves are all ascending and have not reached an asymptote; the temporal sampling effort was not satisfactory because the specie richness increases during the new visit. As noticed by Vanié-Léabo et al. (2017) and Tedersoo et al. (2007), the species accumulation curves, performed as a function of frequency of visits, did not reach a horizontal asymptote. This would indicate the highest species richness of the study area. It means that the visit frequency is an important factor for estimating the species richness of fungal communities in order to have a standardized temporal sampling effort. Many other studies demonstrated that the mycodiversity studies require several years (3, 8-12, 10 and 21 years, etc.) of sampling to reach the asymptotic curve and that this should be conditioned by standardization of sampling techniques (Guinberteau and Courtecuisse, 1997; Lodge et al., 2004; Mueller et al., 2004; Smith et al., 2011; Straatsma et al., 2001, Straatsma and Krisai-Greilhuber, 2003).
Effect of dendrometric parameters on fungal communities
We recorded 18 tree species ≥ 130 cm in height in the rectangular plots against 17 and 13 species within respectively the square and circular plots. The total density of trees in our inventory plots was 4,811 stems/ha, of which 488 stems/ha were in rectangular plots, 478 stems/ha in square and 333 stems/ha in circular plots. As for the total basal area, it was 943.36 m2/ha; or 977.45 m2/ha for rectangular plots, 923 m2/ha and 647.21 m2/ha, respectively, for square and circular plots. It therefore appears that the density and the basal area differ from one form of plot to another. The results of Spearman's test shows that there is no correlation between the dendrometric parameters (density and basal area of trees) and those of fungi (abundance and fresh biomass of macromycetes) with the exception of species richness (Table 6). Indeed, the species richness is correlated with the density (p = 0.01) and the basal area (p = 0.02) of trees (Spearman test).

CONCLUSION
The main results of this research showed that the abundance is higher in square plots at sizes 400 and 625 m², but the biomass does not differ significantly from one form of plot to another (p = 0.228). Fresh biomass is higher in rectangular plots compared to the square and circular ones. The highest values of species richness were obtained in the 25 m² for circular plots. The information and data collected within this research will allow, in addition to extend the scientific knowledge on fungi (macromycetes) biodiversity, to provide a good methodology and appropriate sampling unity and frequency as well as planning and management of the soudano-guinean tropical forest heritage. We would like to investigate and monitor the aboveground mycodiversity of the Okpara woodland forest for several years using constant sampling units and increasing the number of surveys. It is also desirable to further integrate the floristic, soil and microclimatic parameters to identify all the factors that govern the fruiting of macromycetes in the soudano-guinean zone.
CONFLICT OF INTERESTS
The authors have not declared any conflict of interests.
ACKNOWLEDGMENTS
The authors appreciate World Bank and Government of Japan for their supports through the project N°042-ZR and Japanese Grant TFOA1623. Many thanks to the German Academic Exchange Service (DAAD, grant PKZ 300499) for the provision of the laboratory equipment for taxonomic identification of the specimens and by the Volkswagen Foundation (grant 90-127) and also very grateful to Dr. André De Kesel (Botanic Garden Meise, Belgium) for his critics during the first presentation of the results of this study. The authors are grateful for the help render by the staff of Laboratiore d’Ecologie, de Botanique et de Biologie Végétale (LEB) of the University of Parakou in Benin.
REFERENCES
|
Al-thani RF (2010). Survey of Macrofungi (including Truffles) in Qatar. KBM Journal of Biology 1(2):26-29. |
|
|
Bates D, Maechler M, Bolker B, Walker S (2015). lme4: linear mixed-effects models using S4 classes. R package version 1.1-8. R. Journal of Statistical Software 67. |
|
|
Bonet JA, Fischer CR, Colinas C (2004). The relationship between forest age and aspect on the production of sporocarps of ectomycorrhizal fungi in Pinus sylvestris forests of the central Pyrenees. Forest Ecology and Management 203(1-3):157-175. |
|
|
Ducousso M, Ba AM, Thoen D (2002). Les champignons ectomycorhiziens des forêts naturelles et des plantations d'Afrique de l'Ouest: une source de champignons comestibles. Bois et Forêts Des Tropiques 275(1):51-62. |
|
|
Engeman RM, Sugihara RT, Pank LF, Dusenberry WE (1994). A comparison of plotless density estimators using Monte Carlo simulation. Ecology 75(6):1769-1779. |
|
|
Guinberteau J, Courtecuisse R (1997). Diversité des champignons (surtout mycorhiziens) dans les écosystèmes forestiers actuels. Revue Forestière Française 49:25-39. |
|
|
Hawksworth DL (2003). Monitoring and safeguarding fungal resources worldwide: the need for an international collaborative MycoAction Plan. Fungal Diversity 13:29-45. |
|
|
Hawksworth DL (1991). The fungal dimension of biodiversity: magnitude, significance, and conservation. Mycological Research 95(6):641-655. |
|
|
He F, Legendre P (2002). Species diversity patterns derived from species area models. Ecology 83 (5):1185-1198. |
|
|
Hayward J, Horton TR, Pauchard A, Nuñez MA (2015). A single ectomycorrhizal fungal species can enable a Pinus invasion. Ecology 96(5):1438-1444. |
|
|
Houéto G, Fandohan B, Ouédraogo A, Ago EE, Salako VK, Assogbadjo A, Sinsina B (2013). Floristic and dendrometric analysis of woodlands in the Sudano-Guinean zone: A case study of Belléfoungou forest reserve in Benin. Acta Botanica Gallica159(4):387-394. |
|
|
Kangas A, Maltamo M (2006). Forest inventory: methodology and applications (Vol. 10). Springer Science & Business Media. Available at: |
|
|
Kamou H, Nadjombe P, Guelly KA, Yorou SN, Maba LD, Akpagana K (2017). Les Champignons sauvages comestibles du Parc National Fazao-Malfakassa (PNFM) au Togo (Afrique de l'Ouest). Diversité et Connaissances Ethnomycologiques 27(1):37-46. |
|
|
Kind R, Coe R (2005). Analysis of ecological distance by clustering. Tree Diversity Analysis, A Manual and Software for Common Statistical Methods for Ecological and Biodiversity Studies 1:139-152. |
|
|
Lodge DJ, Ammirati JF, O'Dell TE, Mueller GM (2004). Collecting and Describing Macrofungi. Biodiversity of Fungi: Inventory and Monitoring Methods. Amsterdam: Elsevier Academic Press. pp. 128-158. |
|
|
Rondeux J, Lecomte H (2002). L'inventaire permanent des ressources forestières: observatoire et base d'un tableau de bord de la forêt wallonne. Les Cahiers Forestiers de Gembloux.14. ISSN: 0777-9992 D/2005/6026/34. |
|
|
Mueller GM, Bills GF, Foster MS (2004). Biodiversity of Fungi: Inventory and Monitoring Methods. Elsevier Academic Press. |
|
|
Martínez-Peña F (2008). A sampling method for estimating sporocarps production of wild edible mushrooms of social and economic interest. Investigación Agraria: Sistemas Y Recursos Forestales 17(3):228-237. |
|
|
Milenge KH, Nshimba SWH, DE KESE A (2018). Macrofungal diversity in Yangambi Biosphere reserve and Yoko reserve rainforests of the Democratic Republic of the Congo. International Journal of Biodiversity and Conservation 10(9):348-356. |
|
|
Oksanen J, Blanchet FG, Friendly M, Kindt R, Legendre P, McGlinn D, Wagner H (2017). Vegan: Community Ecology Package. R Package Version.2.4-3. |
|
|
Picard N (2007). Dispositifs permanents pour le suivi des forêts en Afrique Centrale: un état des lieux. Cirad, 38. Available at: |
|
|
R Core Team (2017). R: A Language and Environment for Statistical Computing. R Foundation for Statistical Computing, Vienna, Austria. Available at: |
|
|
Salako VK, Glele KRL, Assogbadjo AE, Fandohan B, Houinato M, Palm R (2013). Efficiency of inventory plot patterns in quantitative analysis of vegetation: A case study of tropical woodland and dense forest in Benin. Southern Forests 75(3):137-143. |
|
|
Shearer CA, Descals E, Kohlmeyer B, Kohlmeyer J, Marvanova L, Padgett D, Voglymayr H (2007). Fungal biodiversity in aquatic habitats. Biodiversity and Conservation 16:49-67. |
|
|
Straatsma G, François A, Simon EG (2001). Species richness, abundance, and phenology of fungal fruit bodies over 21 years in a Swiss forest plot. Mycological Research 105(5):515-523. |
|
|
Straatsma G, Krisai-Greilhuber I (2003). Assemblage structure, species richness, abundance, and distribution of fungal fruit bodies in a seven-year plot-based survey near Vienna. Mycological Research 107(5):632-640. |
|
|
Smith ME, Henkel TW, Catherine AM, Fremier AK, Vilgalys R (2011). Ectomycorrhizal fungal diversity and community structure on three co-occurring leguminous canopy tree species in a Neotropical rainforest. New Phytologist 192(3):699-712. |
|
|
Tedersoo L, Suvi T, Beaver K, Kõljalg U (2007). Ectomycorrhizal fungi of the Seychelles: diversity patterns and host shifts from the native Vateriopsis seychellarum (Dipterocarpaceae) and Intsia bijuga (Caesalpiniaceae) to the introduced Eucalyptus robusta (Myrtaceae), New Phytologist 175:321-33. |
|
|
Tiecoura K, Abou Bakari Kouassi SE, Bi ON (2015). Pests of mushrooms in Cote d' Ivoire: the case of Volvariella volvacea. International Journal of Agronomy and Agricultural Research 6(4):251-255. |
|
|
Vanié-Léabo L, Yorou NS, Koné, N, Kouamé F, De Kesel A (2017). Diversity of ectomycorrhizal fungal fruit bodies in Comoé National Park, a Biosphere Reserve and World Heritage in Côte d'Ivoire (West Africa). International Journal of Biodiversity and Conservation 9(2):27-44. |
|
|
Walker JF, Miller OK, Horton JL (2008). Seasonal dynamics of ectomycorrhizal fungus assemblages on oak seedlings in the southeastern Appalachian Mountains. Mycorrhiza 18(3):123-132. |
|
|
White F (1983). The vegetation of Africa. Switzerland: Natural Resources Research, Unesco. 356p. |
|
|
Youssao AKI, Ahissou A, Touré Z, Leroy PL (2000). Productivité de la race Borgou à la Ferme d'élevage de l'Okpara au Bénin. Revue d'elevage et de Medecine Veterinaire des pays Tropicaux 53(1):67-74. |
|
|
Yorou NS, De Kesel A, Sinsin B, Codjia J (2001). Diversité et Productivité des champignons comestibles de la forêt classée de Wari-Maro (Bénin, Afrique de l'Ouest). Systematic and Geographic of Plants 71(2):613-625. |
|
|
Yorou NS, Codjia JEI, Sanon E, Tchan IK (2017). Les champignons sauvages utiles?: une mine d'or au sein des forêts béninoises. Bulletin de Recherche Agronomique Du Bénin (BRAB)- Numéro Spécial Ecologie Appliquée, Faune, Flore & Champignons (EAFFC). pp. 31-45. |
|
Copyright © 2024 Author(s) retain the copyright of this article.
This article is published under the terms of the Creative Commons Attribution License 4.0


