The study of trait correlations can allow the identification of occurrence, intensity and direction of associations between characters, providing information to elect the most correlated to the phenotypic performance of main chemical composition components in caryopsis of oat genotypes (Avena sativa L.). Thus, this study aimed to estimate the correlation between traits of chemical composition of caryopses in oat cultivars grown in different environments. In the 2007, 2008 and 2009 seasons, 15 cultivars were grown in Augusto Pestana, Capão do Leão and Passo Fundo, Rio Grande do Sul State, Brazil, following the randomized block design with four replications, with 3.0 m2 plots. Eleven characters related to chemical composition of caryopsis were evaluated. For the set of environments, the phenotypic, genetic and environmental correlations among traits were estimated, followed by the partitioning of genetic correlations into direct and indirect effects on protein, lipid, nitrogen-free extract, and total dietary fiber content through path analysis. The results of this study suggest there is great difficulty in associating simultaneously high chemical quality of oat caryopsis - protein, lipid and total dietary fiber - with high content of carbohydrates. However, since there is no remarkable relationship, it seems to be possible to achieve high contents of β-glucan, important dietary fiber fraction, without interference of other chemical component of oat caryopsis.
The oat grain (Avena sativa L.) is considered high quality food for human and animal consumption. The caryopsis has high concentration of starch and lipids, with predominance of unsaturated fatty acids, and high protein content of excellent nutritional value, with balanced amino acid profile of high digestibility (Pedó et al., 1999; Beber et al., 2002). Besides, oat grains represent an important source of dietary fiber, arranged in soluble and insoluble fractions. The β-glucan is a dietary fiber constituent, and it is the main component responsible for human health benefits conferred by regular oat consumption, reducing serum cholesterol, and thus decreasing the risks of cardiovascular diseases (Butt et al., 2008). Because of its high chemical quality, the oat grain is recognized as functional food (FDA Food Labeling, 1997; ANVISA, 1999).
The increasing demand of oats grains proper for different niches of market, as food industrialization and feed animals, has required the adoption of new attributes as target of selection, besides the grain production components that usually has been adopted. So, the study of expression dynamics and the selection considering chemical components of oat grain has become a major trend in worldwide breeding programs (Ahokas and Manninen, 2000; Loskutov, 2000; Doehlert et al., 2001; Peterson et al., 2005; Chernyshova et al., 2007), also in Brazil (Beber et al., 2002; Silva et al., 2006, 2008; Crestani et al., 2010, 2012; Hawerroth et al., 2013). Grain-producing oat genotypes suitable for human diet, in general, need to present low calorie, lipid and nitrogen-free extract, and high protein and dietary fiber contents (Holland, 1997; Peterson et al., 2005; Chernyshova et al., 2007). However, genotypes proper to feed animals need to produce high caloric grains, characterized by high lipid and nitrogen-free extract, associated with high protein and low β-glucan contents, in order to promote the body mass gain (Marinissen et al., 2004; Martinez et al., 2010; Hizbai et al., 2012).
In oat improvement, genetic gains to be obtained via indirect selection are heavily dependent on correlation of characters considered (Carvalho et al., 2004; Lorencetti et al., 2006). The correlation and path analysis can be performed aiming to understand the dynamic of characters related to chemistry quality of caryopsis of oat genotypes. Correlation is a measure of the degree to which variables vary together or a measure of intensity of association (Steel and Torrie, 1980). However, path analysis studies permit to identify the direct effect of independent variables on dependent variables after removing the influence of all other independent variables included in the analysis (Wright, 1921). These evaluations can help electing the most interfering traits in phenotypic performance of main oat caryopsis chemistry quality components and to assist in developing strategies to achieve genetic gains.
Few studies have been performed or are available to scientific community considering the correlations between the most important chemistry components of caryopsis of oat genotypes cultivated in different environments. Thus, this study aimed to estimate the correlations among traits of chemical composition of caryopses in oat cultivars in different environments, and partition the genetic correlation coefficients in direct and indirect effects on protein, lipid, nitrogen-free extract, and total dietary fiber content by path analysis.
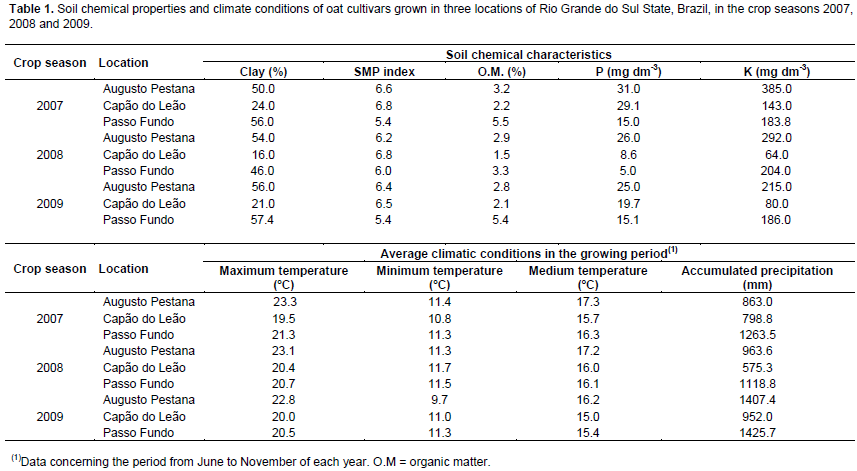
In the 2007, 2008 and 2009 crop seasons, 15 brazilian oat cultivars (A. sativa L.) were tested: Albasul, Barbarasul, Brisasul, FAPA Louise, UPF 15, UPF 16, UPF 18, UFRGS 14, UFRGS 19, UPFA 20, UPFA 22, URS 20, URS 21, URS 22 and URS Guapa. The experiments were conducted in Augusto Pestana (28º27’S and 53º54’W, altitude 280 m) in a Typic Dystrophic Red Latosol (Santos et al., 2006); in Capão do Leão (31º45’S and 52º29’W, altitude 13 m) in a Dystrophic Yellow Red Argisol (Santos et al., 2006); and in Passo Fundo (28°15’S and 52º24’W, altitude 687 m) in a Dystrophic Red Latosol (Santos et al., 2006), Rio Grande do Sul State, Brazil (Table 1). All experiments were conducted following the randomized block design with four replications, adopting a density of 300 viable seeds per square meter, with replicates formed by plots with five rows of 5.0 m long spaced in 0.20 m, with the measurements made from the product in the three core lines, featuring 3.0 m2 plots. The soil preparation and fertility correction followed the oat technical recommendations of Brazilian Oat Research Committee (2006). The fertilization corrections with macronutrients were performed according to the levels observed in the soil chemical quality analysis in each year in order to supply the demands for a grain yield of 2.0 t ha-1 (Table 1). Tebuconazole fungicide applications were performed at a dosage of 0.75 L ha-1 according to the need for shoot disease control during the development cycle.
The evaluated characters aiming to assess the oat grain chemical composition were protein (Prot), β-glucan (β-glu), lipid (Lip), nitrogen-free extract (NFE), total dietary fiber (TDF), insoluble dietary fiber (IDF), soluble dietary fiber (SDF), neutral detergent-soluble fiber (NDSF), acid detergent-soluble fiber (ADSF), ash (Ash) and crude fiber (CF) contents in the caryopsis. For these analyses, samples of manually dehulled 300 grains larger than 2 mm were used, originating from a bulk harvest of each plot. The caryopses were ground in Willey type mill (brand Marconi, Piracicaba, Brazil) with a 0.25 mm sieve opening. The milled material was analyzed in the Food Research Center - University of Passo Fundo, adopting the near infrared reflectance spectrometer (NIRS - brand Perstorp Analytical, model 5000, Maryland, USA). The calibration curves for chemical quality traits determination adopting the NIRS were built by the Laboratory of Physical Chemistry of the Food Research Center, University of Passo Fundo. The New Infrasoft International software (ISI, 1996) was used to obtain these curves, considering the analysis of 100 oat samples following the methods specified by AACC (1999) and AOAC (1997). The protein content was obtained by multiplying the correction factor 6.25 for N content identified in the sample. NIRS readings were performed in triplicate and the results expressed in g 100 g-1 in dry weight basis.
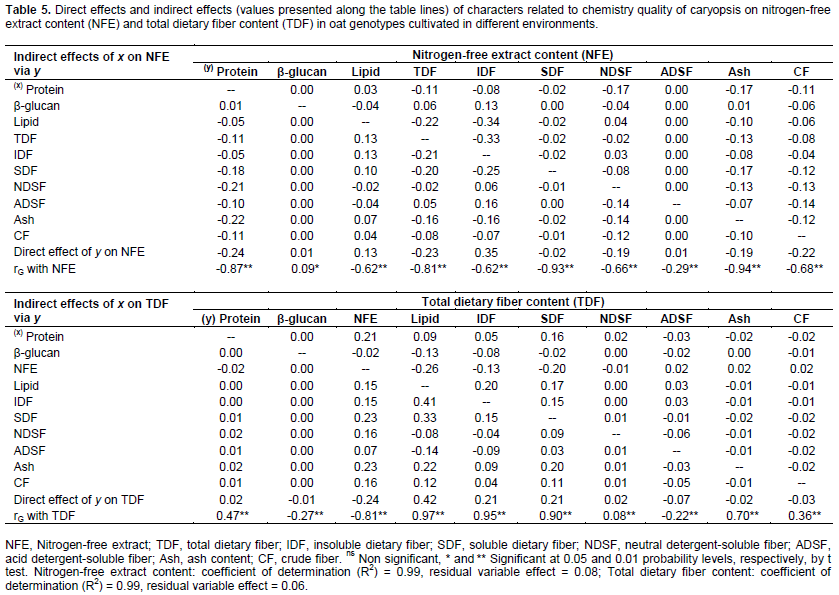
For the group of nine environments tested the coefficients of phenotypic (rp), genetic (rG) and environmental (rE) correlations among all traits were estimated using the expected mean square [E(MS)] by variance analysis, as described by Falconer and Mackay (1996). The hypotheses were tested at 5% probability by t test described by Steel and Torrie (1980). A total of n-2 degrees of freedom were used, following the model: t=r/√[(1-r2)/(n-2)], “r” being the coefficient of correlation between traits X and Y, and “n” the degrees of freedom in the generation considered. The rG were partitioned into direct and indirect effects of traits (independent variables in the regression model) on protein, lipid, NFE and TDF (basic variables) through path analysis (Wright, 1921). The degree of multicollinearity of the singular matrix X'X was established based on its number of conditions, which is the ratio between the highest and the lowest eigenvalue of the matrix of genetic correlations (Montgomery and Peck, 1981). The analysis of the genetic correlation matrix eigenvalues was performed to identify the nature of the linear dependence among the traits, detecting those that contributed to the occurrence of multicollinearity (Belsley et al., 1980). All procedures and analysis were run on the GENES software (Cruz, 2013).
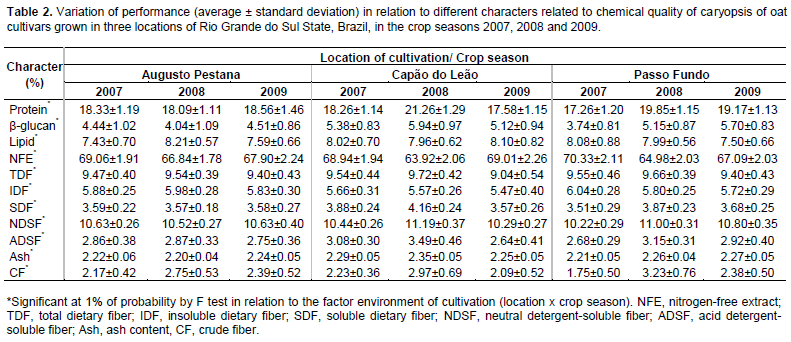
The environment of cultivation showed a significant effect in the phenotypic expression of all characters evaluated considering the average behavior of the oat cultivars (Table 2). The results observed in this evaluation are in agreement with the literature since studies show that the phenotypic behavior of chemical components of caryopsis in oats are interfered by environment conditions and the traits correlations tend to be likewise variable (Peterson, 2005; Martinez et al., 2010; Crestani et al., 2012). So, evaluating oat genotypes along a considerable number of environments is valuable in order to permit the analysis of which relationships between traits are more stable across environments and in fact significant, and thus able to assist breeder decisions aimed at genetic improvement of oat.

Considering the performance of oat cultivars cultivated in Capão do Leão, Augusto Pestana and Passo Fundo in the 2007, 2008 and 2009 seasons, the environmental correlations (rE) between the caryopsis chemical components are presented on Table 3. It is possible to observe that most of significant environmental correlations were positive, with the highest magnitudes showed between protein and the characters NDSF (rE = 0.89), Ash (rE = 0.78), SDF (rE = 0.72), and by the relation of TDF with IDF (rE = 0.78) and SDF (rE = 0.70), so, both characters were harmed or benefited by the same variations in environment (Falconer and Mackay, 1996). However, the most expressive negative environmental correlations were observed between NFE and the character protein (rE = -0.86), NSDF (rE = -0.83), SDF (rE = -0.70), TDF (rE = -0.69), and ash (rE = -0.62), indicating that the environment favored one character over another.
In study, the most part of phenotypic correlations (rP) presented magnitude slightly superior than the genotypic correlations (rG) (Table 3). This behavior can be attributed to environmental modifying effects on associations between characters, reflecting in the reduction of its expression front of environmental influences. However, many significant correlations of low magnitude were detected and identified by t test at 5% (≥0.09) and 1% (≥0.11). Plan strategies of indirect selection based on these associations can lead to inefficient process of genetic gains, since it can be result of a weak genetic correlation (genetic linkage and pleiotropy). Thus, the main associations between characters are particularly highlighted.
In Table 3, the character protein showed strong positive correlations with ash (rP = 0.90; rG = 0.93), NDSF (rP = 0.88; rG = 0.87), SDF (rP = 0.75; rG = 0.75), CF (rP = 0.47; rG = 0.48), TDF (rP = 0.48; rG = 0.47), and with ADSF (rP = 0.42; rG = 0.42), meanwhile, presented negative correlations with NFE (rP = -0.87; rG = -0.87). As regards the caryopsis component lipid, positive correlations were revealed in relation to IDF (rP = 0.94; rG = 0.98), TDF (rP = 0.94; rG = 0.97), SDF (rP = 0.75; rG = 0.78), and with ash (rP = 0.45; rG = 0.52). Also, expressive negative correlations were observed between lipid and NFE (rP = -0.60; rG = -0.62). The fraction of NFE corresponds to non-structural carbohydrates present in the oat caryopsis, formed mainly of starch, sucrose and pectin present in the cell content, featuring an indicative of caryopsis energy. The starch content in oat grains tends to be positively correlated with the hectolitre weight (Martinez et al., 2010). In this sense, evaluating the performance of oat cultivars in different environments, Peterson et al. (2005) verified that the lipid content in oat grains was negatively associated with kernel and groat size and groat percentage.
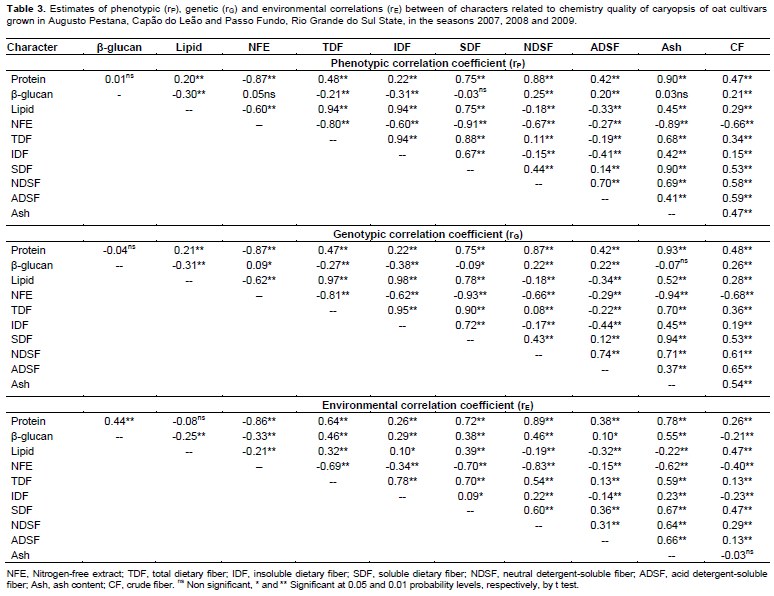
Besides the relations already presented earlier, the TDF presented positive correlations with IDF (rP = 0.94; rG = 0.95), SDF (rP = 0.88; rG = 0.90), and with ash (rP = 0.68; rG = 0.70), and negative correlation with NFE (rP = -0.80; rG = -0.81). The NFE also showed high negative correlations with Ash (rP = -0.89; rG = -0.94), SDF (rP = -0.91; rG = -0.93), CF (rP = -0.66; rG = -0.68), IDF (rP = -0.60; rG = -0.62) and with NDSF (rP = -0.67; rG = -0.66). In agreement with these results, Martinez et al. (2010) observed negative correlation between starch and NDSF. The negative correlations of NFE with all other characters suggest a general tendency that the higher the mass of caryopsis forming the oat caryopsis, represented mainly by the non-structural carbohydrates, the lower will be the protein, lipid, and the dietary fiber content, agreeing with results in the literature (Peterson et al., 2005; Martinez et al., 2010; Crestani et al., 2012).
The β-glucan is a structural carbohydrate (hemicellulose) that constitutes about 75% of the endosperm cell walls in oat caryopsis (Butt et al., 2008). Also, the β-glucan is an important dietary fiber component of the oat caryopsis responsible for the reduction of serum cholesterol, and thus reducing the risk of cardiovascular disease, conferred by the regular oat grains consumption when it is associated to proper diet and healthy lifestyle (Andon and Anderson, 2008; Butt et al., 2008). In this evaluation, the β-glucan has not presented strong correlations with any chemical component of caryopsis evaluated. However, it were detected positive relationships of β-glucan with CF (rP = 0.21; rG = 0.26), NDSF (rP = 0.25; rG = 0.22) and ADSF (rP = 0.20; rG = 0.22), and negative associations with lipid (rP = -0.30; rG = -0.31), TDF (rP = -0.21; rG = -0.27) and IDF (rP = -0.31; rG = -0.38) (Table 3). The positive relationship between β-glucan and CF, NDSF and ADSF components is probably explained by the fact of these components are also structural constituents of the cell wall, whose global content is closely related to the number and size of cells in the caryopsis.
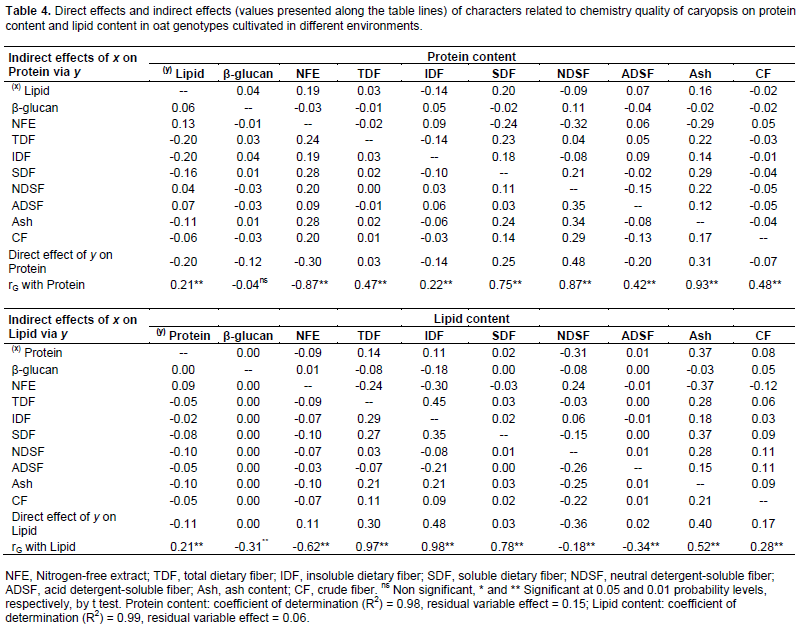
The genetic gains to be obtained via artificial selection are heavily dependent on the combining ability of parents used in the hybridization (Benin et al., 2003, 2005; Bertan et al., 2007), which implies a need for an accurate assessment of genotype potentials in oat breeding programs. The characters with high level of genotypic and phenotypic correlation can be considered in the selection strategies. However, only the genetic correlations involving an association of heritable nature may therefore contribute to the effective targeting of improvement programs (Falconer and Mackay, 1996). As consequence, the genotype correlation coefficients were partitioned into their direct and indirect effects on protein, lipid, nitrogen-free extract, and total dietary fiber content through path analysis aiming to assess if the correlation between two variables was due to a cause and effect or was determined by the influence of other variables (Tables 4 and 5).
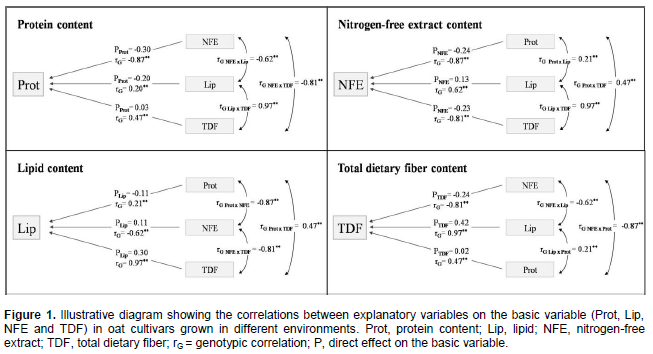
The coefficients of determination of the path analysis model (R2) presented high values in relation to protein (0.98), lipid (0.99), nitrogen-free extract (0.99) and total dietary fiber content (0.99), indicating that the explanatory variables explained a major part of the variation observed in the basic variable considered. The causal diagram illustrating the direct and indirect effects of the most important explanatory variables on the basics variables protein, lipid, nitrogen-free extract, and total dietary fiber content considering the cultivation of oat cultivars in different environments are shown in Figure 1.
In general, it is observed that the most part of direct effects magnitudes were lower than the genotypic correlations magnitudes (Figure 1, Tables 3 and 4). So, much of the genetic correlation detected between the characters is not directly explained by cause and effect relationship, but it is resultant of the set of indirect effects that are exercised via other variables related to the main characters considered.
Confirming the strong genotypic correlations with Protein (Table 3), the characters SDF, NDSF and ash presented positive direct effects on protein expression (0.25; 0.48 and 0.31, respectively), while NFE showed significant negative direct effects (-0.30) (Table 4). Also, the most significant indirect effects of independent variables on protein were performed via SDF, NDSF, ash and NFE. However, despite of positive genetic correlations with protein, the components lipid and ADSF (0.21 and 0.42, respectively) showed negative direct effects on protein content (-0.20 and -0.20, respectively). The negative causal and effect relationship between lipid and protein are reinforced by direct effects of protein on lipid content (-0.11) (Table 4).
Based on the literature, there is no consistent relationship between oil percentage and protein content in oat caryopsis, since in the different studies are reported the occurrence of positive and negative correlations, or even no significant correlations (Peterson et al., 2005; Silva et al., 2008; Martinez et al., 2010). These inconsistencies may be attributed to the evidences that these traits have polygenic inheritance, with strong contribution of additive effects, and the environmental contribution in the phenotypic definition is variable (Zhu et al., 2004; Orr and Molnar, 2007; Crestani et al., 2012; Hizbai et al., 2012).
A weak negative direct effect of β-glucan in relation to Protein content (-0.12) was detected, despite the absence of genotypic correlation between these traits. This way, the selection based on high protein content can lead to obtain genotypes with lower content of Lipid, NFE and β-glucan concentrations, but with higher content of minerals (Ash), SDF and NDS. The NDSF showed negative direct effect on lipid expression, even higher than genotypic correlation magnitude (rG Lipid x NDSF = -0.18; direct effect = -0.36) (Table 4). However, the NFE showed positive direct effects on lipid content (direct effect = 0.11), despite the negative genotypic correlation (-0.62).
In the study performed by Banás et al. (2007), the majority of the total lipid in the oat caryopsis was deposited during the first half of grain development when the endosperm was still liquid, whereas both protein and starch deposition proceeded with the same rate to a late stage of development. According to these authors, the endosperm switches glucose utilization to favour starch synthesis over lipid synthesis after de mid-stages of grain development. Meanwhile, Morrison (1988) has suggested that the positive correlations between lipid content and amylase content in isolated oat starches may are explained by the regulation of starch biosynthesis by lipids.
The positive relationship of TDF, IDF and Ash with Lipid was confirmed by their positive direct effects on lipid concentration (0.30, 0.48 and 0.40, respectively) (Table 4). Through the action of the neutral detergent on caryopsis fiber fraction is dissolved the cellular content, formed mainly of protein, lipids, pectin, starch and sugars (non structural carbohydrates), getting the neutral detergent fiber content (NDF), composed basically by cellulose, hemicellulose and lignin. With the sample treatment with acid detergent is separated the content of cellulose and lignin, getting the acid detergent fiber content (ADF). Thus, the basic difference between NDF and FDA fractions corresponds to sample’s hemicellulose content. Therefore, the different magnitudes of direct effects of ASDF and NDF on caryopsis chemical components protein, lipid, NFE and TDF (Tables 4 and 5) can be associated with the hemicellulose synthesis (ADSF - ADSF = hemicellulose).
Except by β-glucan, all other characters showed strong negative correlation with NFE, however, the strongest negative direct effects on NFE expression were performed by protein, TDF and CF (-0.24, -0.23 and -0.22, respectively) (Table 5). Also, IDF and lipid presented positive direct effects on NFE (0.35 and 0.13, respectively) despite of the negative correlations (rG NFE x IDF = -0.62; rG NFE x Lipid = -0.62). The higher magnitudes of indirect effects of independent variables on NFE were performed by protein, TDF and IDF. So, the increase of NFE in the oat caryopsis can lead to lower content of protein and TDF, however, is possible to achieve simultaneously higher contents of IDF and lipid concentrations.
Ash content in oat caryopsis contemplates its inorganic fraction composed of minerals. Peterson et al. (1975) found significant levels of phosphorus, calcium, potassium, copper, manganese, iron, sodium and magnesium present in oats caryopsis. However, despite the importance of many of these minerals in food and feed, its content in the grain has not been considered as a target of selection by oat breeding programs, neither in Brazil nor other countries. Therefore, the observed results were expected, since there is direct positive effect of ash content (mineral matter) on protein and lipid present in the oat caryopsis (0.31 and 0.40, respectively) and negative direct effect on NFE (-0 19), as shown in Tables 4 and 5.
As expected, IDF and SDF showed positive direct effects on TDF (0.21 and 0.21, respectively), however, with magnitude much lower than the genotypic correlations (rG TDF x IDF = 0.95; rG TDF x SDF = 0.90) (Table 5). Part of the relationship between these traits is explained by indirect effects of these independent variables (IDF and SDF) by NFE, lipid, SDF and IDF. The negative relationship between NFE and TDF are reaffirmed by the negative direct effect of NFE on TDF content (-0.24). However, the lipid content showed to have strong direct effects on TDF phenotypic expression (0.42). So, these results suggest that genotypes rich in TDF tend to show concomitantly high contents of lipid as well rather smaller contents of NFE. So, since lipid are strongly positive correlated with TDF while NFE shows negative correlation with TDF (rG =0.97 and -0.81, respectively) indirect selections aiming higher TDF contents can be successful performed based on phenotype higher lipid content or even based on smaller NFE concentration in the oat caryopsis.
The expression dynamic of β-glucan in oat grains has been further studied lately, and, the same way, has been considered as a differential target of selection by breeding programs (Cervantes-Martinez et al., 2001; Zhu et al., 2004; Chernyshova et al., 2007, Crestani et al., 2010, Crestani et al., 2012). In this evaluation no remarkable direct or indirect effects of β-glucan was detected on protein, lipid, NFE and TDF expression, despite of β-glucan genotypic correlations with these characters (rG = -0.04, -0.31, 0.09 and -0.27, respectively) (Tables 4 and 5). These results suggest that the selection based on β-glucan will not interfere substantially in the protein, lipid, NFE and TDF caryopses content. Likewise, Crestani et al. (2010) found significant positive genotypic correlations between β-glucan content with yield of grains and with industrial yield of grains considering oat genotypes cultivated in different environments. So, it suggests the possibility to achieve genotypes rich in β-glucan content and concomitantly highly productive via genetic improvement. Brennan and Cleary (2005) highlight that the relationship between β-glucan levels in cereal grains and grain quality characters, or yield parameters, appear to vary greatly depending upon genetic background of the cereal line being examined.
Similarly, it is noteworthy that the relationships observed are suitable to the analyzed group of genotypes in this study, since the correlations coefficients depend on the gene pool and the environment effects. However, the behavior observed for this set of genotypes can represent trends that can be repeated in other situations, mainly those correlations with higher magnitudes, and could be adopted efficiently in the indirect selection during breeding procedures. Thus, breaking undesirable correlations in segregating populations aiming to attend oat breeding programs demands should be sought by conducting crossings between complementary gene pool associated with generating large populations aiming to increase the opportunities of desired crossing-overs.