ABSTRACT
The objectives of this study are to establish damage functions for the Ramularia areola pathosystem and characterize the damage in cultivars susceptible and resistant to it. The experiment was conducted in the city of Tangará da Serra in the 2012/2013 harvest season. The experimental design was randomized blocks with four replications in a factorial arrangement of four cultivars × four gradients. The plots were divided into two subplots (twin plots). The division I received fungicide applications at intervals of 15, 30 and 45 days and no applications to establish the gradients of the disease, and the division II received weekly applications of fungicide in order to be kept without the disease or at minimum levels. FiberMax 993, FMT 701, FMT 707 RX and IAC 25 RMD cultivars were used with different reactions to ramularia spots. Disease severity was weekly determined and used to calculate the area below the disease progress curve (ABDPC). In addition to area below the severity progress curve (ABSPC), the variables related to the following production components were obtained: seed cotton productivity, damage, percentage of damage to productivity, average number of bolls per plant, weight of one hundred seeds, percentage of fiber, and components related to fiber technological characteristics. Analyses of variance were conducted and data were adjusted by the linear integral model. The ABSPC variable showed a high relation with damage and percentage of damage to productivity. Estimates reached levels of up to 975.42 kg ha-1, or 36.83%, of damage to productivity.
Key words: Damage, functions, Ramularia areola, Gossypium hirsutum, fiber technological characteristics (HVI).
Brazil is the world's fifth largest cotton producer (FAO, 2016). In Brazil, cotton lint production in the 2014/2015 harvest was 1,562,800.00 tons in a cultivated area of 976.2 hectares. 64% of this area is located in the Midwest region, followed by the Northeast region with 32% (CONAB, 2016).
As in many cultures, there are diseases responsible for negative factors, causing damage to crops and losses in agricultural activity. Among the most important cotton diseases, is the ramularia leaf spot, considered by many researchers as the most important disease of cotton in Brazil (Cia and Salgado, 2005).
Ramularia leaf spots were diagnosed for the first time in 1890 in the state of Alabama, United States (Atkinson, 1890). Subsequently, the disease was found in several places that cultivated cotton. All cultivated species of the genus Gossypium were hosts to the disease (Bell, 1981). Ramularia leaf spot, also known as ramulariosis, false mildew, areolate mildew, grey mildew or cotton ramularia are caused by the phytopathogenic fungus Ramularia areola GF Atk. [syn. = Ramularia gossypii (Speg.) Cif., Cercosporella gossypii Speg.] in its asexual or anamorphic form and in its sexual or telemorphic form by Mrycosphaerella areola Ehrlich and FA Wolf (Atkinson, 1890; Suassuna and Coutinho, 2007).
This disease may occur in all plant development stages, causing lesions to both sides of leaves, resulting in a reduction in the photosynthetic area. It accounts for significant damage to productivity and fiber quality of the culture. Favorable climatic conditions for the development of the pathogen are temperatures between 12 and 32°C, the optimal range being 25 and 30°C, and a relative humidity above 80% (Rathaiah, 1977). According to Mohan et al. (2006), the disease worsens in a relative humidity over 90 or 91% and in temperatures from 23 to 27°C.
In recent years, with the increase of the cotton production area, cultivars susceptible to this disease are been used with a greater precocity. Therefore, this increased the potential for damage, being then considered as one of the major cotton diseases (Utiamada et al., 2003). According to Andrade Junior and Galbiere (2014), in the Brazilian center-western region, yield losses caused by Ramularia leaf spot are about 20 to 30% without control (Andrade Junior and Galbiere, 2014), therefore, the potential of damage to production caused by ramularia leaf spots can reach up to 68% in susceptible cultivars (Shivankare and Wangikar, 1992).
Variations in susceptibility levels of cultivars occur probably due to emergence of new races of the pathogen and the use of cultivars that do not have resistance (Polizel et al., 2008). Girotto et al. (2013) found genetic and phenotypic variability in isolates of the fungus, Ramularia areola thus studies to establish the pathogen races are needed.
Traditional evaluation models and quantification of damage are obtained by disease variation in different plots and by relative levels of severity of the disease in relation to production. Thus, damage can be caused by a simple linear regression, where the variable disease is the independent variable, and the reduced productivity, whether in kilograms per hectare or percentage, is the dependent variable (Zadoks, 1985; Amorim and Bergamin Filho, 2011). The damage equation provides biological variables to calculate the economic damage threshold. Thus, the equation becomes necessary for decision-making regarding improvement programs or integrated disease management programs (Amorim and Bergamin Filho, 2011), since there are no cotton cultivars with a satisfactory resistance to ramularia leaf spot. Thus, the use of fungicides is necessary to ensure production (Cia and Salgado, 2005).
This study aimed to establish the damage functions for ramularia leaf spot on cotton plants and to characterize the damage to cultivars resistant and susceptible to ramularia.
The experiment was conducted in the city of Tangará da Serra, Mato Grosso State. The experimental area is located 320 m above sea level, at 14°37'10" S and 59°29'09" W. The soil of this area was classified as a dystrophic clayey red latosol (Embrapa, 1999).
The field sowing was performed on December 18, 2012, with a density of eight plants per meter. The fertilization was performed according to Souza and Lobato (2004), where 25 kg ha-1 of N, 100 kg ha-1 of P2O5 and 40 kg ha-1 of K2O were used at planting. The topdressing was applied 30 days after sowing with 50 kg ha-1 of N and 40 kg ha-1 of P2O5, and at 50 days with 50 kg ha-1 of N.
The inoculation of the plants was made at 45 days after plant emergence in the early reproductive stage (B1). The inoculum was obtained from the washing of cotton leaves with symptoms of Ramularia. The suspension was adjusted to a concentration of 4×10
5 conidia mL
-1 with a Neubauer chamber. The adhesive spreader Tween 20 (0.01%) was added to the final suspension, and inoculations were performed with a portable back sprayer until runoff.
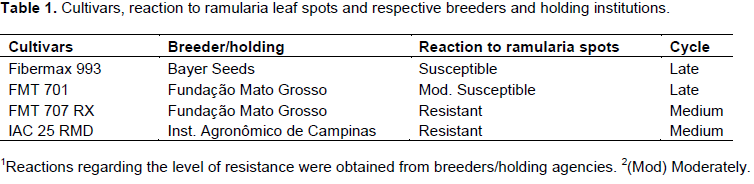
The experimental design was randomized blocks in a 4 × 4 factorial (four cultivars and four gradients of disease), with four replications, totaling 16 treatments. The cultivars FiberMax 993, FMT 701, FMT 707 and IAC 25 RMD were used, each one with differential reactions to ramularia leaf spot (Table 1). In Additional to that to obtain different levels of disease in each cultivar, sprayings were performed with the mixture of fungicides, trifloxystrobin (60 g.ha-1) + prothioconazole (70 g.ha-1) + mineral oil (500 mL.ha-1), at intervals between applications of 15 days for the first gradient, 30 days for the second gradient, 45 days for the thirty gradient and no application for gradient fourth.

The experimental plot consisted of eight lines of 5 m in length with a spacing of 0.9 m. Each plot was divided into two equal subplots (twin portions), that is, each division consisted of four rows, being the division I with the disease at different gradients and division II without the disease (or with minimal disease). To keep the division I without disease, applications of fungicide were performed at intervals of seven days. The useful area for evaluations was composed of two main lines in each division of the plot, in which severity and yield components evaluations were performed, and samples were collected for fiber technological analysis. On the border of each plot was sown an infector line with the susceptible cultivar FMT 701 to homogenize the inoculum pressure in the experiment. The control of insects-pests and weeds was performed when necessary by raising the level of damage.
At 20 days after inoculation, symptoms of ramularia leaf spots were identified in the experiment and the evaluations of disease severity began. The evaluations were performed at intervals of seven days until 152 days after planting (DAP). The disease severity was evaluated by percentage of diseased leaf area with the diagrammatic scale proposed by Aquino (2008) with nine severity levels: 0.05, 0.50, 1.0, 2.0, 4.0, 8.0, 16.0, 32.0 and 67.20%.
For the evaluation of the disease, six plants of the useful area of each division in each plot were previously marked. These plants were also used in determining the percentage of fiber, one hundred seed weight and analysis of fiber characteristics.
Severity data of all evaluations were used to calculate the area below the severity progress curve (ABSPC) according to Shaner and Finney (1977):
Where, n is the number of evaluations, x is the severity of the disease at time ti and (ti+1-ti) is the interval between two consecutive evaluations.
The real and potential productivity was obtained from the manual harvest of all plants in four central meters of the useful area of each division in each plot. The weighing was measured with a digital electronic scale with accuracy of 0.01 g, and data were converted to kilograms per hectare. The real productivity was estimated from the harvest and the weighing of divisions of the plots that were subjected to different disease gradients. The estimated productivity was obtained by harvest and weighing of the healthy divisions of the plots.
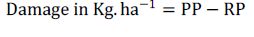
To obtain the loss in productivity in kilograms per hectare (kg ha-1) and in percentage, the following equations were used (James et al., 1968; Nkalubo et al., 2007):
and
where PP is potential productivity and RP is real productivity.
During harvesting, the total number of bolls of the six marked plants in each division was counted to obtain the average of bolls per plant. 20 bolls were sampled to obtain the percentage of fiber and the one hundred seed weight. In addition, analyses with a high volume instrument (HVI) device were performed to obtain fiber characteristics, length, uniformity index, resistance index, stretch, micronaire, yellowing degree, maturity, short fiber content and CSP reliability index.
The damage in these production components and fiber characteristics were obtained by subtracting the means of each component in the division under the effect of different disease gradients minus the means of the components obtained from the healthy division (Amorim and Bergamin Filho, 2011).
Weather temperature (°C) and relative humidity (%) data during the experiment were obtained from the National Institute of Meteorology (INMET) at the weather station installed in the city of Tangará da Serra, located approximately 100 m from the experiment site. With hourly temperature and relative humidity records, the number of optimal hours for germination of R. areola conidia per month was calculated. Temperatures between 25 and 30°C and a relative air humidity greater than or equal to 80% were considered as ideal climatic conditions (Rathaiah, 1977).
Analyses of variance were conducted and data were adjusted by the linear integral model Y = a+bx, where y is damage and x is ABSPC (Schneider et al., 1976). In all analyzes, the software Genes was used (Cruz, 2006).
The temperature was favorable for the germination of conidia and the development of R. areola throughout the experiment (Figure 1a). The number of favorable air humidity hours also occurred throughout the cycle, with peaks between 25 and 30, 49 and 55, 67 and 73, 91 and 97, and 151 and 153 days after planting (DAP), reducing after 154 DAP until the end of the cycle (Figure 1b).
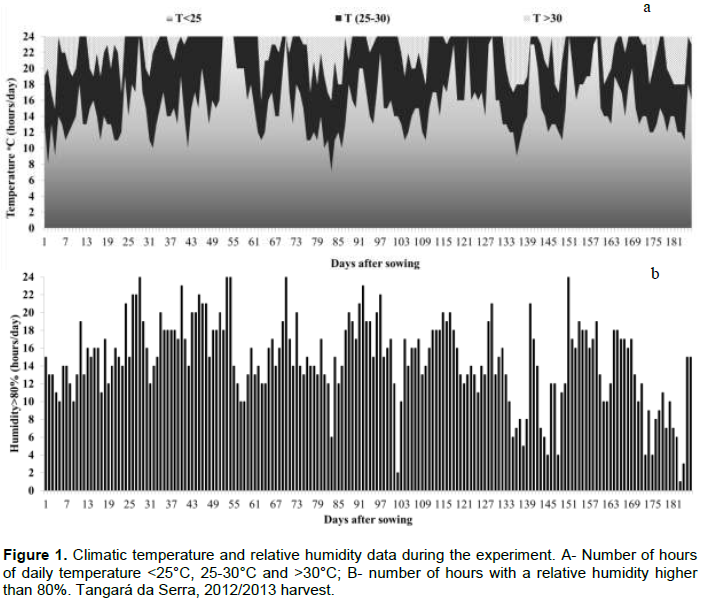
Ramularia spots, like most diseases, are influenced by climate, which is crucial to the pathogen development of this disease. Rathaiah (1977) and later Curvêlo et al. (2010), studying the penetration of R. areola, observed that the highest germination of conidia occurred in the temperature range of 25-30°C and an air humidity above 80%, and that the greater penetration of the fungus occurred in the nighttime wetting cycle and daytime drying cycle. The authors also found that in the process of germination and penetration, the germ tube of this fungus tolerates up to 16 h of drying (humidity above 20%) for a few cycles and then returns to the process of germination and penetration.
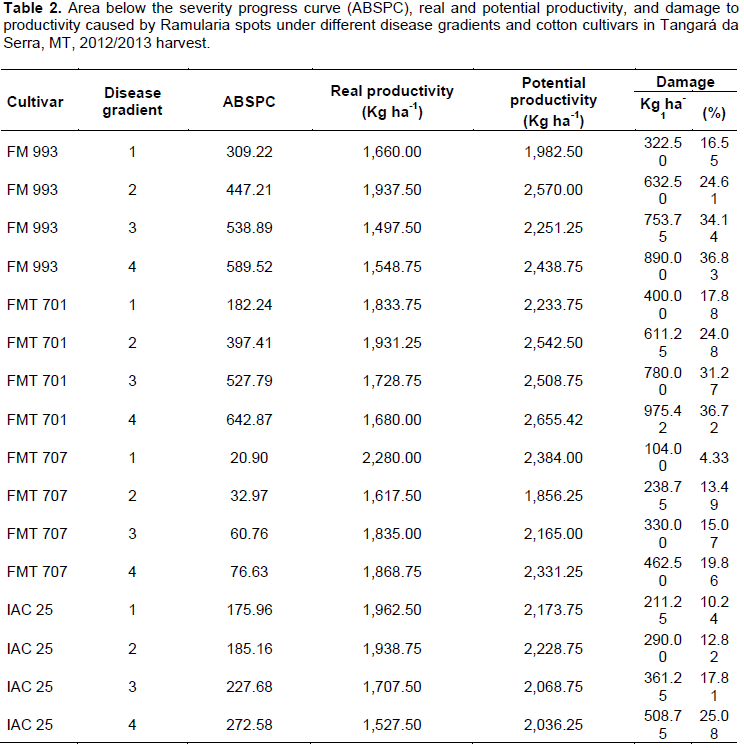
The analysis of variance was performed for all variables evaluated. However, there was a significant interaction (p ≤ 0.01) between cultivars and disease gradients only regarding the ABSPC of the disease, damage in kilograms per hectare and percentage of damage.
In cultivars under different ramularia spot gradients, damage to productivity ranged from 104.00 to 975.42 kg ha-1, equivalent to 4.33 and 36.72%, respectively (Table 2). The cultivars Fibermax 993 and FMT 701 had the highest percentages of damage, reaching 36.83 and 36.72%, the highest gradients of the disease, respectively. The cultivar FMT 707 had the lowest damage percentages, varying between 4.33 and 19.86% among disease gradients, followed by IAC 25, wherein damage percentages ranged from 10.24 to 25.08% (Table 2). Ascari et al. (2016) has observed yield demages of 30.82% comparing control and uncontrol plots in first sowing.
Cultivars had different ABSPC indexes and percentages of damage to productivity. The graphical representation of the linear equation of damage in function of ABSPC shows a significant increase of the damage with the increase in ABSPC, wherein for each ABSPC unit, there was an increase of 0.0375% in damage to productivity, with a coefficient of determination of 96.89% (Figure 2a). Brito et al. (2007), studying the effect of cercosporiosis on commercial corn hybrids, also found a linear increase in damage to productivity due to the increase of the ABSPC index.
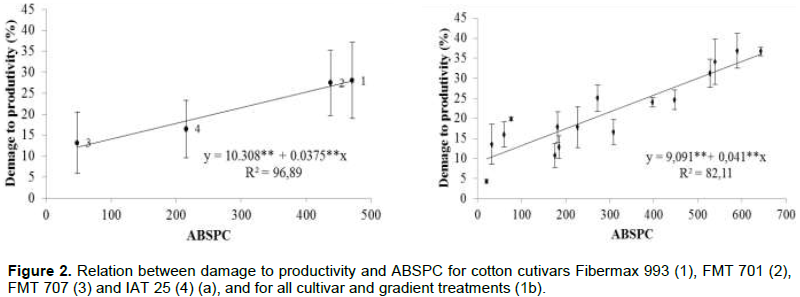
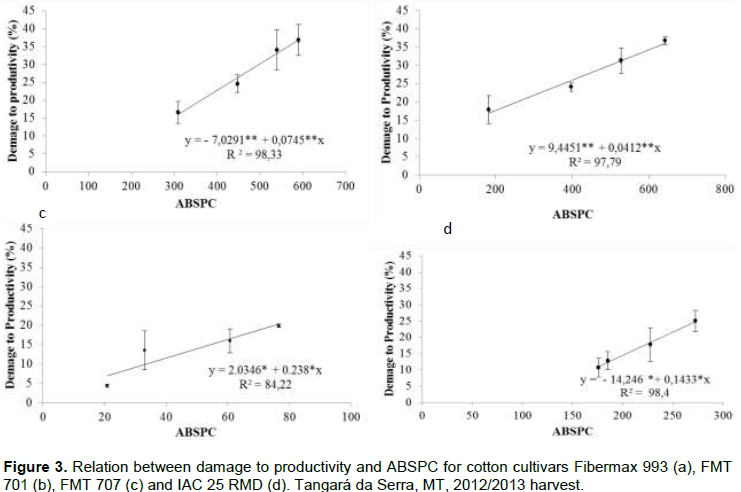
When cultivars and their gradients were considered in a same Equation (Figure 2b), the equation components were similar to those obtained by the cultivars: for each ABSPC unit, there was an increase of 0.041% in damage to productivity, but the coefficient of determination was 82.11%. Even so, it can be considered as a high relation of ABSPC with productivity, given the fact that coefficients above 80% are considered acceptable.Comparing damage percentage equations in function of ABSPC, the relations were significant for both susceptible cultivars (p≤0.01) and resistant cultivars (p≤0.05). For the cultivars Fibermax 993 and FMT 701 (Figure 3a and b), the damage function equation showed that for each ABSPC unit, there was a 0.0745 and 0.0412% damage to productivity, respectively, with coefficients of determination of 98.33 and 97.70%. However, considering the cultivars, FMT 707 and IAC 25 RMD (Figure 3c and d), one ABSPC unit increased damage to productivity by 0.238 and 0.143%, respectively. The coefficients of determination ranged from 98.4 to 97.79%, with the exception of the cultivar IAC 25, with a coefficient of determination of 84.22%, thus demonstrating a high relation between damage to productivity and ABSPC (Figure 3).

For several other pathosystems, relations were found between ABSPC and damage to productivity by the integral linear model, as reported by Hartman et al. (1991) for Asian soybean rust, Godoy and Canteri (2004) for mildew and Cercospora in soybeans, Brito et al. (2007) for corn Cercospora, Leite et al. (2006) for sunflower Alternaria, Hikishima et al. (2010) for Asian soybean rust, and Fiallos (2011) for common bean blight. ABSPC is a variable recommended by some authors because it represents the epidemic of the disease as a whole in all plant cycles (Bergamin Filho and Amorim, 1996).
In plants with an indefinite cycle, it is common to find a relation between disease and production because leaves are not fixed (Amorim and Bergamin Filho, 2011). However, the high relation in the pathosystem under study may be because the use of regulators ultimately determines the cotton cycle.
Although, the total damage is greater in susceptible cultivars, damages by ABSPC units were higher in resistant cultivars (Figure 3c and d), exceeded by up to six times the susceptible cultivars (Figure 3a and d). This may be related to a greater tolerance by susceptible cultivars used herein considering the severity of the disease.
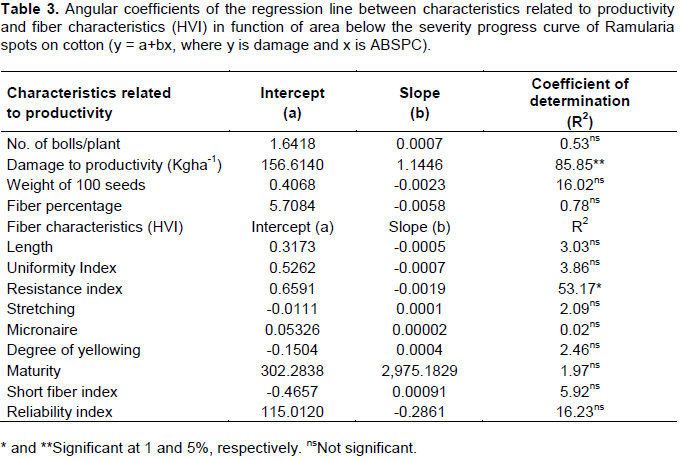
The relationship between ABSPC and some productivity components, estimated by the same linear equation, are shown in Table 3. There was no significant relation of ABSPC on production components: number of bolls per plant, weight of one hundred seeds and percentage of fiber.
The production component damage to productivity (kg ha-1) suffered a significant interference of ABSPC, with a coefficient of determination of 85.85%. There was damage of 1 kgha-1 by ABSPC unit of the ramularia spot (Table 3). Polizel et al. (2008), evaluating 16 cotton genotypes in Uberlândia, MG, in experimental field conditions, found no significant correlation between severity of ramularia spots and production.
As for fiber technological properties, there was a significant relation only for fiber resistance, in which for each ABSPC unit, there was a reduction of 0.0019 gf tex-1. However, the coefficient of determination was 53.17%, which little explains what occurred (Table 3). Cia et al. (2008), studying 16 cotton genotypes in various regions of Brazil regarding resistance to multiple diseases, including ramularia spots, did not identify a relation between disease and quality of fiber.
The relation between ABSPC, damage in kilograms per hectare and damage percentage was significant, and the model y = a+bx may be used to estimate the damage to these components in function of ABSPC. As for fiber characteristics, the ABSPC of ramularia spots negatively influenced only the resistance index.Percentages of damage to productivity caused by ramularia spots reached levels of up to 36.83% in susceptible cultivars. Even in the cultivar with the highest resistance to damage to productivity, percentages reached levels up to 19.86%.
The authors have not declared any conflict of interests.
REFERENCES
|
Andrade Junior ER, Galbieri R (2014). Eficiência de fungicidas no controle de mancha de ramulária em algodoeiro, na safra 2013/14 no Mato Grosso. Circular técnica n°12/IMA, Cuiabá 8 p.
|
|
|
|
Amorim L, Bergamim Filho A (2011). Fenologia, patometria e quantificação de danos. In: Amorim L, Rezende JAM, Bergamim Filho A. (Edt.). Manual de Fitopatologia. Princípios e Conceitos. São Paulo. Agron. Ceres 1:517-540.
|
|
|
|
|
Aquino LA, Berger PG, Rodrigues FÁ, Zambolim L, Hernandez FR, Miranda LM (2008). Elaboration and validation of a diagrammatic scale to quantify areolate mildew on cotton. Summa Phytopathol. 34(4):361-363.
Crossref
|
|
|
|
|
Ascari JP, de Araújo DV, Dias LDE, Bagatini GJ, Mendes IRN (2016). Severity of ramularia leaf spot and seed cotton yield in different sowing times. Rev. Caatin. 29(3):603-610,
Crossref
|
|
|
|
|
Atkinson GF (1890). A new Ramularia on cotton. Bot. Gaz. 15:166-168.
Crossref
|
|
|
|
|
Bell AA (1981). Areolate mildew. In: Watkins GM. (ed.). Compendium of Cotton Diseases. APS Symp. Ser., St. Paul, Minnesota, United states 87 p.
|
|
|
|
|
Bergamin Filho A, Amorim L (1996). Doenças de plantas tropicais: epidemiologia e controle econômico. São Paulo SP. Editora Ceres
|
|
|
|
|
Brito AH, Von Pinho RG, Pozza EA, Pereira JLAR and Faria Filho EM (2007). Efeito da cercosporiose no rendimento de híbridos comerciais de milho. Fitopat. Bras. 32:472-479.
Crossref
|
|
|
|
|
Cia E, Salgado CL (2005). Doenças do algodoeiro (Gossypium spp.). In: Kimati, H. et al. (Eds.). Manual de fitopatologia: doenças das
|
|
|
|
|
Cia E, Fuzatto MG, Kondo JI, Luders RR, Galbieri R, Carvalho LH, Ito MF, Ruano O, de Almeida WP, Adriano Borges De Oliveira3, da Cunha HF, Chiavegato EJ, Aguiar PH, Rossetto R, Martins ALM, Pettinelli Júnior A, t Bolonhezi D, Foltran DE, Kasai FS, Bortoletto N (2008). Reação de cultivares e linhagens de algodoeiro às principais doenças que ocorrem em regiões produtoras do Brasil. Rev. Ceres 55(8):518:524.
|
|
|
|
|
CONAB – Companhia Nacional de Abastecimento (2016). Acompanhamento de safra brasileira: grãos, décimo levantamento, julho 2016. Disponível em: <http://www.conab.gov.br> Acesso em: 29 de agosto de 2016.
|
|
|
|
|
Cruz CD (2006). Programa Genes: Biometria. Editora UFV. Viçosa (MG) 382p.
|
|
|
|
|
Curvêlo CRS, Rodrigues PGB, Rezende DC (2010). Microscopia eletrônica de varredura do processo infeccioso de Ramularia areola em folhas de algodoeiro. Trop. Plant Pathol. 35(2):108-113.
Crossref
|
|
|
|
|
Embrapa (1999). Centro Nacional de Pesquisa de Solos. Sistema brasileiro de classificação de solos. Brasília, DF: Embrapa Produção da Informação; Rio de Janeiro: Embrapa Solos 412 p.
|
|
|
|
|
FAO - Food and Agriculture Organization (2016). Disponível em: <http://www.fao.org>. Acesso em: 29 de agosto de 2016.
|
|
|
|
|
Fiallos FRG (2011). Modelo de ponto crítico para estimar danos causados pela mela na cultura do feijoeiro. Cienc. Tecnol. 4(1):1-4.
|
|
|
|
|
Girotto L, Marangoni MS, Matos JN, Galbieri R, Almeida WP, Mehta YR (2013). Identification of phenotypic and genotypic variability among the isolates of Ramularia areola of Brazilian Cotton. Am. J. Plant Sci. Temuco 4(9):1893-1898.
Crossref
|
|
|
|
|
Godoy CV, Canteri MG (2004). Efeito da severidade de oídio e crestamento foliar de cercospora na produtividade da cultura da soja. Fitopatol. Bras. 29:526-531.
Crossref
|
|
|
|
|
Hartman GL, Wang TC, Tschanz AT (1991). Soybean rust development and quantitative relationship between rust severity and soybean yield. Plant Dis. 75:596-600.
Crossref
|
|
|
|
|
Hikishima M, Canteri MG, Godoy CV, Koga LJ, Silva AJ (2010). Quantificação de danos e relações entre severidade, medidas de refletância e produtividade no patossistema ferrugem asiática da soja. Trop. Plant Pathol. 35:96-103.
Crossref
|
|
|
|
|
James WC, Jenkins JEE, Jemmentt JL (1968). The relationship between leaf blotch caused by Rhynchosporium secalis and losses in grain yield of spring barley. Ann. Appl. Biol. 62:273-288.
Crossref
|
|
|
|
|
Leite RMVBC, Amorim L, Bergamin Filho A (2006). Relationships of disease and leaf area variables with yield in the Alternaria helianthi–sunflower pathosystem. Plant Pathol. 55:73-81.
Crossref
|
|
|
|
|
Mohan P, Mukewar PM, Singh VV, Singh P, Khadi BM, Amudha J, Deshpande VG (2006). Identification of sources of Resistance to grey mildew disease (Ramularia areola) in diploid Cotton (Gossypium arboreum). Technical Bulletin 34, CICR. Disponível em: http://www.cicr.org.in/. Acesso em: 29, agosto, 2016.
|
|
|
|
|
Nkalubo S, Melis R, Ópio F (2007). Yield loss associated with anthracnose disease on Ugandan market-class dry bean cultivars. Afr. Crop Sci. Conf. Proc. 8:869-874.
|
|
|
|
|
Polizel AC, Juliatti FC, Penna JCV, Hamawaki OT (2008). Reação de genótipos de algodoeiro quanto à severidade de manchas foliares. Biosci. J. 24(3):8-12.
|
|
|
|
|
Rathaiah Y (1977). Spore germination and mode of cotton infection by Ramularia areola. Phytopathology 67:351-357.
Crossref
|
|
|
|
|
Schneider RW, Willians RJ, Sinclair JB (1976). Cercospora leaf spot of cowpea: models for estimating yield loss. Phytopathology 66:384-388.
Crossref
|
|
|
|
|
Souza DMG, Lobato E (2004). Adubação com nitrogênio. In: Sousa DMG, Lobato E, eds. Cerrado: correção do solo e adubação. 2.ed. Planaltina, Embrapa Cerrados pp. 129-144.
|
|
|
|
|
Shaner G, Finney RE (1977). The effect of nitrogen fertilization on the expression of slow mildewing resistance in Knox wheat. Phytopathol. 67:1051-1056.
Crossref
|
|
|
|
|
Shivankar SK, Wangikar PD (1992). Estimation of crop losses due to grey mildew disease of cotton caused by Ramularia areola. Indian Phytopathol. 45(1):74-76.
|
|
|
|
|
Suassuna ND, Coutinho WM (2007). Manejo das Principais Doenças do Algodoeiro no Cerrado Brasileiro. In: Freire, E. C. Algodão - No Cerrado do Brasil. Brasília: Associação Brasileira dos Produtores de Algodão 918 p.
|
|
|
|
|
Utiamada CM, Lopes JC, Sato LN, Roim LFB, Kajihara L, Occhiena EM (2003). Controle químico da ramulária (Ramularia areola) e ferrugem (Phakospora gossypii) na cultura do algodoeiro In: IV Congresso Brasileiro do Algodão, Goiânia GO.
|
|
|
|
|
Zadoks JC (1985). On the conceptual basis of crop loss assessment: the threshold theory. Ann. Rev. Phytopathol. 23:455-473.
Crossref
|
|