ABSTRACT
The objective of this study was to test the utility of a spatial explicit water balance technique in assessing the rainwater harvesting potential for crop production to design food security strategies in the Bugesera District. The district was delineated into 19 catchments through the hydroprocessing algorithm in ILWIS using the SRTM 90 m DEM, and runoff, a proxy of the potential rainwater harvest, was computed using the Natural Resources Conservation Service Curve Number method. Results from the analyses indicate that based on the average antecedent moisture condition, the average daily runoff that can be collected out of Bugesera district is approximately 1,320 x 106 m3/day. Allowing a third of this runoff for environmental requirements and evaporation losses, the amount of rainwater that could be used for crop production has been estimated to be 880 x 106 m3 per day. By using the CSIRO’s precision weighing systems to measure water use by various crops and yield from the crops, the amount of harvested rainwater has the potential of producing between 398 x 103 to 531 x 103 tones of paddy rice and 1,390 x 103 to 1,620 x 103 tones of maize. This potential crop yield can significantly improve food security in the Bugesera district. It was therefore concluded that rainwater harvesting for crop production is a viable option in Bugesera district and further implantation modalities should be explored.
Key words: Rainwater harvesting, natural resources conservation service (NRCS) curve number, crop production, digital elevation model (DEM), catchment delineation, Bugesera District.
Many parts of Africa rely on rain-fed agriculture, often subjecting these areas to frequent food insecurity. Rain-fed agriculture is practiced on approximately 95% of sub-Saharan Africa’s agricultural land (Ching et al., 2011; Rockström et al., 2002). Agriculture accounts for 35% of the continent’s Gros Domestic Product (GDP), 40% of its export, 70% of its employment, and more than 70% of the population depend for their livelihoods on agriculture and agri-business (Ngigi, 2003; Kijne, 2000). Unfortunately there has been a marked increase in rainfall variability as well as decrease in rainfall (mean annual rainfall) that makes rain-fed agriculture risky (Barron and Stacey, 2008). This has resulted in low yields being obtained from rain-fed agriculture in sub-Saharan Africa ranging around 1 t/ha of grain crops such as maize and rice (Rockström, 2001; Senay and Verdin, 2004). According to the World Food Programme (WFP) (2006), recent assessments suggest that the low productivity in rainfed agricultural land is more due to poor water management than to low physical potential. Rwanda is a Sub-Saharan African country which there is no exception to the problem of water management in the region. However, the consequences are more severe in drier parts of the country. Bugesera District, in the Eastern Province of Rwanda, is among the regions that receive little amounts of rainfall; an average of 400 to 600 mm/annum and rarely exceeds a maximum of 800 mm/annum. This District has been facing prolonged periods of drought since year 1998 which resulted in food insecurity and massive population migration to other regions of the country (ICT-Environment Linkage, 2007). Agriculture is the backbone of the economy of the District of Bugesera with more than 90% of the population engaged in agricultural activities, of which 97 % is rain-fed (WFP, 2006).
More irrigation projects are required to raise agricultural production in the Bugesera district. Studies in similar arid and semi-arid regions have shown that 1 to 3 applications of supplementary irrigation at critical stages of crop growth could make a difference between 1 ton/ha (rain-fed) and 4 tons/ha (with supplementary irrigation) for a wheat crop in North Africa and West Asia (Oweis and Hachum, 2006; Senay and Verdin, 2004). As rainfall in the Bugesera District is principally lost through runoff, infiltration and evaporation, there is an urgent need to profitably utilize that portion of rainfall that is lost in the catchments for agricultural purposes; a process known as rainwater harvesting (RWH). This is a method of collecting surface runoff from a catchment area and storing it in surface reservoirs, or in the root zone of a defined area (Tripathi et al., 2005; Munyao, 2010). It can be a source of water for a variety of purposes in arid and semi arid regions when common sources such as streams, springs, or wells fail (Fraiser, 1980). Tripathi et al. (2005) noted that the first step in developing and implementing water resource management through rainwater harvesting is the evaluation of the region’s rainwater harvesting potential.
It is useful to make use of rainwater harvesting techniques through models that incorporates different hydrological components such as interception, infiltration and evaporation as these influence soil moisture content and runoff generation (both process and volume) in an area (ICRAF, 2005; Mwenge et al., 2008). Such methods require several inputs such as rainfall, landcover, soils and topographic derivatives and have been found to meet the water requirements of transplanted crops such as rice (Srivastava et al., 2004). The Natural Resources Conservation Service Curve Number (NRCS CN) method is one of the rainfall runoff models that have been widely adopted for rainwater harvesting assessment (Senay and Verdin, 2004; de Winnaar et al., 2007). This method integrates the various remote sensing (RS) quantification methods with the spatial data handling capabilities of Geographic Information Systems (GIS) to simulate runoff for rainwater harvesting (Senay and Verdin, 2004). Remote sensing is very useful in that it allows for the spatial and temporal quantification of major environmental variables such as topography (Lane et al., 2004), landcover and landuse (Chrysoulakis et al., 2004) that are key inputs into the NRCS CN model. This also could further help to meet the challenges of managing water-related problems, food insecurity and sustainable development of the Bugesera District.
The curve number method was developed by the United States Department of Agriculture (USDA) NRCS from an empirical analysis of runoff from small catchments and hillslope plots monitored by the USDA (USDA-NRCS, 1972). It is widely used and is an efficient method for determining the approximate amount of direct runoff from a rainfall event in a particular area (Rao et al., 1996; Sharma et al., 2001; Senay and Verdin, 2004; USDA, 2004). It estimates excess precipitation as a function of cumulative precipitation, soil cover, land use, and antecedent moisture levels. The hydroprocessing algorithm in the Integrated Land and Water Information Systems (ILWIS) Open Software (Version 3.6) allows for the delineation of sub-catchments. Runoff representing the amount of rainwater that could be harvested can be easily computed from daily rainfall records using the NRCS curve number method with soil groups and land use/cover as input layers into this model. This method is based on repeated measurements of the water available for runoff after different rainfall intensities on different land cover/landuses. In summary the method is an integration of the interception, evaporation and storage of precipitation on surfaces with specific land cover/use and soil characteristics.
By determining the water available for runoff and its flow through the Bugesera watersheds, the main objective of this study was to assess the rainwater harvesting potential in the district for improving agricultural production. The effectiveness of integrating RS and GIS (data preparation and model parameterization) with hydrological modelling (NRCS curve number) to identify potential rainwater harvesting sites (rainwater catchments) in the district was explored.
STUDY AREA
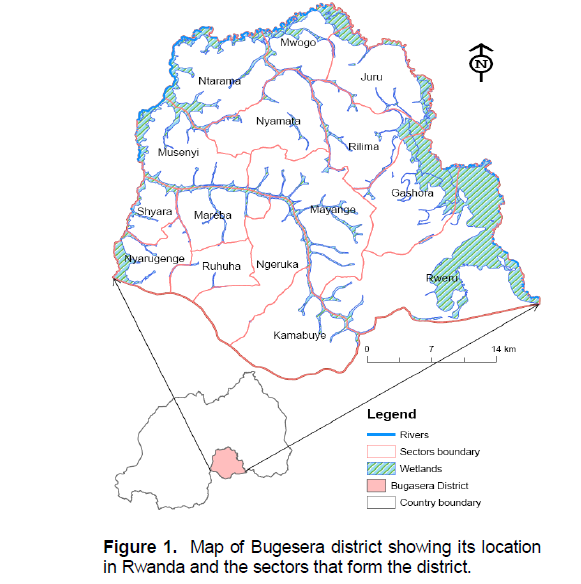
This study was conducted in the Bugesera district which is located in the Eastern Province, southeast of Kigali, the capital city of Rwanda. The population of the district was about 300,000 people and its surface area is 1,334 km2. Figure 1 shows the location of Bugesera district in Rwanda and its constituent sectors. The relief of the district is a succession of trays in the heights subsided and whose altitude varies between 1300 and 1667 m (Figure 1).
In comparison to other regions of Rwanda, the Bugesera district is regarded as one of the drought-prone regions, experiencing frequent rainfall deficit and a significant number of dry spells (MINITERE/CERECE, 2003). The maximum temperatures range between 26 and 29°C, and minimum temperatures range between 13 and 15°C (ICT-Environment Linkage, 2007). The area is recognized as the hottest and driest in the country.
Agriculture is the backbone of the economy of the Bugesera district with more than 90% of the population engaged in agricultural activities, of which 97% is rain-fed (WFP, 2006). Crop production in Bugesera is negatively affected by climatic risks, in particular the dryness on the hills and the floods in marshes. Moisture tolerant crops such as sorghum, cassava and sweet potatoes are generally cultivated on the hillsides, while crops sensitive to moisture stress such as banana and vegetables are grown on hill bottoms where soil moisture is higher compared to the hillsides (Tabor, 1995). In 2006, an estimated 53,000 people out of about 297,000 in the district were severely food insecure and required urgent humanitarian assistance (WFP, 2006). This was exacerbated by high population densities, and poor soil fertility. Rainwater harvesting could increase water availability for all Bugesera district sectors. Such an initiative would also encourage farmers to invest in the land for improved productivity.
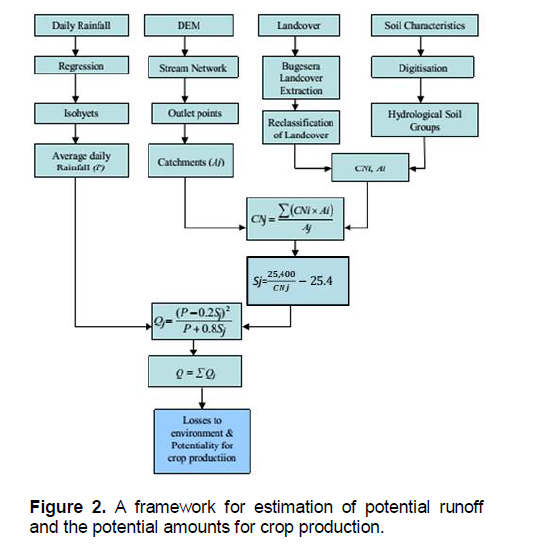
Figure 2 summarizes the major steps followed in the estimation of potential runoff and the probable irrigable area for crop production. These steps are described in detail in the next paragraphs. The field study and data collection was conducted from July 2007 to January 2008.
Primary datasets
Readily available land cover data for the study area from the FAO Africa Cover website (
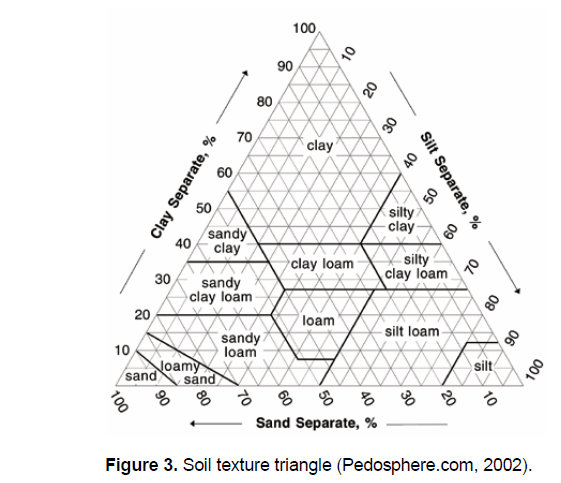
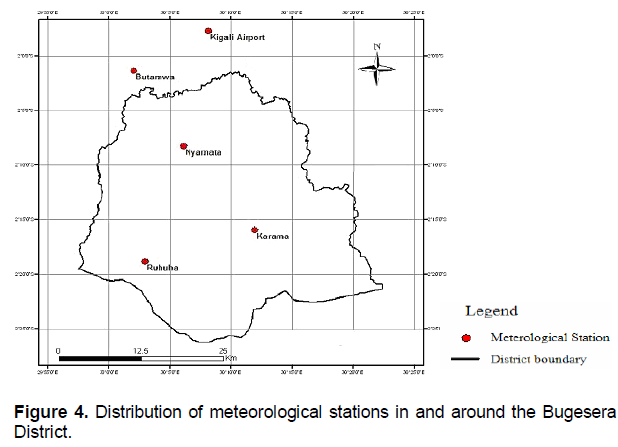
http://www.africover.org) was used (FAO, 2003). This land cover map was derived from visual interpretation of digitally enhanced LANDSAT TM images of 2004. The pedological map of Rwanda (Carte pédologique du Rwanda) made under the supervision of the University of Gand (Belgium), Department of Geology and Pedology from 1981 to 2000 was also used. It classifies the soil texture of the country based on the United States Department of Agriculture (USDA) triangle of soil textures. The meteorological data include rainfall time series from 1975 to 2005 from 6 stations in and around Bugesera District as provided by the Rwandan Meteorological Services. These stations are Karama, Nyamata and Ruhuha inside the District and Masaka, Butamwa and the Kigali International Airport Station in the north of Bugesera. The country’s 90 m Shuttle Radar Topographic Mission (SRTM) Digital Elevation Model (DEM) used for catchment delineation was obtained from the Centre for Geographic Information System at the National University of Rwanda.
Evaluation of the rainfall distribution using GIS
The average daily rainfall at each station was obtained and GIS was used to map the spatial locations of these stations. The average daily rainfall for the whole district was computed using isohyets generated from GIS interpolation techniques.
Landcover analyses
The Medium Resolution Imaging Spectroradiometer (MERIS) derived landcover (Bontemps et al., 2011) was reclassified to conform to the NRCS TR-55 tables runoff Curve Number values (USDA-NRCS, 1964, 1972). All cropped lands were classified as agricultural land, forest plantations were classified as forest land, natural lakes as water bodies, and permanently flooded land and post flooding croplands were classified as wetland. Open shrubs and sparse trees were classified as rangeland, while urban land was retained as urban to yield six classes. An assumption is that impervious areas are directly connected to the drainage system, impervious areas have a CN of 98, and pervious areas are considered equivalent to open space in good hydrologic condition was made (USDA-NRCS, 1964). The landcover map was then overlayed with the boundary of Bugesera district.
Soil classification
To classify the different soil types into hydrologic soil groups, the pedological map of Rwanda [Carte pédologique du Rwanda] was digitised and visually interpreted. The soil texture of the country was classified into four main classes based on the USDA triangle of soils textures (Figure 3). The soil types in Bugesera District were classified into the Hydrologic Soil Groups (Group A-D) of the NRCS CN method (Perdue Research Foundation, 2004) using Table 1 as the look up reference table. The soil groups are as follows:
Group A: sand, loamy sand and sandy loam types of soils.
Group B: silt, silt loam and loam soils.
Group C: sandy clay loam soils.
Group D: clay loam, silty clay loam, sandy clay, silty clay and clay soils.
DEM hydroprocessing for catchment delineation
The delineation of catchments in Bugesera District was done using an automated approach in Integrated Land and Water Information System (ILWIS) (Maathuis et al., 2006). Using this algorithm, pre-processing of the DEM was performed to fill sinks for removal of local depressions, determination of flow direction and flow accumulation and to derive the stream network (Garbrecht and Martz.,1997). Catchment extraction was based on the derived drainage network and the flow direction map and a minimum drainage length of 2,000 m. A total of 19 outlet points were defined and the same number of catchments (19) were delineated and extracted.
Derivation of CN map and runoff simulation
The NRCS method computes direct runoff in a catchment through an empirical equation that requires the rainfall and a catchment coefficient as inputs. The catchment coefficient, curve number (CN) represents the runoff potential of the land cover-soil complex (Equation 1)
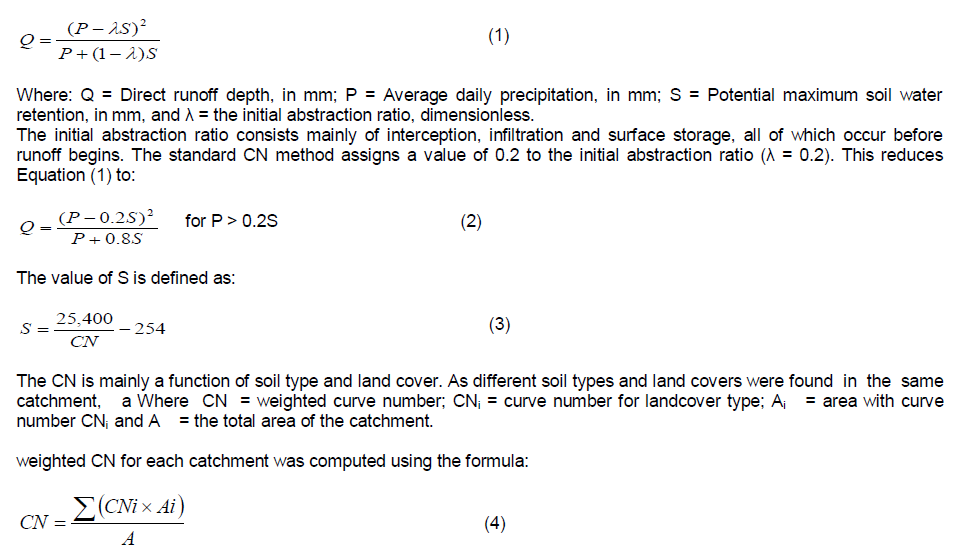
Using the NRCS TR-55 look up tables (USDA-NRCS, 1964, 1972), curve numbers were selected by picking the Hydrologic Soil Group (HSG), antecedent Moisture Condition (AMC) and landcover within the Bugesera. The curve numbers were also linked to the District’s antecedent moisture conditions (dry, average and wet ) which is an index of basin wetness (Silveira et al., 2000). The AMC I, AMC II and AMC III represent respectively conditions of the soil in the District. From the weighted Curve Number, the potential maximum soil water retention (S) and the average daily precipitation (P), the runoff is estimated for each sub-catchment in the study area by using Equation (1). Daily total runoff for the whole district was obtained by simple summation of the daily totals from each sub-catchment.
Harvesting water for agricultural purposes
Not all runoff can or should be harvested for agricultural uses; about a third of it is generally required to sustain the environment (UNEP, 2006). It was therefore allowed a third of this runoff for environmental and evaporation requirements in order to compute the amount of rainwater that could be used for crop and the equivalent in tonnes of paddy rice production. Commonwealth Scientific and Industrial Research Organisation’s (CSIRO) precision weighing systems were used to measure water use by various crops, and yield from the crops (
http://rivermurray.com/html/about_the_murray/water_use.html). The CSIRO studies used precision weighing systems to measure water use by various crops, and yield from the crops as follows:
(i) To produce 1 kg of maize, it takes 540 to 630 L of water
(ii) For 1 kg of paddy rice, 1,650 to 2,200 L of water
Rainfall interpolation
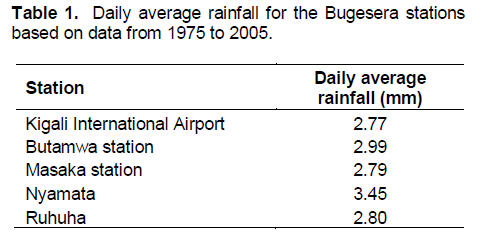
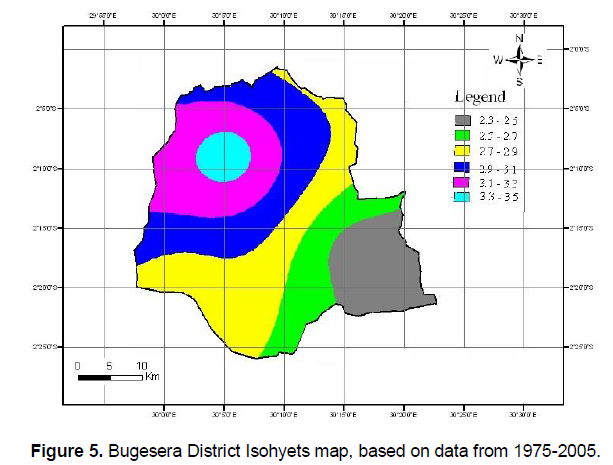
Table 1 shows the daily average rainfall for the 5 stations in and around Bugesera District. Figure 4 shows the spatial distribution of meteorological stations in and around Bugesera District. Only Kigali station had adequate records and therefore was used to generate daily rainfall for the other stations using linear regression of monthly total rainfall. The coefficient of correlation (R2) obtained while generating missing data varied from 0.81 to 0.89, indicating an acceptable level of correlation. Daily rainfall records for 30 years (1975 to 2005) for each station were obtained for use in the NRCS CN method. Butamwa station had the highest average daily rainfall of 2.99 mm and Kigali International Airport had 2.77 mm. Figure 5 shows the isohyets map interpolated from the average daily rainfall at each station. The 6 classes in the generated isohyets map range from a minimum of 2.3 mm to a maximum of 3.5 mm. The average daily rainfall for the Bugesera District computed from the isohyets was found to be 2.87 mm.
Landcover analyses and soil classification
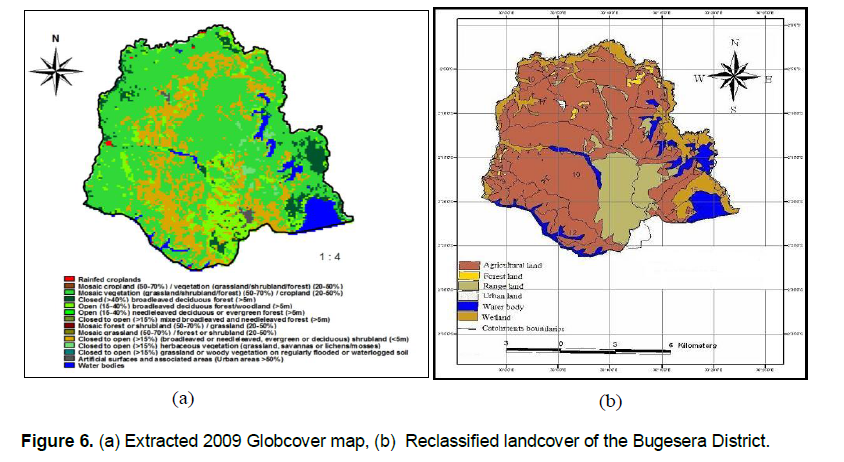
Figure 6a shows the extracted 2009 Globcover map of the Bugesera District and Figure 6b shows the reclassified landcover map to conform to the NRCS Curve Number values (USDA-NRCS, 1964). The dominant landcover was found to be agricultural land followed by rangeland. The forests are concentrated to the northern and eastern part of the District whilst the water bodies are concentrated in patches in southern and eastern part of the District.
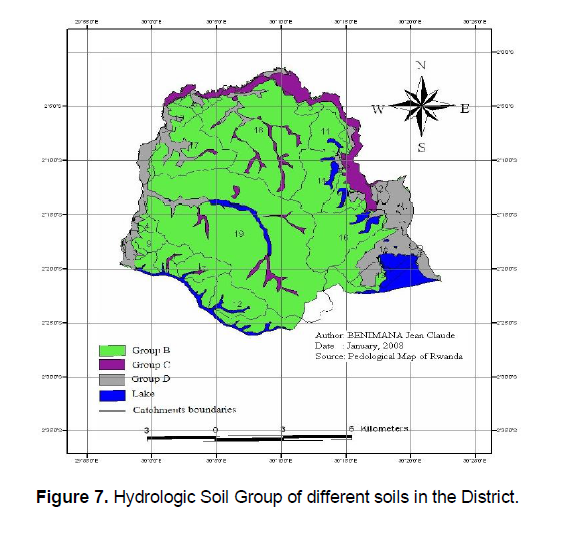
Figure 7 shows the 3 soil groups plus lake area that resulted in the selection of curve numbers (CN) based on the USDA triangle of soils textures. A greater percentage of the district is covered by Soil Group B. Group C is only in the Northerly strip while Group D consists of east and west strips.
DEM hydroprocessing results
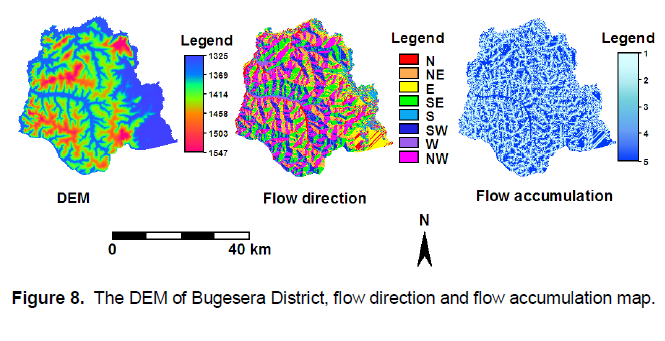
The delineation of catchments resulted in the filled DEM, flow direction and flow accumulation maps as shown in Figure 8. The elevation ranges from a minimum of 1,300 m on the eastern side of the district to a maximum of 1,500 m above mean sea level. Most streams flow in the SE and NW direction in the Bugesera District.
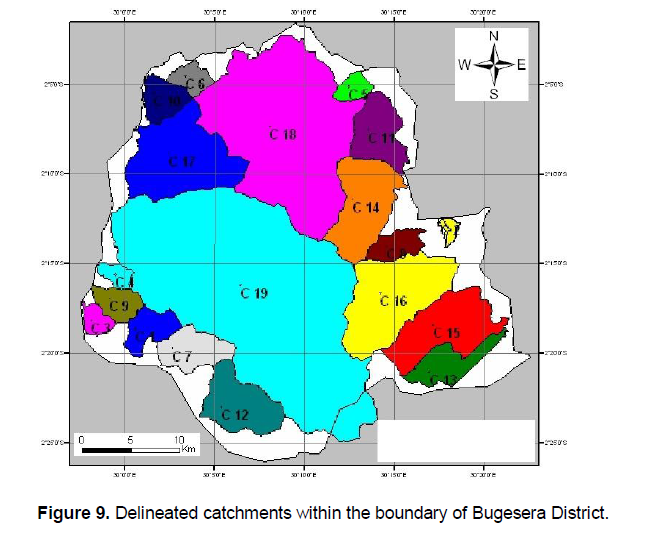
The polygons in Figure 9 present the extracted catchments within the boundary of the Bugesera District. All the catchments were found to be located within the boundary of the Bugesera District except the catchment C19 which extends some part beyond the District’s boundary.
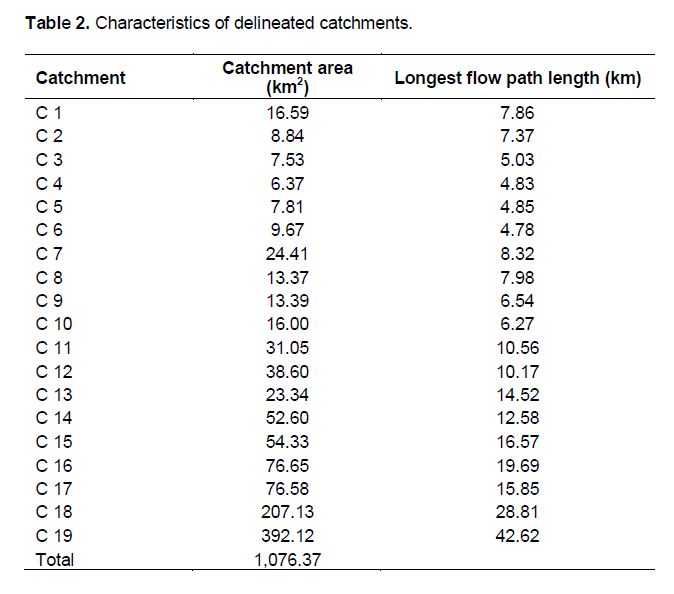
The occupied surface areas and the longest flow path length within each catchment are presented in Table 2. The catchment with the largest catchment surface area is C19 (392 km2) and with the smallest surface catchment area is C4 (6 km2). Catchment C19 has the longest flow path length (43 km) and C6 the shortest flow path (5 km). This already has an implication on the potential amount of runoff generated by each subcatchment. Runoff generation is also a function of catchment area.
Runoff estimation through the NRCS curve number method
Table 3 shows the soil cover complex, occupied surfaces area (Ai), corresponding curve number (CNi), direct runoff (Q, mm) and the computed runoff volume (Q, *106 m3) for each subcatchment. Assuming average antecedent moisture condition AMC II (Artan et al., 2001), the average daily rainfall that flows out of Bugesera District was equal to 1.320 x 10⁹ m3. The CN value generated using the curve number for landcover type; Ai-area with curve number CNi and A: the total area of the catchment in the Bugesera District gives an impression of the area that can generate more runoff in the study area. High CN values indicate areas that have the lowest infiltration and more runoff is expected from these areas since the initial abstraction and storage area would be minimal.
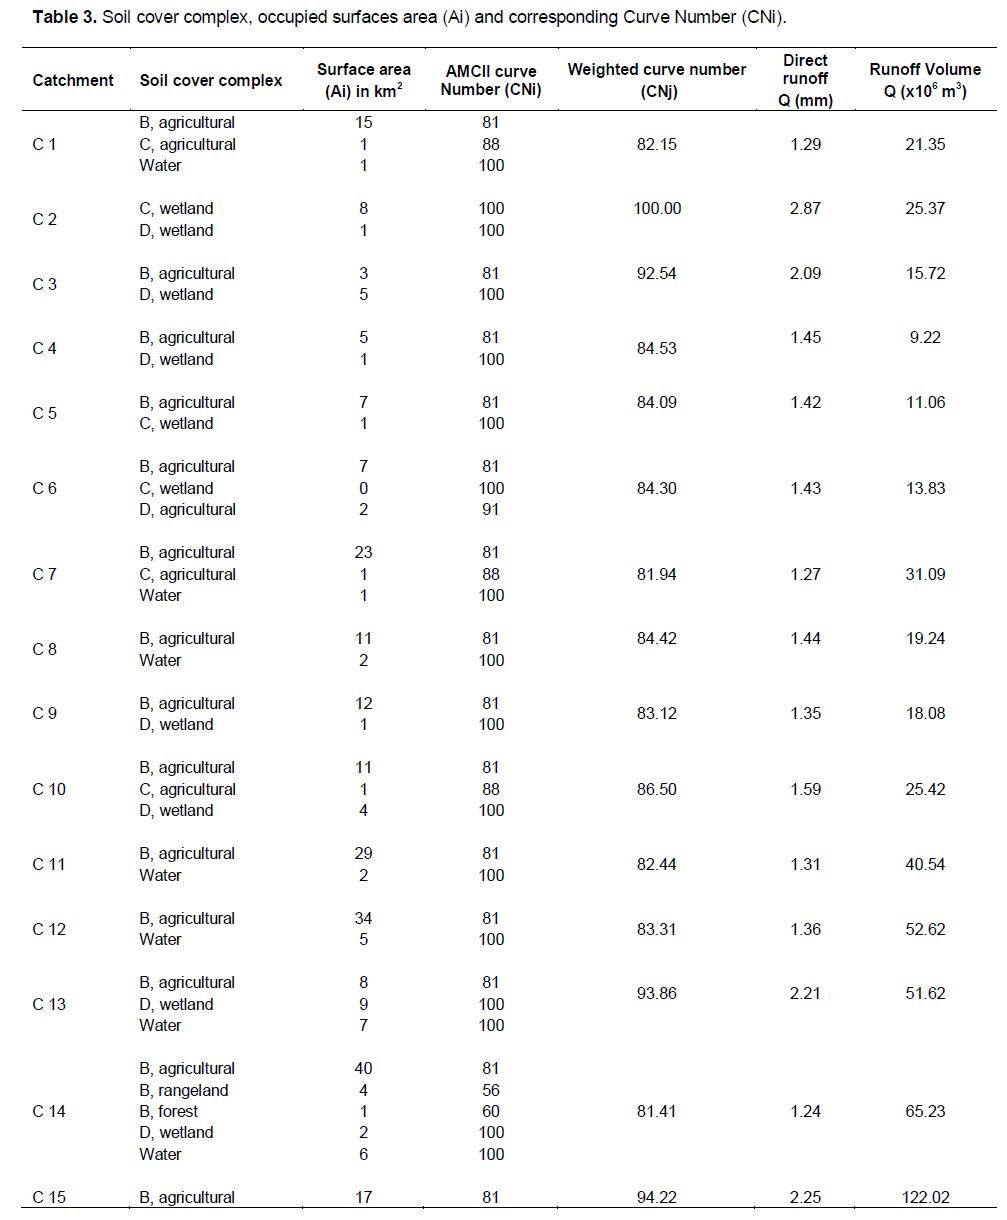
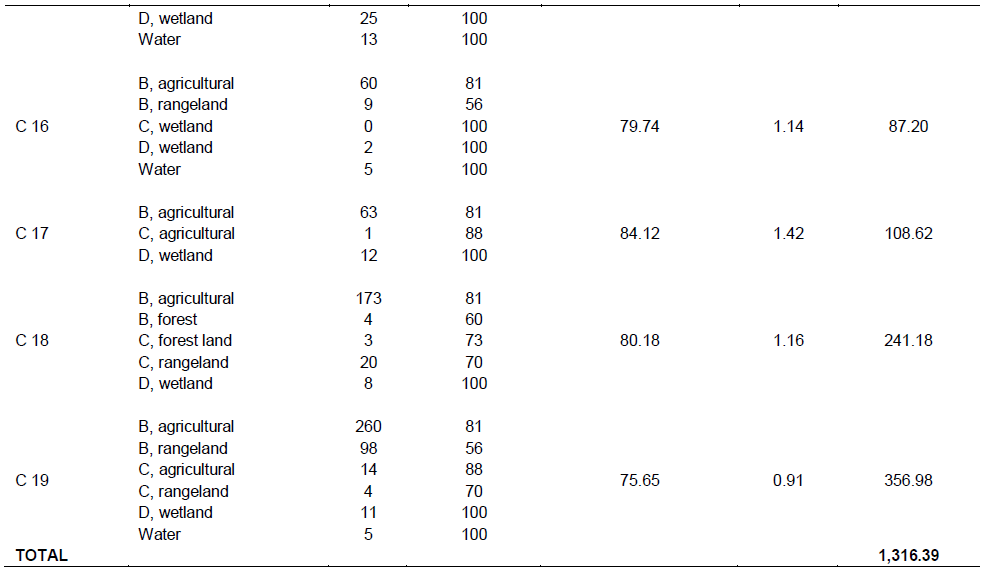
This study analyzed how the catchments of rainwater are distributed in the District and how much water could be collected from each catchment and from the district as a whole using the NRCS Curve Number method. The major outlet points of surface runoff from the District are identified and the catchments draining water to those points, delineated. By assessing how much water is possible to collect in the District through rainwater harvesting, it can be observed that sub catchment C19 by virtue of its drainage pattern and its large surface area would generate 357 x 106 m3/day followed by C18 that would also generate 240 x 106 m3/day per day. The subcatchment that would generate the least amount of runoff would be C4 with 9 x 10⁶ m3/day. Thus from a general point of view, subcatchments C19 and C18 act as best potential rainwater harvesting sites and subcatchment C4 would be least suitable as a water harvesting site. The extracted catchments derived through the DEM hydroprocessing are rainwater harvesting potential areas and they give a clear indication of the spatial extents and this existing potential can be a starting point for creating awareness among stakeholder at the local and national scale. Because of lack of routing of runoff from individual pixels and connecting channels to the watershed outlet as highlighted by the work of Senay and Verdin (2004), it is unclear how the large size of the modelling unit would affect the runoff estimation in the District.
Crop production potential
Not all the runoff can or should be harvested for agricultural uses; about a third of it is needed to sustain the environment (UNEP, 2006; Gupta et al., 1997). Considering that a third is allocated for environmental purposes, the remaining runoff that could be collected in Bugesera District from the average daily rainfall of 1,320 x 109 m3, is equal to 877 x 106 m3 per day. Using the CSIRO figures, the amount of runoff that may be collected in Bugesera District, 877 x 106 m3/day, have the capacity to induce harvest of between 398 x 103 and 531 x 103 tones of paddy rice annually. When used for the production of maize, between 1,390 x 103 tonnes and 1,620 x 103 tones may be harvested. The same estimations may be obtained for other crops. This highlights the huge potential that rainwater harvesting has in the production of crops. The main agricultural areas in the Bugesera District fall within the range of 360 and 450 mm of annual runoff (MINITERE/CERECE, 2003). These are areas that require supplementary irrigation to mitigate inter-seasonal crop failures and increase the crop yields.
Improved certainties in assessing the potential in the production of crops, would require social considerations of population density and also the required watershed size needed to fill a small storage reservoir that can be used for alleviating water stress during a crop growing season. Thus for effective implementation of potential rainwater harvesting in any area, the number of potential ponds per family emanating from physical watershed and social considerations would go a long way in boosting crop production Sub-Saharan Africa (Senay and Verdin, 2004).
Integrating RS and GIS (data preparation and model parameterization) with hydrological modelling to identify the potential for rainwater harvesting in the Bugesera District is an effective strategy. The strength of this integration technique in this work lies on the use and application of spatially distributed soils, landcover, topographic data sets and rainfall interpolated in a GIS from meteorological stations. Therefore accuracy of these interpolation methods and DEM Hydroprocessing algorithms for catchment delineation needs to be ensured to avoid uncertainties that can compromise the final assessment for rainwater harvesting.
The amount of rainfall runoff that can be safely harvested from the Bugesera District has been estimated to be 877 x 106 m3/day. If used for the production of rice, between 400 x 103 and 530 x 103 tones of paddy rice could be obtained annually, while if used for maize production, between 1390 x 103 tones and 1620 x 103 tones may be harvested. As the potential of rainwater harvesting in Bugesera District is high, this might require water storage and other detention facilities such as ponds, which cannot be provided by the farmers in the district. It is therefore recommended that the Government, through the District Agricultural Units help in providing these facilities. This would contribute immensely in improving agricultural productivity of the land and provide food security and livelihood for the population in the District and Rwanda.
The authors have not declared any conflict of interest.
The authors are very grateful to The Netherlands Government through Nuffic for sponsoring this study under the WREM Project, a collaborative capacity building project between the National University of Rwanda and the UNESCO-IHE Institute for Water Education as well as the University of Rwanda for it support in payment of publication fees.
REFERENCES
|
Artan G, Verdin J, Asante K (2001). A wide-area flood risk monitoring model. In Fifth international workshop on application of remote sensing in hydrology, Montpellier, France 2:5. |
|
|
|
Barron J, Stacey NS (2008). Agricultural water management in smallholder farming systems: the value of soft components in mesoscale interventions SEI Report. |
|
|
|
Bontemps S, Defourny P, Van Bogaert E, Arino O, Kalogirou V, Perez JR (2011). GLOBCOVER 2009: Products Description and Validation Report (ESA and UCLouvain) |
|
|
|
Ching LL, Edwards S, Scialabba NE (2011). Climate Change and Food Systems Resilience in Sub-Saharan Africa. Food and Agriculture Organization of the United Nations. |
|
|
de Winnaar G, Jewitt GPW, Horan M (2007). A GIS-based approach for identifying potential runoff harvesting sites in the Thukela River basin, South Africa. Physics and Chemistry of the Earth, Parts A/B/C 32(15-18):1058-1067.
CrossRef |
|
|
|
FAO (2003). Land and Water Digital Media Series, 26. Training Course on RWH (CDROM). Planning of Water Harvesting Schemes, Unit 22. Food and Agriculture Organization of the United Nations, Rome, FAO. |
|
|
|
Fraiser GW (1980). Harvesting water for, agricultural, wildlife, and domestic uses. J. Water Conser. 35:125-128. |
|
|
Garbrecht J, Martz LW (1997). The assignment of drainage direction over flat surfaces in raster digital elevation models. J. Hydrol. 193:204-213.
CrossRef |
|
|
|
Gupta KK, Deelstra J, Sharma KD (1997). Estimation of water harvesting potential for a semiarid area using GIS and remote sensing. Remote sensing and geographic information systems for design and operation of water resources systems. Proc. international symposium, Rabat, Morocco, 1997(242):53-62. |
|
|
|
ICRAF (2005). Potential for Rainwater Harvesting in Africa. A GIS overview, ICRAF and UNEP. |
|
|
|
ICT-Environment Linkage (2007). Pilot Integrated Ecosystem Assessment of Bugesera. UNEP/UNDP/ GOR Poverty and Environment Initiative Project (PEI). |
|
|
|
Kijne J (2000). Water for food for sub-Saharan Africa. Article prepared for FAO. |
|
|
Maathuis BHP, Wang L (2006). Digital Elevation Model based Hydro-processing. Geocarto-International, 21(1):15.
CrossRef |
|
|
|
MINITERE (2003a). National Strategy and Action Plan for the Conservation of Biodiversity in Rwanda. |
|
|
|
Munyao JN (2010). Use of Satellite Products to Assess Water Harvesting Potential in Remote Areas of Africa. A Case Study of Unguja Island, Zanzibar. MSc Thesis Work, Faculty of Geoinformation Science and Earth Observation in Water Resources and Envionmental management, ITC, Enschede. |
|
|
Mwenge KJ, Lillie SB, Taigbenu AE, Taute M, Boroto RJ (2008). Developing suitability maps for rainwater harvesting in South Africa. Phys. Chem. Earth 33(8-13):788-799.
CrossRef |
|
|
Ngigi SN (2003). What is the limit of up-scaling rainwater harvesting in a river basin?. Phys. Chem. Earth 28:943–956.
CrossRef |
|
|
Oweis T, Hachum A (2006). Water harvesting and supplemental irrigation for improved water productivity of dry farming systems in West Asia and North Africa. Agric. Water Manage. 80(1-3):57-73.
CrossRef |
|
|
|
Perdue Research Foundation (2004). Hydrologic Soil Group: Electronic references. Retrieved November 20, 2007.
View
|
|
|
|
Rao KV, Bhattacharya AK, Mishra K (1996). Runoff estimation by curve number method-case studies. J. Soils Water Conser. 40:1-7. |
|
|
Rockström J (2001). Green water security for the food makers of tomorrow: windows of opportunity in drought prone savannahs. Water Sci. Technol. 43:71-78.
PubMed
|
|
|
Rockström J, Barron J, Fox P (2002). Rainwater management for increased productivity among small-holder farmers in drought-prone environments. Phys. Chem. Earth 27:949-959.
CrossRef |
|
|
|
Senay GB, Verdin JP (2004). Developing Index Maps of Water-Harvest Potential in Africa. 20(6):789-799. |
|
|
Sharma TP, Kiran VS, Singh TP, Trivedi AV, Navalgundi RR (2001). Hydrologic response of a watershed. Int. J. Remote Sens. 22(11):2095-2108.
CrossRef |
|
|
Silveira L, Charbonnier F, Genta JL (2000). The antecedent soil moisture condition of the curve number procedure, J. Hydrol. Sci. 45(1):3-12.
CrossRef |
|
|
Srivastava RC, Singhandhupe RB, Mohanty RK (2004). Intergrated farming approach for runoff recycling systems in humid Plateau areas of eastern India. Agric. Water Manage. 64(3):197-212.
CrossRef |
|
|
Tabor JA (1995). Improving crop yields in the Sahel by means of water-harvesting. J. Arid Environ. 30(1):83–106.
CrossRef |
|
|
|
Tan CH, Melesse AM, Yeh SS (2002). Remote sensing and Geographic Information System in runoff coefficient estimation in China Tapei, GIS Developement. Net. P. 6. |
|
|
|
Tripathi AK, Pandey, Uma K (2005). Study of Rainwater Harvesting Potential of Zura Village of Kutch District of Gujarat. J. Hum. Ecol. 18(1):63-67.
View
|
|
|
|
UNEP (2006). November, 13th. Harvesting Rainfall a Key Climate Adaptation Opportunity for Africa.
View
|
|
Soil Conservation Service (USDA-NRCS) (1964). National Engineering Handbook, Section 4, Hydrology. Department of Agriculture, Washington, P. 450. Soil Conservation Service (USDA-NRCS) (1972). National Engineering Handbook, Section 4, Hydrology. Department of Agriculture, Washington, P. 762.
|
|
USDA (2004). Estimation of Direct Runoff from Storm Rainfall, National Engineering Handbook, P. 79. |
|
|
|
WFP (2006). Executive Brief: Rwanda Emergency Food Security Assessment. 28 April 2006 Pedosphere.com (2002). American Texture Triangle: Electronic references. Retrieved November 7, 2004, from http://www.pedosphere.com/resources/texture/triangle_us.cfm |