ABSTRACT
The genetic divergence among twenty-three pear genotypes under the present study was of medium quantum. The studied genotypes, on the basis of total variability were grouped into three distinct clusters. Maximum number of cultivars were accommodated in Cluster II (Ishiwase, Seckel, Anjou, Beurre Hardy, Lisnova Karavista, Jargonelle, Kala Hathi, Autumn of Yaklove, Kashmir Pear, Hengal, Flemish Beauty, Awal Number and Basuidse Favourite) followed by Cluster III (William Bon Chrétien, Luhimtsa Kalapa, Manning Elizabeth, Red Bartlett, Max Red Bartlett and Starkrimson) and Cluster I (Kiskusui, Yakumo, Bodde Cappiament and Nouveau Poiteau). Cluster II had highest intra cluster value and was therefore the most divergent and Cluster III had least intra cluster value so was least divergent. Highest value for inter cluster distance was recorded between Cluster I and III while it was lowest between Cluster I and II. Cluster means were maximum in Cluster II. Kala Hathi was found to be best cultivar for fruit yield/tree and tree height while Red Bartlett was for fruit length and breadth. Cultivars Beuree Hardy and Ishiwase proved best for different vegetative characters.
Key words: Pear, Pyrus commmunis L., cluster analysis, D2 statistics, genetic divergence.
The cultivated pear (Pyrus commmunis L.) is a member of family Rosaceae and sub family Amygdaloideae. The pear is native to coastal and mildly temperate regions of the old world, from Western Europe and North Africa east right Asia. For the success of any breeding programme the basic requirement is the variability found within the members of the population (Bell et al., 1999). It is this variation which if heritable could be used for cultivar improvement, as improved cultivars are the backbone of any orchard system. Therefore, prior to initiation of any breeding programme they should be tested and extent of variability present must be adequately assessed so that the breeding programme could yield the desired results (Sharma and Sharma, 2006). To use or exploit the available variability present in the genetic material in the form of some specific groups or classes, the divergence studies based upon some desirable/suitable parameters is of very essential and of utmost significance (Bellini and Nin, 2002). Keeping in view the above, genetic divergence and cluster analysis using D2 statistics was undertaken with the objective to assess the variability present among the twenty-three pear genotypes and potential use of this variability for hybridization programmes. Use of Mahalanobis D2 statistics to estimate or evaluate the net/total divergence has been indicated by number of workers in different fruit crops (Saran et al., 2007). The use of genetically divergent parents in hybridization under transgressive breeding programme is dependent upon categorization of breeding material on the basis of appropriate criteria (Santos et al., 2011). Apart from providing requisite assistance or help in selection of divergent parents in hybridization, D2 statistics also adequately assists in the measurement of diversification and the contribution of the relative proportion of each component trait towards the total genetic divergence or variation.
MaterialS and Methods
studies were carried out in the Department of Fruit Science, Dr YS Parmar University of Horticulture and Forestry, Nauni, Solan, Himachal Pradesh, India on twenty-three pear genotypes viz; Lisnova Karavista, Jargonella, Kala Hathi, Kiskusui, Yakumo, Bodde Cappiament, Nouveau Poiteau, Ishiwase, Seckel, Anjou, Beurre Hardy, Autumn of Yaklove, Kashmir Pear, Hengal, Flemish Beauty, Awal Number, Basuidse Favourite, William Bon Chrétien, Luhimtsa Kalapa, Manning Elizabeth, Red Bartlett, Max Red Bartlett and Stakrimson. Tree height and spread (North-South and East) were measured with the help of measuring pole and were expressed in meters. The trunk girth was measured at a height of 9 cm above graft union with the help of measuring tape and was expressed in centimetres. The length and diameters of ten fruits was measured with the help of digital vernier calliper and mean was worked by weighing ten fruits selected randomly from each tree and weighed on a single pan kitchen balance and mean was expressed in grams (g). Flesh firmness of fruit was measured after removing the skin (0.8 cm) and using effigy penetrometer (model FT 327) with plunger of 11 mm diameter. The results were expressed in lb per sq inch. Total soluble sold contents of five uniformly ripened fruits of each tree were determined with an Erma hand refrectometer (0 to 32° Brix) by placing few drops of juice on the prism and reading was taken. The weight of entire fruits harvested from per tree was recorded for each cultivar and the results were expressed as yield per tree. Mahalanobis D2 statistic was used for assessing the genotypic divergence between populations (Mahalanobis, 1936). The generalized distance between any two populations is given by the formula:
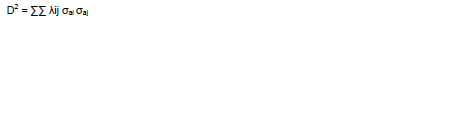
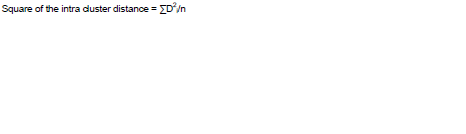
Where D2 = square of generalized distance; λij = reciprocal of the common dispersal matrix, σaj = (µi1-µi2); σaj = (µj1-µj2); µ = general mean. Since, the formula for computation requires inversion requires inversion of higher order determinant, transformation of the original correlated unstandardized character mean (Xs) to standardized uncorrelated variable (Ys) was done to simplify the computational procedure. The D2 values were obtained as the sum of squares of the differences between pairs of corresponding uncorrelated (gs) values of any two uncorrelated genotype of D2 value. All n(n-1)/2 D2 value were clustered using Toucher’s method described by Rao (1952). The intra cluster distances were calculated by the formula given by Singh and Chaudhary (1997):
Where ∑D2i is the sum of distance between all possible combinations of the entries included in a cluster and n is number of all possible combinations.
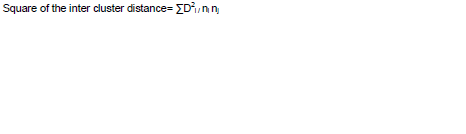
The inter cluster distances were calculated by the formula described by Singh and Choudhary (1997):
Where, ∑D2i is the sum of distances between all possible combinations (ni nj) of the entries included in the cluster under study. ni is number of entries in Cluster I and nj is number of entries in Cluster j.
The criterion used in clustering by this method was that any two genotypes belonging to the same cluster, at least on an average, show a small D2 value than those belonging to two different clusters.
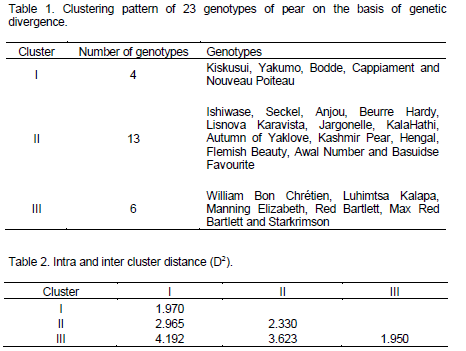
The clustering pattern of twenty-three cultivars of pear for tree, shoot, fruit and yield characters are presented in Table 1. The genetic divergence in the present study observed among the twenty three cultivars is of medium quantum. The twenty-three cultivars on the basis of net variability were grouped into three distinct clusters. Maximum number of cultivars (13) were accommodated into Cluster II (Ishiwase, Seckel, Anjou, Beurre Hardy, Lisnova Karavista, Jargonelle, Kala Hathi, Autumn of Yaklove, Kashmir Pear, Hengal, Flemish Beauty, Awal Number and Basuidse Favourite) while the minimum number (4) were in Cluster I which included Kiskusui, Yakumo, Bodde Cappiament and Nouveau Poiteau. Inter and intra cluster divergence values (D2) between and within four clusters are presented in the Table 2. The intra cluster distance was found to be maximum (2.330) for Cluster II and minimum (1.950) for Cluster III. Highest value (4.192) for inter cluster distance was recorded between Clusters I and III while it was lowest (2.965) between Clusters I and II. On the basis of results, it is inferred that subsequent hybridization between the genotypes having broad genetic base should result in maximum heterotic performance and eventually the desirable transgressive recombinants, as broad genetic base is a fundamental requirement for any crop improvement programme (Sharma et al., 2013; Srivastava et al., 2012). The Cluster II accommodating cultivars Ishiwase, Seckel, Anjou, Beurre Hardy, Lisnova Karavista, Jargonella, Kala Hathi, Autumn of Yaklove, Kashmir Pear, Hengal, Flemish Beauty, Awal Number and Basuidse Favourite was more divergent, followed by Cluster III having six cultivars namely William Bon Chrétien, Luhimtsa Kalapa, Manning Elizsbeth, Red Bartlett, Max Red Bartlett and Starkrimson. Wide diversity in the progeny is expected when hybridization is attempted within cultivars which are more divergent. Since inter cluster distance is maximum (4.192) between Clusters I and III so maximum variability will be achieved when hybridization between the cultivars accommodating these clusters is attempted.
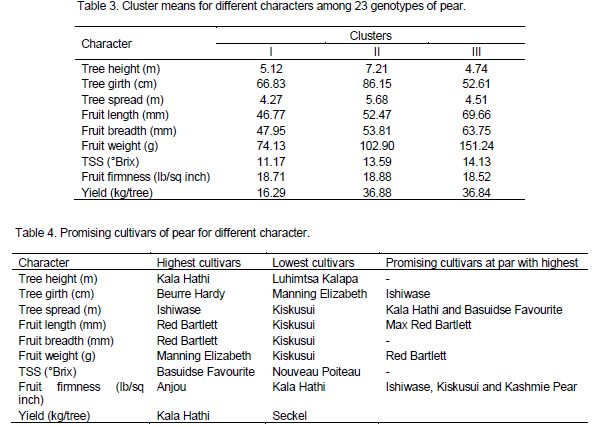
The cluster means of the various trees, shoot, fruit and yield characters are presented in Table 3. The average cluster means revealed highest values for characters like tree spread (7.21 m), tree girth (86.15 cm), tree spread (5.68 m), fruit firmness (18.88 lb/inch2) and yield (36.88 kg/tree) in Cluster II. The Cluster III had better mean performance for the traits like fruit length (69.66 mm), fruit breadth (63.75 mm), fruit weight (151.24 g) and TSS (14.13°Brix). Cluster I did not show mean value superior than Cluster II and for any character studied. While studying the clonal variability in mango Manchekar et al. (2011) reported substantial variation after applying D statistics. Hence, it is concluded that genotypes with wide variation accompanied with useful characteristics could be effectively employed in intra specific crossed with the hope that this would lead to the transmission of higher genetic gain for different putative traits major being yield from practical utility perspective. On the basis of the performance of different cultivars and the cluster analysis, the twenty-three pear genotypes have been identified for different characters (Table 4) which are potential parents for hybridization programmes. ‘Kala Hathi’ is best cultivar for fruit yield/tree and tree height. However, cultivar Red Bartlett outperformed all other cultivars for the characters fruit length and breadth. Cultivars Beurre Hardy and Ishiwase prove best for vegetative characters, that is, tree girth and spread. Sweetness was highest in cultivar Basuidse Favourite.
The author(s) have not declared any conflict of interests.
REFERENCES
|
Bell RL, Scorza R, Srinivasan C, Skirvin RM (1996). Pears. In: Janick J, and Moore JN. (eds.) Fruit Breeding. Tree and Tropical Fruits. John Wiley & Sons, New York. pp. 441-514. |
|
|
|
Bellini E, Nin S (2002). Breeding for new traits in pear. Acta Hort. 596:217-224. |
|
|
|
Mahalanobis PC (1936). The generalized distance in statistics. Proc. Nat. Acad. Sci. 2:79-85. |
|
|
Santos CAF, Correa LC, Costa SR (2011). Genetic divergence among Psidium accessions based on biochemical and agronomic variables. Crop Breed. App. Biotech. 11:149-156.
Crossref |
|
|
|
Saran PL, Godara AK, Dalal RP (2007). Biodiversity among Indian Jujube (Ziziphus mauritiana Lamk) genotypes for powdery mildew and other traits. Not. Bot. Hort. Agrobot. Cluj. 35:15-22. |
|
|
|
Sharma G, Sharma N, Bashir Q, Khokhar A, Jamwal M (2013). Genetic divergence and cluster analysis studies of different apple genotypes using D2 statistics. Afr. J. Agric. Res. 8:4681-4685. |
|
|
|
Sharma DD, Sharma G (2006). Studies on genetic variability of pear germplasm. Indian J. Pl. Gen. Res. 19:200-202. |
|
|
Singh PK, Chaudhary RD (1997). Biometrical Methods. In: Quantitative Genetic Analysis. Kalayani Publishers, New Delhi, pp. 178-185.
Crossref |
|
|
|
Srivastava KK, Singh SR, Ahmad N, Das B, Sharma OC, Rather JA, Bhat SK (2012). Genetic divergence analysis of pear using qualitative traits as per DUS guidelines. Indian J. Hortic. 69:432-434. |