ABSTRACT
Whilst livestock production plays an increasingly important role in the economies of most nations, it remains vulnerable to diseases. Between 2008 and 2011 South Africa experienced episodes of Rift Valley fever (RVF) outbreaks. Losses of animals especially, sheep were widespread in the Free State, Northern Cape and Eastern Cape provinces. Despite the knowledge that the RVF outbreaks in 2010 affected farmers negatively, no previous quantitative assessment has been conducted to establish the extent of this impact on farmers’ herds. This paper evaluated the influence of 2010 RVF outbreaks on sheep numbers using data that were obtained from a 2014 field survey of 150 farms in the most severely affected districts of the Northern Cape, Eastern Cape and Free State provinces. Farmers were asked to indicate their herd size, offspring rate, mortality rate and weaning rate before, during and after the outbreaks. The average performance parameters were checked against the provincial livestock numbers reported by the Department of Agriculture, Forestry and Fisheries in 2013. Sheep numbers declined from 7.5 million in 2008 to 7.3 million in 2010, 6.2 million to 6.1 million, and from 4.9 million to 4.8 million in the Eastern Cape, Northern Cape and Free State, respectively. The total financial value of sheep losses incurred by farmers in the three provinces during the 2010 outbreaks was estimated at R203.4 m.
Key words: Animal losses, financial losses, Rift Valley fever, sheep numbers, South Africa.
Globally, the livestock sector plays an important role in the economies of many developing countries (Blench, Chapman and Slaymaker, 2003). About 800 million to 1 billion of the world’s poor and landless derive their livelihoods from livestock activities (Livestock in Development [LID] 1999; Birol et al., 2011). Morgan and Tallard (2007) estimated that food derived from items such as meat, milk and eggs in Africa contributes, on average, 30% to agricultural gross domestic product (GDP). About 70% of the rural poor in Africa own livestock and over 200 million of these livestock owners rely on their livestock for income as well as draught power and fertiliser for crop growing (Morgan and Tallard, 2007).
Although livestock production plays an important role in the economies of most nations, livestock remains vulnerable to diseases. These diseases sometimes result in outbreaks that vary in severity and magnitude of economic impact. Immediate impacts of a disease outbreak include a reduction in the productive capacity of the animals and a subsequent reduction in the supply of meat and meat products (Pritchett et al., 2005).
According to Perry and Randolph (1999) animal disease outbreaks pose substantial threats to livestock sectors in terms of the economic effects of the diseases themselves as well as the actions taken to alleviate the risk of disease introduction or spread. The multidimensional nature of these effects tends to complicate effective policy responses (Rich et al., 2005). The first response to policy-related appraisal of animal diseases control often requires analyses of the economic impacts of a disease outbreak (Rich et al., 2005). The impact of animal diseases on agriculture is usually assessed in quantitative terms; lost revenues, cost of eradication, decontamination, vaccination and restocking, and the numbers of affected farms, animals and humans.
Rich and Wanyioke (2010) assessed the regional and national socio-economic impacts of the 2007 RVF outbreak in Kenya. RVF is a zoonotic disease that is spread by infected mosquitoes. It is characterised by high rates of abortion and neonatal mortality, primarily in sheep, goats and cattle, but also in exotic and wild animals. The total economic losses from livestock mortality were estimated to be over US$9.3 million, and US$77.00 for potential milk production, while RVF-induced abortions in sheep resulted in a 22% reduction in potential flock size. However, ‘conventional estimates of the cost of disease have no particular significance, because their magnitude carries no indication as to what, if anything, should (or could) be done about the situation’ (McInerney et al., 1992).
Velthuis et al. (2010) used an econometric model to estimate the financial consequences of the bluetongue 8 (BTV8) epidemics of 2006 and 2007 in the Netherlands. The costs of the outbreaks were estimated using a deterministic economic model that was compatible with the Dutch livestock production systems for cattle, sheep and goats. The financial consequences of the outbreak included the impact on production, treatment of infected animals, diagnostic costs and costs of control measures applied during the course of the outbreak. The cattle sector incurred the highest costs of all sectors: 88 and 85% of the net costs for the 2006 and 2007 outbreaks, respectively. The study revealed that the introduction and establishment of BTV8 in the Netherlands caused significant losses, due to both the clinical disease and control measures that were constantly required. Given the vital role played by livestock farming as a source of livelihood for many rural communities and resource poor farmers (Spies, 2011) and its contribution of more than 40% to the total agricultural GDP, it is important understand the true impact of this disease in South Africa. Such information is crucial to justify efficient and effective policies for disease prevention and control.
Between 2008 and 2010, South Africa experienced episodes of RVF outbreaks. The 2010 RVF disease outbreaks were reported to have had a significant economic impact on cattle and sheep production, especially affecting thousands of animals in the Free State, Northern Cape and Eastern Cape provinces. Pienaar and Thompson (2013) documented the temporal and spatial history of RVF in South Africa from 1950 to 2011. According to Pienaar and Thompson (2013) a total of about 484 outbreaks were reported during the 2010 outbreaks with 14 342 animal cases and 8 877 animal deaths. Pienaar and Thompson (2013) also reported that out of 14 342 animal cases that were reported, 13 117(91.45%) cases were those of sheep. Their study did not provide the details on financial losses incurred.
In South Africa, RVF vaccines are manufactured by Onderstepoort Biological Products (OBP). Based on personal communication with Jacob Modumo (2012) who is the head of marketing for OBP, (2012) (Modumo and Venter 2012), for the last fourteen years very few sales of the RVF vaccine were made and most of these were exports. This evidence supports claims that few South African farmers had been vaccinating against the disease until the recent outbreaks. That left livestock producers (and all associated stakeholders) vulnerable to severe losses when RVF occurred; losses that could have been avoided if farmers had implemented continuous vaccination programmes against the disease. Hence, to inform effective policy making in the control and prevention of RVF, this paper evaluates the impact of the 2010 RVF outbreaks on sheep numbers (the most affected animal species during the 2010 outbreaks) in the selected study areas. In the process, the financial value of sheep losses incurred by farmers in the three provinces was estimated. This paper will also test the hypothesis that all farmers including those who applied animal health-care programmes that included vaccination against RVF were equally affected by the outbreak when it occurred.
Sampling design and sample size
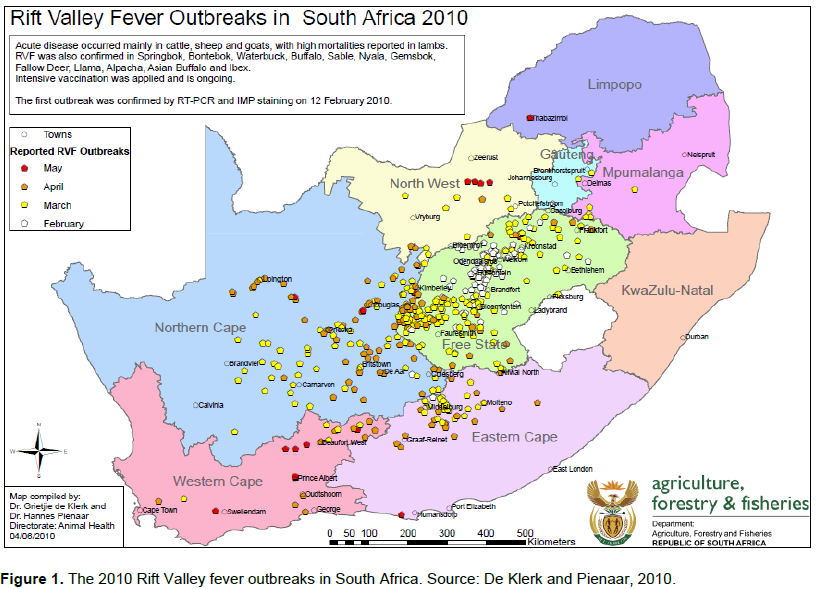
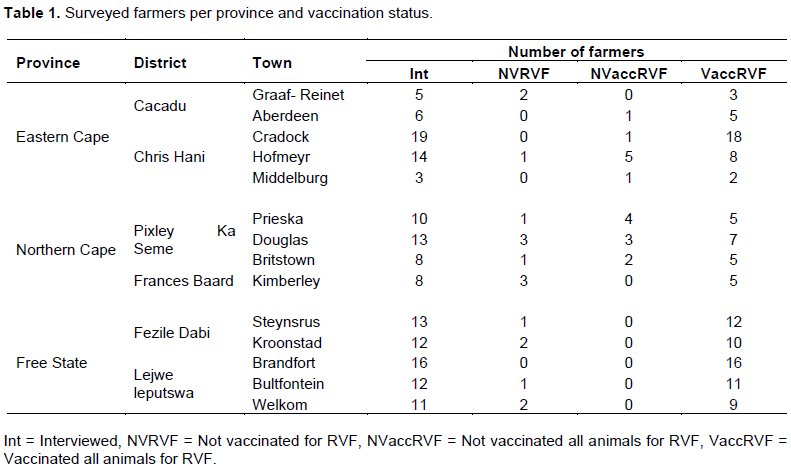
The study focused on livestock farmers who kept cattle, goats, and sheep or any combination of the three. The RVF map (Figure 1) obtained from Department of Agriculture, Forestry and Fisheries (DAFF), 2010 indicates that eight provinces; Eastern Cape, Northern Cape, Western Cape, North West, Gauteng, Limpopo, Mpumalanga and Free State were affected by the 2010 outbreaks. This study used a multi-stage sampling method. The first stage involved the purposive selection of the three provinces: The Eastern Cape, Northern Cape and Free State. Pienaar and Thompson (2013) report that livestock farmers in these three provinces were most severely affected by the 2010 outbreaks. Based on the availability of resources (time and personnel), the study targeted two affected districts in each province. A simple random sampling without replacement method was used to select the two districts from each province; Chris Hani and Cacadu districts of the Eastern Cape Province, Frances Baard and Pixley Ka Seme districts of the Northern Cape Province and Fezile Dabi and Lejweleputswa districts of the Free State Province.

The lists of livestock farmers from the selected six districts of the three provinces were obtained from the respective animal health practitioners. The lists included the name and contact details of the farmer, type and number of livestock kept, land tenure system and the town as the location of the farm. The lists were then compressed into one list of 266 farmers that was used for selecting the sample. To select a representative sample out the 266 population, the study targeted 150 farmers. A systematic random sampling method was used to select 150 sample size of farmers. A systematic random sampling method was initiated by calculating the sampling interval (k) using the formula:

Where, N is the population and n is the sample size (Black, 2004). The sampling interval (k) was 2; sampling was initiated by randomly selecting farmer number, 3. Applying the sampling interval, the second number was 5 followed by 7, etc. This procedure ensures that each farmer in the population has a known and equal probability of selection. Farmers from the sample were further stratified according to towns and type of livestock. The process ended with 15 towns (stratums – Table 1). Overall the sample included communal farmers, small-holder and commercial farmers.
Questionnaire design and data collection methods
A structured questionnaire for farmer interviews was developed and implemented. The questionnaire included open-ended questions to collect qualitative data as well as close-ended question to collect quantitative data. The questionnaire was pre-tested on eight livestock farmers in the Free State Province. Subsequently, the questionnaire was adjusted to incorporate lessons learnt during the pilot survey. Face-to-face interviews were used to collect data from the 150 respondents. The researcher personally conducted the interviews. Farmers whose contact details were available on the list were called to arrange appointment and venue for the interviews. Interviews with both small-holder and commercial farmers were conducted at their respective farms. Some communal farmers were interviewed during the morning and afternoon in the communal kraals after tendering to their animals while others were interviewed at their households. Information gathered with the questionnaire included; demographic details, livestock activities, animal health practices, production and management practices and prevention of RVF as well as the impact of RVF outbreaks on livestock numbers. While some of commercial and smallholder farmers shared filed records of their farming activities including data on production parameters, others consulted with their farm managers to verify the figures. Since communal farmers keep few herds of livestock, they could easily recall animal losses and the trends of their production parameters.
Description of questions asked
Questions pertaining to the location (province, district, local municipality and town) of the farmer were included in the questionnaire to permit analysis of the impact on a provincial basis. The questionnaire asked questions related to the demographic characteristics (age and farming experience) of each respondent.
To identify animal activities and animal health care-practices, farmers were asked to provide data on production systems (breeder, feedlot, etc.), land tenure system (communal, leased or private), as well as type and number of livestock kept. Farmers were asked whether they usually vaccinate their animals and against which diseases. They were also asked if they normally applied biosecurity measures as well as the nature of the biosecurity measures applied. On prevention of RVF, farmers were asked about when they started RVF vaccination as well as which type of vaccine they used.
To understand the overall impact of RVF outbreaks on sheep numbers, farmers were asked to indicate their herd size, offspring rate, mortality rate and weaning rate before, during and after the outbreaks. The data collected on production parameters covered the 2008 to 2012 period. The mean performance parameters were then checked against the provincial livestock numbers reported by DAFF 2014. To estimate the financial value of sheep losses, farmers were asked to identify which year they incurred animal losses, number of mortalities and abortions as well as type and nature (pregnancy, gender, age and type of breed) of animals lost.
Data management and statistical analysis
The data was captured and stored on a designed excel spread sheet. Validation and exploration of data was performed to check for the inconsistencies in captured data. The coding system was developed and subsequently implemented. The data was also stored in formatted text (space delimited - prn) format to be analysed in statistical package (SAS, 2012). The chi-square test (χ²) for equal proportion technique was used to analyse the data. To analyse the closed-ended questions (quantitative data), frequencies (the actual number of respondents who chose each response) and percentages (the proportion of people who chose each response out of the total number of respondents) were used. In addition, the chi-square test (χ²) was used to test for independence in a two-way contingency table as well as to compare the achieved sample proportions for the categories of variables of the qualitative data such as demographics data (Holt et al., 1980). Pearson correlation tests between animal losses and selected explanatory variables were also performed (XLSTAT, 2013). The significance of the correlation was tested at 5% significance level (Snedecor, 1967).
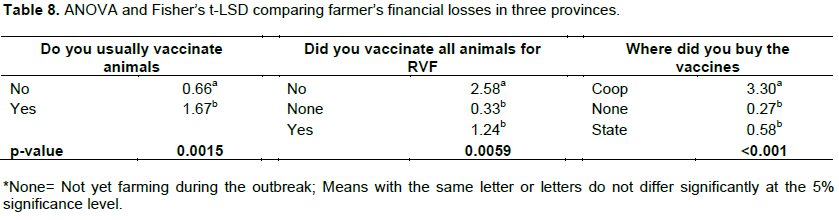
To assess the effect of epidemiology of RVF, a multi-factorial ANOVA (Analysis of Variance) with five (5) factors (province, do you usually vaccinate animals, did you vaccinate all animals against RVF, year when they started vaccination against RVF and where RVF vaccine was purchased) was used to compare difference between animal losses (Snedecor, 1967). However, there was a large variation in animal losses. Hence, the animal loses were transformed with a Log10 transformation to stabilize the variance before in order to apply the analysis of variance. Fisher’s t-LSD (Least significant difference) were calculated at a 5% level of significance to compare means of significant source effects.
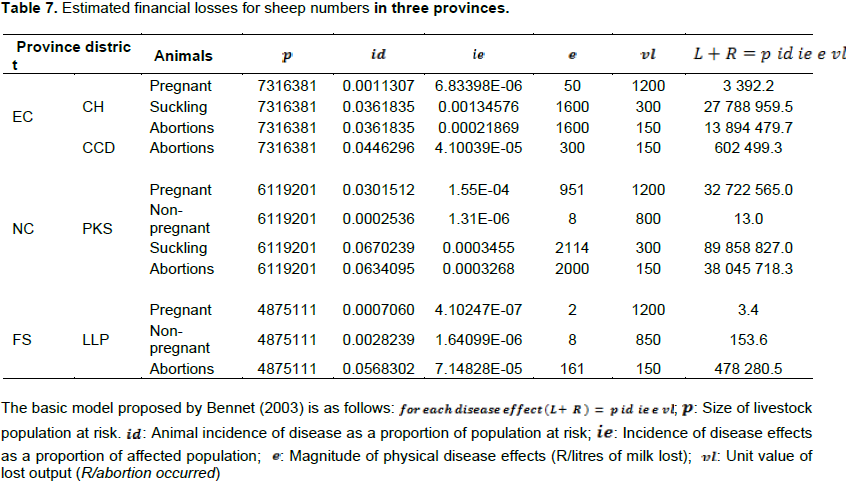
When the trends on production parameters were determined, the study used the deterministic economic model used by Bennett (2003) to estimate the financial cost of the RVF outbreaks on sheep numbers.
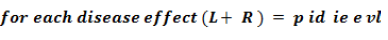
The basic model proposed by Bennett (2003) is as follows:
Where is size of livestock population at risk, is animal incidence of disease as a proportion of population at risk; is Incidence of disease effects as a proportion of affected population; is magnitude of physical disease effects (R/litres of milk lost); and is unit value of lost output (R/abortion occurred) Data on sheep numbers used to determine id and ie was requested and obtained from DAFF. However, it is not available in the public domain and should be treated with discretion.
The attributes of farmers and how they correlate with animal losses are discussed first. The mean age of farmers in Eastern Cape and Northern Cape was 55 while in the Free State, it was 59 (Table 2). There was a significant positive correlation (p = 0.018) between animal losses and age (Table 3). The majority of farmers who kept sheep were younger. Consequently, farmers that were less than 54 years of age in Eastern Cape and Northern Cape were the most affected in terms of revenue losses as they kept large herds of sheep (not shown in the tables). Farming experience was grouped into three categories; < 15 years, 15-24 years and > 25 years. The average years of farming experience was highest in Free State at 22 years followed by Northern Cape and Eastern Cape provinces where farming experience averaged 20 and 18 years, respectively (Table 2). A nonsignificant correlation (p = 0.547) between animal losses and farming experience was established (Table 3). However, a statistically significant relationship was found between farming experience and animal losses, with p = 0.0000, p = 0.0147 and p = 0.0467 for farmers with less than 15, 15 to 25 years and more than 25 years of farming experience, respectively (not shown in the tables). Farmers with more than 15 years of farming experience were the most affected.
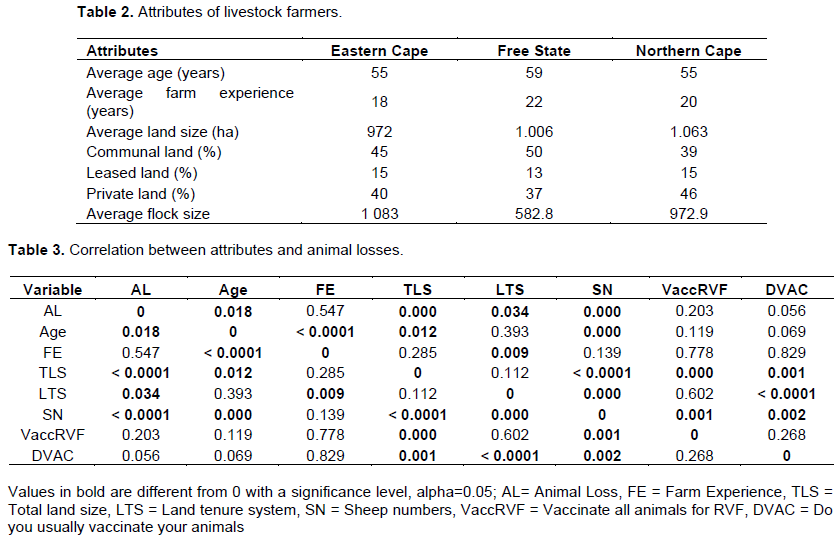
The mean land size in Eastern Cape, Free State and Northern Cape was 972, 1006, 1063, respectively (Table 2). A highly significant correlation (p<0.0001) was found between total land size and animal losses (Table 3). Farmers with more than 3 000 ha were the most affected followed by farmers with less than 500 ha and 500 to 3 000 ha (not shown in the tables). Three forms of land tenure system per province are reported (Table 2). An overall significant correlation (p = 0.034) was established between animal losses and the land tenure system (Table 3).
Compared to the other two provinces, Eastern Cape farmers had the highest average sheep flock size at 1 083, followed by Northern Cape and Free State farmers at 972.9 and 582.8 sheep, respectively (Table 2). A highly significant correlation (p < 0.0001) between animal losses and sheep numbers was found (Table 3).
There was no significant correlation (p = 0.203) between animal losses and vaccination of all animals against RVF (Table 3). The analysis also shown that there was no significant correlation (p = 0.056) between animal losses and usual vaccination of animals against other prevailing animal diseases. Smallholder farmers indicated that the state provided them with free vaccine and also administered the vaccine to all animals on their behalf. This was to ensure that the right vaccine was administered on time and effectively. Some of the commercial farmers indicated that they vaccinated during the course of the outbreaks using one needle for more than 20 animals while others admitted that they changed the needle only when it broke. This practice has the potential to spread the infection if there are infected animals in the herd. Consequently, 71% of commercial farmers were affected by the outbreak compared to 29% of smallholder farmers whom the state assisted with application of the vaccine (not shown in the tables).
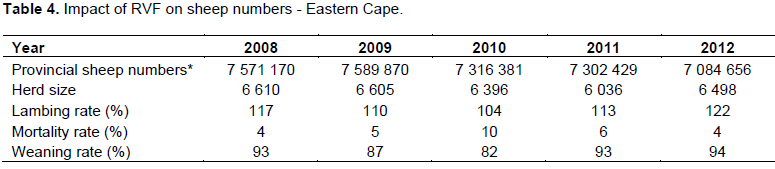
Impact of RVF on sheep numbers - Eastern Cape
During the intense episodes of RVF outbreaks (2009-2010), the average lambing rate of sheep declined from 117% in 2008 to 104% in 2010 (Table 4). In 2011 it started to pick up at 113% to 122% in 2012. In addition, the mortality rate increased from 4% in 2008 to 10% in 2010 while the weaning rate declined from 93 to 82% during the same period. Consequently, the average herd size decreased from 6,610 in 2008 to 6,396 in 2010 and continued to decline to reach 6 036 in 2011 and started picking up in 2012 at 6,498 while the provincial numbers declined from 7.5 million in 2008 to 7.1 million in 2012.
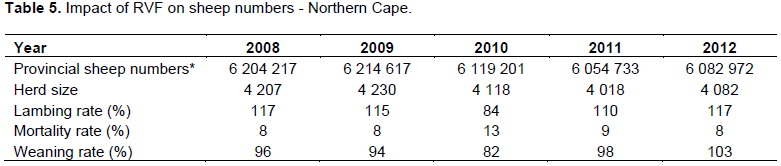
Impact of RVF on sheep numbers - Northern Cape
The lambing rate declined from 117% in 2008 to 84% in 2010 (Table 5). It picked up in 2011 at 110% and normalized (117%) again in 2012. The mortality rate increased from 8% in 2008 to 13% in 2010, improved (9%) in 2011 and normalized to 8% in 2012. The weaning rate declined from 96% in 2008 to 82% in 2010 and improved (98%) again in 2011 to reach 103% in 2012. Farmers reported large number of mortalities in suckling lambs. Consequently, the mean herd size declined from 4 207 in 2008 to 4 118 in 2010 and continued to decline to reach 4 082 in 2012. This impact also was felt at the provincial level where numbers declined from 6.2 million in 2008 to reach 6.1 million in 2012 as the farmers were building the replacement stock.
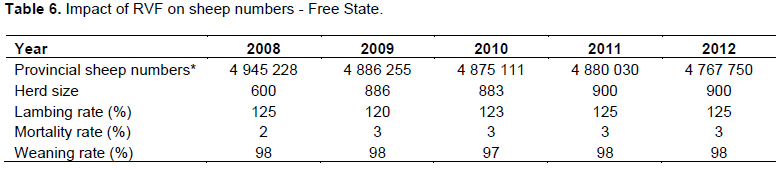
Impact of RVF on livestock numbers - Free State
The lambing rate of sheep declined from 125% in 2008 to 120% in 2009 and continued to decline to reach 123% in 2010 and it normalized again in 2011 (Table 6). During the same period, the mortality rate increased from 2% in 2008 to 3% during 2009 up to 2012. The impact on the weaning rate is only observed during the 2009 to 2010 period with a decline from 98% in 2009 to 97% in 2010. While at the farm level, the mean herd size in the sample depicted an increasing trend from 600 in 2008, at the provincial level sheep numbers depicted a decline from 4.9 million in 2008 to 4.8 million in 2010 and continued to decline to 4.7 million in 2012.
Financial value of sheep losses
Financial losses of sheep were estimated for the respondents in each province. When these losses were scaled up at provincial level, financial losses incurred by farmers who kept sheep were estimated at R42 289 330.7, R160 627 123.3 and R478 437.0 for Eastern Cape, Northern Cape and Free State provinces, respectively (Table 7). During the survey, some of the farmers in the Northern Cape Province and the Cacadu district of the Eastern Cape Province indicated that due to the geographic attributes (Karoo) of their farming area, which does not pose risk to animal disease, they usually did not follow any vaccination program for their livestock. Hence, it is assumed that this practise might have compromised the immune system of the animals by the time of the outbreaks. Huge amounts of financial losses were incurred as a result of highly reported number of abortions and death of suckling animals. The survey revealed that farmers from the Free State incurred major losses during the 2009 outbreaks. Following the 2009 RVF outbreaks in Free State, farmers intensified their vaccination programme against RVF. In addition, the Provincial Department of Agriculture also provided free vaccines to the communal and small-holder farmers in the perceived high-risk areas.

The basic model proposed by Bennet (2003) is as follows: ; : Size of livestock population at risk. : Animal incidence of disease as a proportion of population at risk; : Incidence of disease effects as a proportion of affected population; : Magnitude of physical disease effects (R/litres of milk lost); : Unit value of lost output (R/abortion occurred)
The study hypothesised that all farmers who applied animal health-care programmes that included vaccination against RVF were equally affected by the outbreak when it occurred. The probability values from the ANOVA results show that all farmers, regardless of vaccination status were affected by the outbreaks (Table 8). However, the Fisher’s t-LSD results indicate that farmers were not equally affected. Hence, the hypothesis statement is rejected. Farmers who did not vaccinate all their livestock for RVF and those who bought the vaccine from the cooperatives were the most affected.
CONCLUSIONS AND RECOMMENDATIONS
Although the mean performance parameters reported by farmers suggest that sheep farmers in these three provinces have recuperated from the outbreaks, provincial sheep numbers as reported by DAFF suggest that sheep numbers in these provinces have not recovered to reach the numbers recorded before the 2010 outbreaks. The mean herd size in the Eastern Cape Province decreased from 6 610 in 2008 to 6 396 in 2010 while the provincial sheep numbers declined from 7.5 to 7.1 million in 2012. In the Northern Cape Province, the mean herd size declined from 4 207 in 2008 to 4 082 in 2012. In the Free State Province, despite the mean herd size showing an increase from 600 in 2008 to 900 in 2012, provincial sheep numbers show a decline from 4.9 million in 2008 to 4.8 million in 2012. The total financial value of sheep losses incurred by farmers in the three provinces during the 2010 outbreaks is estimated at R203.4m. The survey revealed that farmers who did not vaccinate all their livestock against RVF were the most affected by the outbreaks and, in addition, the study has shown the value of effective vaccination. It is therefore recommended that farmers should vaccinate all their livestock following the recommended application guidelines. In addition, farmers who do not see the benefit of vaccinating for sporadic disease outbreaks are urged to make use of available platforms and services to enquire about the possible outbreaks, more especially after heavy rains which are normally associated with outbreaks so that they can vaccinate in time if necessary.
The authors have not declared any conflict of interest.
REFERENCES
|
Bennett R (2003). The direct costs of livestock disease: The development of a system of models for the analysis of 30 endemic livestock disease in Great Britain. J. Agric. Econ. 54(1):55-71.
Crossref
|
|
|
|
Birol E, Ndirangu L, Roy D, Yakhshilikov Y (2011). Assessing the livelihood impacts of livestock disease outbreak: An alternative approach. IFPRI discussion paper 01081.
|
|
|
|
|
Black K (2004). Business Statistics for Contemporary Decision Making. Fourth Wiley Student Edition for India ed. Wiley-India. ISBN 978-81-265-0809-9.
|
|
|
|
|
Blench R, Chapman R, Slaymaker T (2003). A study of the role of livestock in poverty reduction strategy papers. PPLPI Working paper No.1.
|
|
|
|
|
DAFF (2013). Department of Agriculture, Forestry and Fisheries Livestock estimates. Downloaded on 02 March 2013 at:
View.
|
|
|
|
|
De Klerk G, Pienaar H (2010). Rift Valley fever outbreaks in South Africa. DAFF, Pretoria, South Africa.
|
|
|
|
|
Holt D, Scott AJ, Ewing PD (1984). Chi-squared tests with survey data. J. R. Stat. Series A 143:303-320.
Crossref
|
|
|
|
|
LID (1999). Livestock in Development. Livestock in Poverty-focused Development. Crewkerne, U.K.
|
|
|
|
|
McInerney JP, Howe KS, Schepers JA (1992). A framework for the economic analyses of disease in farm livestock. Prev. Vet. Med. 13:137-154.
Crossref
|
|
|
|
|
Modumo J, Venter EH (2012). Determination of the minimum protective dose for bluetongue virus serotype 2 and 8 vaccines in sheep. J. S. Afr. Vet. Assoc. 83(1):6
Crossref
|
|
|
|
|
Morgan N, Tallard G (2007). Cattle and beef international commodity profile. Background paper for the Competitive Commercial Agriculture in Sub-Saharan Africa (CCAA) study. Markets and Trade Division, Food Agric. Organ. Available at:
View
|
|
|
|
|
Perry BD, Randolph TF (1999). Improving the assessment of the economic impact of parasitic diseases and of their control in production animals. Vet. Parasitol. 84:145-168.
Crossref
|
|
|
|
|
Pienaar NJ, Thompson PN (2013). Temporal and spatial history of Rift Valley fever in South Africa: 1950 to 2011. Onderstepoort J. Vet. Res. 80(1):384.
Crossref
|
|
|
|
|
Pritchett J, Thilmany D, Johnson K (2005). Animal Disease Economic Impacts: A Survey of Literature and Typology of Research Approaches. Int. Food Agribus. Manag. Rev. 8(1):24-45
|
|
|
|
|
Rich KM, Miller GY, Winter-Nelson A (2005). A review of economic tools for the assessment of animal disease outbreaks. Rev. Sci. Tech. Off. Int. Epizoot. 24(3):833-845.
Crossref
|
|
|
|
|
Rich KM, Wanyioke F (2010). An assessment of the regional and national socio-economic impacts of the 2007 Rift Valley Fever outbreak in Kenya. Am. J. Trop. Med. Hyg. 83(2):52-57.
Crossref
|
|
|
|
|
SAS (2012). The Statistical Procedure manual. North Carolina 27513: SAS Campus Drive, Cary.
|
|
|
|
|
Snedecor GW, Cochran WG (1967). Statistical Methods, Sixth Edition, The Iowa State University Press, AMES, IOWA USA 7:10-11.
|
|
|
|
|
Spies DC (2011). Analysis and quantification of the South African red meat value chain. Unpublished doctoral thesis. University of Free State, Rand Afrikaans University, South Africa.
|
|
|
|
|
Velthuis AGJ, Saatkamp HW, Mourits MCM, Koeijer AA, Elbers ARW (2010). Financial consequences of the Dutch bluetongue serotype 8 epidemics of 2006 and 2007. Prev. Vet. Med. 93:294-304.
Crossref
|
|
|
|
|
XLSTAT (2013). Version 2013. Addinsoft to Microsoft Excel 2013, New York, USA.
|
|