Full Length Research Paper

ABSTRACT
Classification of sorghum [Sorghum bicolor (L) Moench] breeding material based on multiple crucial characters is important towards the possible formation of homogeneous groups of genotypes and groups that can be exploited in the identification of parents for use in a breeding program. The objective was to determine the morphological characters that distinguish desirable breeding material and group the genotypes of sorghum according to similarity. Principal component analysis (PCA) and cluster analysis were used to establish the relationships among germplasm and the Shannon Diversity index was used to quantify the level of diversity. The experiment involving 26 sorghum genotypes was conducted at Sussundenga Research Station across two seasons and laid out in a 13 × 2 alpha lattice design with four replications. Cluster analysis grouped genotypes into four clusters based on 15 evaluated traits. Five principal components cumulatively accounting for 58.5% of the total variation were estimated from the PCA analysis. The results showed that genotypes 150B, IS 14257R, LARSVYT 46B, TX 631B, TX 630B and 8601B were the early maturity while for late maturity genotypes were MA 6B, A 6352R, ICSA 19B and MZ 30R. The genotypes IS 7179R, SPL 9B, A 6353R, SPL 38B, SDS 6013R and MZ 2R showed a potential for grain yield improvement. Other genotypes presented potential for drought tolerance and birds attack. The multivariate analyses clearly showed the grouping of the genotypes according to the characters outlined in the study. These results have implications in selecting parents for use in sorghum breeding program.
Key words: Cluster analysis, diversity index, principal component analysis and sorghum improvement.
INTRODUCTION
Sorghum [Sorghum bicolor (L.) Moench] is an important cereal crop worldwide that is used for food, feed and biofuel. There are different types of sorghum depending on intended use, viz. grain sorghum, dual purpose (grain and fodder) sorghum, fodder sorghum, and sweet stalk sorghum (Kumar et al., 2008; Reddy et al., 2012). Classification of sorghum is also based on its uses and importance.
Central Africa is the origin of sorghum and is where it was domesticated and cultivated (House, 1995). The cultivated and wild sorghums demonstrate greatest genetic diversity of this crop (Ayana and Bekele, 1999). In Ethiopia, the centre of diversity of sorghum, 15 cultivated sorghum races have been reported (Mengesha, 1975). Within these 15 races, 5 races are primary (bicolor, caudatum, guinea, durra and kafir) and 10 races are intermediates of primary races (Harlan and De Wet, 1972). The most cultivated race in Southern and Eastern Africa is guinea (Folkertsma et al., 2005; Lacy et al., 2006). However, Ramathani et al. (2011) reported that all five primary races are cultivated in sub-Saharan Africa. Therefore, it is important to classify the germplasm used in breeding programmes to make it easy for plant breeders to identify and select valuable genetic resources to improve farmers preferred traits in a variety.
There are many mathematical methods that permit grouping of organisms and/or species according to their characteristics. The common methods are the multivariate analysis that includes principal component analysis (PCA) and cluster analysis, which are used to establish the relationship among germplasm and Shannon diversity index which is used to determine the level of diversity. The PCA is a strong tool, which reduces the dimensions of the data before applying clustering (Derksen et al., 1995; Yeung and Ruzzo, 2001). Additionally, cluster analysis is used for pattern recognition and as a discriminant method that reveals structure and relationships in the data (Anderberg, 2014). The Shannon diversity index measures unequal weights through decomposing the measurements into expressive components such as independent alpha and beta components (Jost, 2007). One of the differences between principal component analysis and cluster analysis is that the few PCs containing most of the variation do not capture most of the cluster structure (Yeung and Ruzzo, 2001). This implies that the two methods can complement each other and help breeders better identify proper germplasm for use in their breeding programs.
The diversity of different germplasm is used as a possible source of genes that can be used to improve the performance of cultivars in terms of phenotypic and genetic make-up (Geleta et al., 2006). The use of multivariate approaches such as cluster and principal component analysis may help to estimate the magnitude of diversity among germplasm. These methods use the morphological characters to provide information about the similar groups and the information generated can be used to identify genotypes that have desirable characters for breeding purposes such as hybridization for pedigree breeding. Chikuta et al. (2015) used multivariate analysis approaches to select sorghum genotypes exhibiting high levels of grain and fodder traits from morphological and agronomic data, while Mujaju and Chakauya (2008) used multivariate analysis to categorise agro-morphological characters of sorghum landraces to explain production factors and uses of sorghum at farmers’ level.
Several studies have evaluated genetic diversity through phenotypic data (Ganesamurthy, 2013; Chikuta et al., 2015; Fernandez et al, 2014) and molecular marker data (Muraya, 2014; Uttam et al., 2017). However, there is a need to validate information on the genetic diversity of Mozambican sorghum germplasm using similar approaches. The objective of this study was to identify important morphological traits that distinguish desirable breeding material in the National Sorghum breeding programme.
MATERIALS AND METHODS
Plant
Fifteen cytoplasmic male sterile (CMS) lines and ten male fertile (restorer-R) lines of sorghum were used in this study (Table 1). These breeding lines were sourced from International Crops Research Institute for the Semi-Arid Tropics (ICRISAT) and from the Sorghum National program. Maintainer lines (B-lines) were planted next to the A-lines to facilitate grain formation by male sterile lines, thereby enabling collection of data for panicle and grain traits.

Location and experimental design
The experiment was conducted at Sussundenga Research Station (SRS), Manica State, Mozambique over two seasons. The lines were planted in January 2015 and December 2016. This location covered the mid-altitude mega-environment. Table 2 summarizes the location and annual average rainfall per season. The maximum temperature of 29.5°C and minimum of 17.6°C characterize the location (MAE, 2014). The SRS is located at longitude 33.28° and Latitude -19.4° and an altitude of 579 m above sea level (WA. 2018). The soil type in SRS is majorly red clay soil but sandy soil is also found in some areas (MAE, 2014).

The trial was laid out in a 13 × 2 alpha lattice design with four replications. Each plot had four rows that were 4 m long and spaced 80 cm apart, with an in-row spacing of 25 cm. The crop management was according to recommended practices (Bias et al., 2010).
Data collection
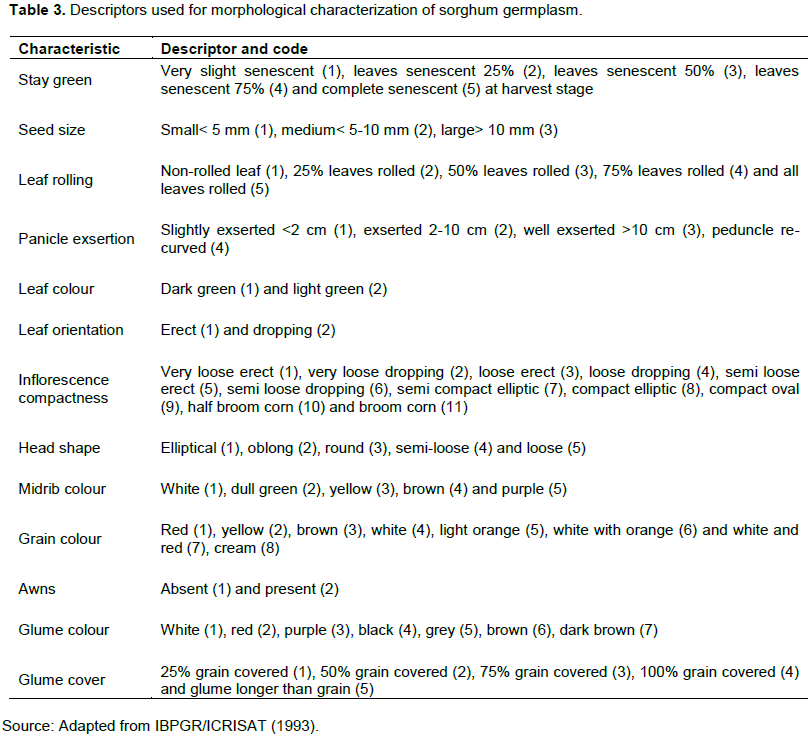
Morphological characterization was done using International Board for Plant Genetic Resource (IBPGR) and International Crops Research Institute for the Semi-Arid Tropics IBPGR and ICRISAT (1993) descriptor list. The characteristics used for phenotypic characterization are described in Table 3. The data were collected and recorded from the two middle rows of each plot. Six plants per accession were randomly selected for observations and measurements.
Data analysis
The analysis of variance for the characters was used to estimate the mean squares effects using the GLM procedures in SAS software version 9.3 (SAS, 2011), according to the model:
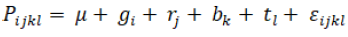
where Pijk is the phenotypic value of the ith accession, µ is the grand mean, gi is the genetic effect for the ith accession, rj is the replication effect, bk is the block effect in each replication, tl is the effect of season and Ôijk is the residual error.
The phenotypic variances for the characters were estimated according to the following model:

where σp2 is the phenotypic variance, σg2 is the genotypic variance, σe2 is the environment variance (the mean square of residual error).
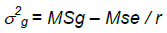
where MSg is the mean square of genotypes, MSe is the mean square of error and r is the number of replications.
The broad sense heritability (hb2) was calculated as:
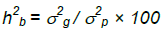
where σp2 is the phenotypic variance and σg2 is the genotypic variance.
Cluster analysis was performed using unweighted pair-group method with arithmetic average (UPGMA) and dendrogram constructed using the GenStat statistic software version 18th (Payne et al., 2016). Principal component analysis (PCA) was performed using the R statistics software (R Team, 2014) where the biplot of multivariate data was constructed.
The diversity among germplasm was determined from morphological frequencies using the method suggested by Grenier et al. (2000). The characters observed were used to calculate Shannon-Weaver index of diversity (H’) from the frequency distribution for the lines and grouped into different classes according to Perry and McIntosh (1991). The calculation was done as:
where H’ is Shannon Diversity Index; pi is the proportion of lines in the ith class of n-class character; n is the number of phenotypic classes of traits.
The H’ estimates were done using GenStat statistic software version 18th (Payne et al., 2016) and Microsoft Excel.
RESULTS
Analysis of variance
Analysis of variance showed highly significant differences (p ≤ 0.01) among lines for most of the characters measured except for the grain colour, glume colour and presence of awns (Table 4).

Variability and heritability of the characters
The genetic variance, phenotypic variance and heritability estimates are shown in Table 5. The phenotypic variance was higher than the genetic variance for all characters. Higher estimates were observed for days to 50% flowering, thousand seed weight and inflorescence compactness. The other characters such as stay green, seed size, leaf rolling, leaf colour and glume cover presented lower estimates.

Very high heritability estimates were obtained for stay green and midrib colour with 96.2 and 97.4%, respectively. Glume cover and leaf orientation also had very high heritability estimates of 92.8% each. The characters with heritability estimates below 50% were thousand seed weight and presence of awns with 45.2 and 15.1%, respectively.
Morphological characterization
Days to 50% flowering ranged from 81 days (line 150B) to 116 days (lines A6352R and MA6B). For the thousand-seed weight, line ICSA21B had a weight of 13.7 g representing the lowest whereas IS 7179B and SP 9B recorded 21.5 and 21.1 g, respectively, representing the highest values (Table 6).
Regarding the stay green character, 65.4% of the lines had 25.0% of their leaves senesced, 30.8% of the lines had very slight senescence, whereas 3.8% had 50.0% of their leaves senesced. The most senesced genotype was IS 7179R whereby harvesting time, 50% of the leaves were senesced. The majority of lines (65%) had white grain colour, 11% had creamy grains, while the remaining lines had red (8%), brown (8%) and light orange (8%) grains. In respect to seed size, most lines were medium size although lines SDS 6013R, SPL 38B, MZ 2R and IS 7179R were on average, large seeded. Panicle exsertion was mostly between 2 and 10 cm (42.3%), however, some had more than 10 cm (34.6%) and fewer exserted below 2 cm (23.1%) (Table 6).

Furthermore, midrib colour presented dull green colour in the majority of lines (53.8%), while white midrib colour was present in 42.3% of the lines and 3.8% were brown. Similar percentages were observed for leaf rolling characteristic, where 53.8% had their leaves rolled by 25%, 42.3% had non-rolled leaves, and 3.8% had leaves rolled by 50%. Likewise, regarding leaf orientation and colour, the majority of genotypes had dropping and dark green leaves (61.5%), whilst some had erect and light green leaves (38.5%).
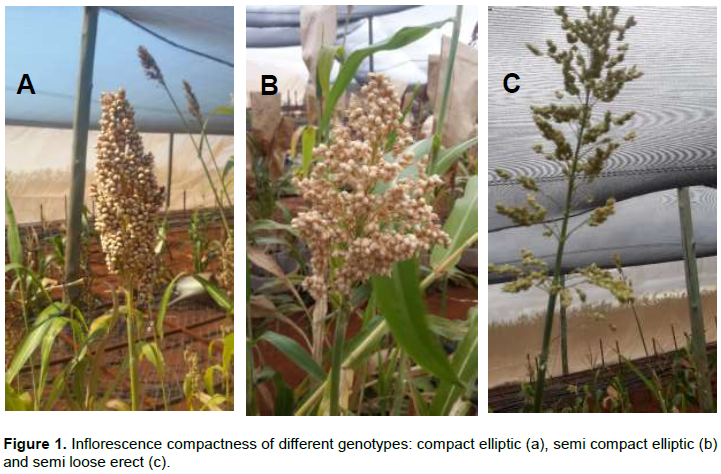
For inflorescence compactness (Figure 1 and Table 6), the compact elliptic form was the most abundant (46.2%), followed by the semi compact elliptic (26.9%), compact oval (15.4%), and semi loose dropping, semi loose erect and loose erect each with 3.8%. On the other hand, 42.3% of the lines had round shaped heads, followed by semi loose shape (38.5%) and oblong shape (19.2%). About 96.2% lines in this study had no awns whereas 3.8% displayed awns as observed in line IS 7179R. Furthermore, different glume colours and glume covering percentages were observed. Most of the lines displayed grey glume colour (73.1%) while other lines presented red glumes (11.5%), black glumes (7.7%) and brown glumes (7.7%). The grain glume covering was 25% for the majority (53.8%) of lines, and other lines (46.2%) had 50% covering (Table 6).
Cluster analysis
The results of cluster analysis are presented in Figure 2 (genotypes names in Table 1). Lines 8 (ICSA 21B), 23 (TX 623B), 22 (SPL 9B), 20 (SDS 6013R), 24 (TX 628B), 10 (IS 21458R), 16 (MZ 2R), 6 (ICSA 12B) and 5 (CK 60B) were grouped together (Cluster I). The second group (Cluster II) constituted lines 17 (MZ 30R), 7 (ICSA 19B), 14 (MA 6B) and 4 (A6352R). The third group (Cluster III) included lines 19 (SDS 260R), 15 (Macia), 11 (IS 7179R), 21 (SPL 38B), 12 (LARSVYT 19R), 18 (MZ 37R) and 2 (8607R). The fourth group (Cluster IV) comprised lines 25 (TX 630B), 13 (LARSVYT 46B), 26 (TX 631B), 9 (IS 14257R), 3 (8601B) and 1 (150B).

Cluster I contained the largest number of B and R lines from different groups, followed by cluster III which was made up of only R lines. Cluster IV grouped the majority of B lines and only one IS 14257R line. The least number of lines was found in cluster II.
Figure 2 shows cluster means for the various characters that were measured or observed. Cluster I had lines with an average of 105 days for 50% flowering. Average seed weight in this cluster was 18.6 g per thousand grains, with medium seed size and plants with 25% senesced leaves at harvesting maturity. Panicle exsertion was 2 to 10 cm with dark green and dropped leaves. The leaves were 25% rolled and midrib colour was dull green. The head was round, semi compact elliptic inflorescence, awn less with white grains. The grains were 25% covered with purple glumes.
Cluster II contained lines with the longest duration to 50% flowering. The lines had an average of 114 days for flowering days and mean of 18.1 g for thousand seed weight. The stay green character rating was on average 25% leaves senesced at harvesting maturity. Seed size was medium and panicle was exserted between 2 and 10 cm. Additional characters included non-rolling and erect leaves with a dull green midrib. The leaves were dark green and inflorescence compactness was the semi compact elliptic category. Head shape was on average round with white grains, awn less with purple glumes covering 25% of the grain (Table 7).
Days from planting to 50% flowering averaged 97 in cluster III and plants produced medium sized seed weighing on average 17.9 g per thousand grains. The plants stayed green until harvesting maturity (25% senesced leaves) with dull green midrib and no rolling leaves, erect oriented and light green. The panicles were2 to 10 cm exserted with semi compact elliptic inflorescence that was round in shape. The grains were white with no awns but covered 25% with black glumes (Table 7).

Cluster IV consisted of early flowering group with an average of 86 days to 50% flowering. The size of seeds was medium with an average weight of 18.1 g per thousand grains and plants having 25% senesced leaves at harvesting maturity. The leaves were light green, 25% rolled, dropped with a dull green midrib. The panicles were exserted 2 to 10 cm with round and compact elliptic inflorescence, and awn less. The grains were light orange and covered 50% with grey glumes (Table 7).
Principal component analysis
The PCA analysis showed that 58.5% of the total variation was accounted for by five components (Table 8) and the first component had the major contribution of 15% to the variation. Variation in the first component was mainly from the positive eigenvector loadings of head shape, days to 50% flowering and negative loadings of leaf colour, leaf orientation and inflorescence compactness. The second component contributed 13% to the variation mainly from the positive loadings of head shape, panicle exsertion, midrib colour, glume colour and negative loadings of leaf rolling and inflorescence compactness (Figure 3).

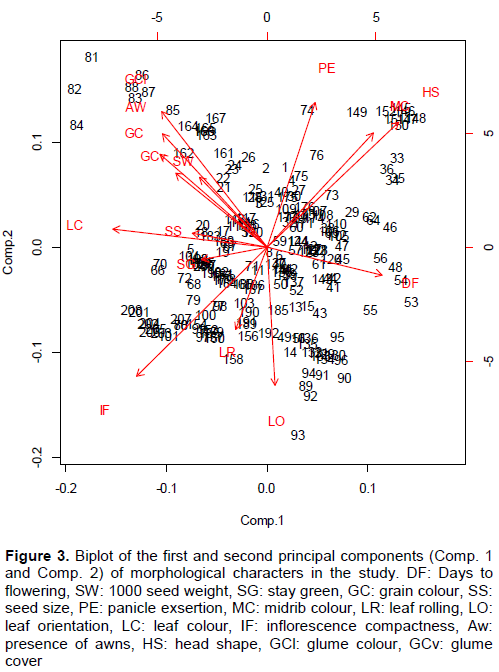
The variation in the third component (12.2%) was due to positive loadings of midrib colour, grain colour and days to 50% flowering while the negative eigenvector loadings were due to stay green and presence of awns. Positive loadings of days to 50% flowering and the thousand-seed weight contributed 9.5% to the total variation of the fourth component with high negative loadings of seed size. The fifth component variation (7.9%) was due to positive loadings of glume colour, glume cover and negative loadings of inflorescence compactness and leaf colour (Table 8).
The characters such as head shape, midrib colour, panicle exsertion, glume colour, presence of awns, grain colour, glume cover, and thousand seed weight were positively correlated. Negative correlations were found between the characters days to 50% flowering, leaf colour, seed size, stay green, grain colour, thousand seed weight, awn presence, glume colour and inflorescence compactness (Figure 3). A strong positive correlation was found between the characters glume cover, glume colour, presence of awns and thousand seed weight. On the other hand, there was a strong positive correlation between the characters head shape, midrib colour and panicle exsertion. A strong negative correlation was found between inflorescence compactness, head shape, midrib colour and panicle exsertion. The negative correlations were found between the characters head shape and inflorescence com-pactness as well as between the days to 50% flowering and seed size.
Diversity index
The Shannon diversity index (H’) was estimated to compare the morphological characters used in the study (Table 5). The mean of Shannon diversity index of the characters was 3.22. The H’ of stay green, panicle exsertion, midrib colour, leaf rolling, leaf orientation, glume colour, glume cover and grain colour were on par with the mean. Days to 50% flowering, thousand seed weight, seed size, leaf colour, inflorescence compactness, head shape and presence of awns were found to have H’ greater than mean. The last seven characters showed high diversity when compared with the first eight characters (Table 5).
DISCUSSION
The flowering period among genotypes was almost a month and this might be attributed to a mixture of genotypes with different genetic backgrounds and different responses to environmental conditions. A study by Craufurd and Peacock (1993) characterised genotypes on responses to temperature and photoperiod, and they found that variation in flowering period was affected by photoperiod and environment adaptation. Other author found sorghum genotypes that are insensitive during winter in India (Shinde et al., 2013). Water stress also has an influence on days to flowering in as much as it increased the period between panicle initiation and flowering by retarding the rate of panicle development (Craufurd et al., 1993; Zelalem et al., 2015). The uncertain rainfall across seasons and differences in planting dates showed difference in flowering and maturity period for the genotypes. This showed the importance of planting at the beginning of January in Southern Africa particularly Central Mozambique.
The seed size in this study was mostly medium size although some lines had large seeds. The fact that most of the genotypes were medium sized imply lack of variation in seed size. There is, therefore, no evidence in this study to suggest that seed weight was influenced by seed size. Seed weight has been reported to be positively correlated to seed size and yield (Evans and Bhatt, 1977; Ezeaku and Mohammed, 2006). Seed size may be considered as an important factor when selecting seed due to plasticity associated with the seed to complete different growth stages (Sadras, 2007) and also associated to seed weight, are important elements of yield (Tao et al., 2017).
As far as leaf orientation and leaf rolling are concerned, the majority of lines had dropped orientation and rolled leaves. These characteristics might be influenced by a short period of drought during the growth season. Sorghum shows different mechanism to tolerant drought and water use during dry periods (Roby, 2016). Water deficit, high air temperature and sunlight affect leaf rolling in plants (Kadioglu and Terzi, 2007). Regarding the stay green character, 65.4% of the lines had low levels of senescence (25% of their leaves senesced) under optimal growing conditions. Additionally, Burke et al. (2010) found that the best way to identify stay green line (BTx642) is to evaluate in well-watered environments. However, stay green trait could be affected by pre-flowering or post-flowering drought stress (Burke et al., 2013). The stay green trait is an important component when breeding for drought tolerant crop and photosynthesis components (Thomas and Smart, 1993).
It also improves adaptation to drought and respond to yield under different agro-ecological conditions of sorghum (Borrell et al., 2000; Borrel et al., 2014). The majority of grain exhibited white colour and it was observed as one of the preferred characteristics by farmers in a PRA study (Mulima, unpublished). White grain colour was indicated by farmers to be associated with preferences of porridge colour and taste (Vom Brocke et al., 2010). Seed size and seed colour are the important traits to farmers during variety selection (Odendo et al., 2001). Although, the difference among their germplasm is small due to frequent seed exchange among farmers (Desmae et al., 2016). Therefore, selection of a variety has to meet specific farmer requirements in order to cater for local food industrial requirements as preferred by the final consumer (Dicko et al., 2006).
Inflorescence compactness was dominated by the compact elliptic type with round head shape. The inflorescence structure is an essential element for breeders due to the contribution of it to the yield, stability and quality of the grain (Brown et al., 2006). Additionally, it was observed that most lines had no awns and seed were covered 25% by grey glume. The presence of strong awns in the seed may be used as a protection against bird’s attack. According to Upadhyaya et al. (2010), glume cover and glume colour may be utilized for screening grain mould resistance. Panicle compactness is used as a racial indicator and it is influenced not only by a number of branches and elongation but also by abortions in a branch (Brown et al., 2006; Wang et al., 2015).
Variability and heritability of the characters
The phenotypic variance was higher than the genotypic variance for all characters. Higher phenotypic estimates were observed for days to 50% flowering, thousand seed weight glume colour and inflorescence compactness. The other characters such as stay green, seed size, leaf rolling, leaf colour and glume cover presented lower estimates. The phenotypic expression could be influenced by rainfall and temperature difference between the seasons as recorded with 522 mm during 2016 and 989 mm in 2017. Similar findings from Chikuta et al. (2015) and Ayana et al. (2000) indicate that gradient of rainfall, temperature and growing sites are important for genotype variation. The phenotypic expression can infer genetic variability and consequences of phenotypic variation due to changes in the environment (Abubakar and Bubuche, 2013). Contrary, Seetharam and Ganesamurthy (2013) found that a narrow difference between the phenotypic and genetic variation are an indication of little environmental influence. Variability in characters such as stay green, leaf rolling, and leaf orientation implies that the traits can be used to exploit drought tolerance. An extensive collection of genetic variability can be used in the improvement of drought tolerance in grain sorghum (Abdalla, 2014; Idris et al., 2015). Yazici and Bilir (2017) reported that there could be many environmental factors in the variability.
High heritability estimates were obtained for stay green, midrib colour, glume cover and leaf orientation. The characters such as thousand seed weight and presence of awns had heritability estimates below 50%. The low heritability estimates have implication in breeding because phenotypic selection cannot be based on those traits with low heritability values. Similar results of low heritability were observed in sorghum for ear head length and breadth (Arunkumar, 2013). According to Bello et al. (2007), traits that are related to grain yield and yield components might have low heritability due to direct or indirect effects of the several components while Obilana and Fakorede (1981) described that heritability estimates tend to be low for the traits that are influenced by environment (quantitative traits).
It is said that the characters with higher heritability estimates may reflect the utility of the characters in a breeding strategy. This result is in agreement with Warkad et al. (2008) who observed low heritability estimates for grain and fodder yield, thousand seed weight and presence of awns in sorghum. Similar results were obtained by Seetharam and Ganesamurthy (2013) for 50% flowering and Liang et al. (1972) for 50% flowering, plant height and seed weight. The inflorescence has higher heritability in the primary branch than secondary and tertiary branches (Brown et al., 2006). High heritability suggests that the main genes for those characters may have an additive gene effect and consequently indicate the importance of those characters for selection.
Cluster analysis
Cluster analysis was able to group the lines according to flowering period, with cluster II having members taking longest time to flowering; clusters I and III were intermediate flowering groups and cluster IV was the earliest to flower. This grouping revealed that information about flowering period among the lines may be useful in order to identify parents for different maturity groups. The success of any crop breeding programme is based on the knowledge and availability of genetic variability for efficient selection (Ali et al., 2008). The characters, thousand seed weight, stay green, seed size, panicle exsertion, midrib colour, head shape and presence of awns showed similar characteristics in all clusters. Characters such as leaf rolling, leaf orientation, leaf colour, inflorescence compactness, glume covering, glume colour and grain colour were the most distinguishing traits between the clusters. Leaf rolling and leaf orientation were clustered in the same pattern in clusters I and IV as well as II and III. The clusters that were paired together were I and II, III and IV for leaf colour. Inflorescence compactness, glume cover and grain colour clustered together I, II and III. Grouping the genotypes according to the characteristics might reveal that the lines have similarity in one or more traits. Seetharam and Ganesamurthy (2013) reported that promising genotypes can be identified from cluster means recorded for each trait. A better understanding of genetics of morphological characteristics is required by the breeder to increase the efficiency of selection of more diverse and adapted parents for crop improvement (Billot et al., 2013). These clusters suggested that there is a large amount of allelic diversity in the germplasm in this study, assuming that it could be divided into four groups.
Principal component analysis
In the first component, maximum weight should be given to the traits with high magnitude and positive eigenvector loadings, namely head shape and days to 50% flowering and traits with high magnitude negative loadings viz. leaf colour, leaf orientation and inflorescence compactness. In a separate study, days to 50% flowering was found as one of the most important characters contributing to the first principal component (Ayana and Bekele, 1999; Jain and Patel, 2016), hence its importance has been confirmed in this study. The second principal component explained 13.9% of the variation and in this component maximum importance should be attached to traits with high positive loadings specifically head shape, panicle exsertion, midrib colour and glume colour and those with high magnitude negative loadings viz. leaf rolling and inflorescence compactness. In the third component, maximum importance should be attached to traits with high positive loadings, namely, midrib colour, grain colour and days to 50% flowering; and those traits with high negative loadings, that is, stay green and presence of awns. The traits, days to 50% flowering and the thousand seed weight (with positive loadings), and stay green, panicle exsertion and seed size (with negative loadings) should be given maximum importance in the fourth principal component. Ayana and Bekele (1999) also observed that thousand seed weight was one of the important traits in the fourth principal component. In the fifth component, maximum weight should be attached to with positive loadings, namely, leaf colour, glume colour and glume cover and those with negative loadings, specifically, inflorescence compactness and leaf colour. The dull green midrib colour and dark green leaf colour were suggested to be associated with pithy stems meaning juicy stems (Ngugi and Maswili, 2010) while days to 50% flowering was found to be strongly correlated with 95% maturity (El Naim et al., 2012).
Positive strong correlation was found between the characters glume cover and glume colour, presence of awns and thousand seed weight. Also, there was a strong positive correlation between the characters head shape, midrib colour and panicle exsertion. The negative strong correlation was found between inflorescence compactness, head shape, panicle exsertion and midrib colour. The opposite correlations (positive) were found between the characters head shape and inflorescence compactness as well as between the days to 50% flowering and seed size. These results aligned with PCA result, whereby the positively correlated characters are the same with positive contribution under PCA. These results showed that there is a correlation between some morphological characters measured in the study. Tesfamichael et al. (2015) reported agronomic scores to be positive correlated to stay green, grain yield and harvest index while days to 50% flowering, maturity and panicle length are negative correlated. Additionally, the negatively correlated characters were also similar to PCA result. This suggested that those characters should be taken into consideration when doing the selection for crop improvement. Grouping morphologically similar germplasm is useful for selecting parents for crossing (Ayana and Bekele, 1999; Iannucci et al., 2011) and evaluating the F1. According to Rahim et al. (2010), F1 hybrids from genotypes with maximum distance result in high yield, achieving maximum heterosis.
Diversity index
The Shannon diversity index (H’) values for stay green, panicle exsertion, midrib colour, leaf rolling, leaf orientation, glume colour, glume cover and grain colour were on par with the mean. This indicated that the traits were less diverse. Days to 50% flowering, thousand seed weight, seed size, leaf colour, inflorescence compactness, head shape and presence of awns were found to have H’ greater than mean. A low H’ shows lack of genetic diversity and an extremely unbalanced frequency classes for an individual trait (Upadhyaya et al., 2010). Highly diverse genotypes are important in a breeding programme as they may be useful in predicting the potential of hybrid progenies when combined with other genotypes (Seetharam and Ganesamurthy, 2013). Additionally, it would be interesting and fruitful to see the extent of segregation for different traits generated by those crosses (Upadhyaya et al., 2010). This results showed to be relevant for grouping the germplasm according to their similarity and it might be influenced by the characters under evaluation and environment used.
CONCLUSION
The results of the Mozambican sorghum germplasm diversity study have provided important information that is useful in improvement of the genotypes. The traits that are not strongly related could be exploited in recombination breeding in future. The multivariate analyses clearly showed the grouping of the genotypes according to the characters outlined in the study. Diversity index additionally confirmed the diversity in the traits which can be used in hybridization. Therefore, these results have implications in selection of parents for use in sorghum improvement programme. For example, genotypes that are early in maturity, 150B, IS 14257R, LARSVYT 46B, TX 631B, TX 630B and 8601B could be used for improving earliness, while for late maturity genotypes MA 6B, A 6352R, ICSA 19B and MZ 30R could be used when late cultivars are desired. Moreover, grain yield can be increased using genotypes that produce seed with good weight such as IS 7179R, SPL 9B and A 6353R and those associated with large seed size as observed in lines SPL 38B, SDS 6013R and MZ 2R. On the other hand, lines ICSA 21B, 8610B, MZ 37R, 150B and MZ 2R can be exploited for drought tolerance variety deployment due to the intense stay green character. The line IS 7179R can be used for hybridization to reduce the bird attack due to the presence of awns. Additionally, for mould resistance, lines 8601B and TX 630B can be used. Morphological characteristics identified will assist breeders in understanding the importance of the germplasm diversity, and also help identify important characters that are highly preferred by farmers such as earliness, grain yield, plant height and grain colour.
CONFLICT OF INTERESTS
The authors have not declared any conflict of interests.
REFERENCES
|
Abdalla IIE (2014) Genetic variability and phenotypic correlation between growth and yield characters in some grain sorghum (Sorghum bicolor L. Moench) genotypes under stress conditions, Sudan University of Science and Technology, MSc thesis. |
|
|
Abubakar L, Bubuche T (2013). Genotype environment interaction on biomass production in sorghum (Sorghum bicolor L. Moench) in North-Western Nigeria. African Journal of Agricultural Research 8:4460-4465. |
|
|
Ali M, Rajewski J, Baenziger P, Gill K, Eskridge K, Dweikat I (2008). Assessment of genetic diversity and relationship among a collection of US sweet sorghum germplasm by SSR markers. Molecular Breeding 21:497-509. |
|
|
Anderberg M.R. (2014). Cluster analysis for applications: probability and mathematical statistics: a series of monographs and textbooks Academic press. |
|
|
Arunkumar B (2013). Genetic variability, character association and path analysis studies in sorghum (Sorghum bicolor (L) Moench). The Bioscan 8:1485-1488. |
|
|
Ayana A, Bekele E (1999) Multivariate analysis of morphological variation in sorghum (Sorghum bicolor (L.) Moench) germplasm from Ethiopia and Eritrea. Genetic Resources and Crop Evolution 46:273-284. |
|
|
Ayana A, Bryngelsson T, Bekele E (2000). Genetic variation of Ethiopian and Eritrean sorghum (Sorghum bicolor (L.) Moench) germplasm assessed by random amplified polymorphic DNA (RAPD). Genetic Resources and Crop Evolution 47:471-482. |
|
|
Bello D, Kadams A, Simon S, Mashi D (2007) Studies on genetic variability in cultivated sorghum (Sorghum bicolor L. Moench) cultivars of Adamawa State Nigeria. American-Euriasian Journal Agricultural and Enviroment Science 2:297-302. |
|
|
Bias C, Freire M, Mutondo J, Mlay G, Mazuze F, Tostão E, Amane M, Chiconela T, Amilai C, Ecole C, Falcão M, Zacarias A, Cumbe C (2010). Fichas técnicas de culturas. Instituto de Ivestigação Agrária de Moçambique e Faculdade de Agronomia e Engenharia Florestal 247 p |
|
|
Billot C, Ramu P, Bouchet S, Chantereau J, Deu M, Gardes L, Noyer JL, Rami JF, Rivallan R, Li Y (2013). Massive sorghum collection genotyped with SSR markers to enhance use of global genetic resources PloS one 8:e59714. |
|
|
Borrell AK, Hammer GL, Douglas AC (2000) Does maintaining green leaf area in sorghum improve yield under drought? I. Leaf growth and senescence Crop Science 40:1026-1037. |
|
|
Borrell AK, Mullet JE, Jaeggli BG, Van OEJ, Hammer GL, Klein PE, Jordan DR (2014). Drought adaptation of stay-green sorghum is associated with canopy development, leaf anatomy, root growth, and water uptake. Journal of Experimental Botany 65(21):6251-6263. |
|
|
Brown P, Klein P, Bortiri E, Acharya C, Rooney W, Kresovich S (2006). Inheritance of inflorescence architecture in sorghum. Theoretical and Applied Genetics 113:931-942. |
|
|
Burke J, Franks C, Burow G, Xin Z (2010). Selection system for the stay-green drought tolerance trait in sorghum germplasm. Agronomy Journal 102:1118-1122. |
|
|
Burke JJ, Chen J, Burow G, Mechref Y, Rosenow D, Payton P, Xin Z, Hayes CM (2013). Leaf dhurrin content is a quantitative measure of the level of pre-and post-flowering drought tolerance in Sorghum. Crop Science 53:1056-1065. |
|
|
Chikuta S, Odong T, Kabi F, Rubaihayo P (2015) Phenotypic diversity of selected dual purpose forage and grain sorghum genotypes. American Journal of Experimental Agriculture 9:1-9. |
|
|
Craufurd P, Peacock J (1993) Effect of heat and drought stress on sorghum (Sorghum bicolor L. Moench). II. Grain yield. Experimental Agriculture 29:77-86. |
|
|
Craufurd P, Flower D, Peacock J (1993). Effect of heat and drought stress on sorghum (Sorghum bicolor L. Moench). I. Panicle development and leaf appearance. Experimental Agriculture 29:61-76. |
|
|
Derksen D, Thomas A, Lafond G, Loeppky H, Swanton C (1995). Impact of postâ€emergence herbicides on weed community diversity within conservationâ€tillage systems. Weed Research 35:311-320. |
|
|
Desmae H, Jordan DR, Godwin ID (2016). Geographic patterns of phenotypic diversity in sorghum (Sorghum bicolor (L.) Moench) landraces from North Eastern Ethiopia. African Journal of Agricultural Research 11(33): 3111-3122 |
|
|
Dicko MH, Gruppen H, Traoré AS, Voragen AG, Van Berkel WJ (2006). Review: Sorghum grain as human food in Africa: relevance of starch content and amylase activities. African Journal of Biotechnology, 5:384-395. |
|
|
El Naim AM, Ibrahim IM, Rahman MEA, Ibrahim EA (2012). Evaluation of some local sorghum (Sorghum bicolor L. Moench) genotypes in rain-fed. International Journal of Plant Research 2:15-20. |
|
|
Evans L, Bhatt G (1977). Influence of seed size, protein content and cultivar on early seedling vigor in wheat. Canadian Journal of Plant Science 57:929-935. |
|
|
Ezeaku I, Mohammed S (2006). Character association and path analysis in grain sorghum. African Journal of Biotechnology 5:1337-1340. |
|
|
Fernandez MGS, Strand K, Hamblin M, Westgate M, Heaton E, Kresovich S (2014). Genetic analysis and phenotypic characterization of leaf photosynthetic capacity in a sorghum (Sorghum spp) diversity panel. Genetic Resources and Crop Evaluation |
|
|
Folkertsma RT, Rattunde HFW, Chandra S, Raju GS, Hash CT (2005). The pattern of genetic diversity of Guinea-race Sorghum bicolor (L.) Moench landraces as revealed with SSR markers. Theoretical and Applied Genetics 111:399-409. |
|
|
Geleta N., Labuschagne M. and Viljoen C (2006). Genetic diversity analysis in sorghum germplasm as estimated by AFLP, SSR and morpho-agronomical markers. Biodiversity and Conservation 15:3251-3265. |
|
|
Godbharle A, More A, Ambekar S (2010). Genetic variability and correlation studies in elite 'B'and 'R'lines in Kharif sorghum. Electronic Journal of Plant Breeding 1:989-993. |
|
|
Grenier C, Deu M, Kresovich S, Bramel-Cox PJ, Hamon P (2000). Assessment of genetic diversity in three subsets constituted from the ICRISAT sorghum collection using random vs non-random sampling procedures B. Using molecular markers. Theoretical and Applied Genetics 101:197-202. |
|
|
Harlan J, De Wet J (1972). A simplified classification of cultivated sorghum. Crop Science 12:172-176. |
|
|
House LR (1995). Sorghum: one of the world's great cereals. African Crop Science Journal 3(2):135-142. |
|
|
Iannucci A, Codianni P, Cattivelli L (2011). Evaluation of genotype diversity in oat germplasm and definition of ideotypes adapted to the Mediterranean environment. International Journal of Agronomy 20:1-9. |
|
|
Idris AE, Elmunsor II, Abuali AI (2015). Genetic variability of grain sorghum (Sorghum bicolor L. Moench) genotypes under drought stress conditions. Journal of Advances in Biology 7:1244-1248. |
|
|
International Board for Plant Genetic Resource (IBPGR) and International Crops Research Institute for the Semi-Arid Tropics (ICRISAT) (1993). Descriptors for Sorghum [Sorghum bicolor (L.) Moench], in: R. International Board for Plant Genetic Resources, Italy; International Crops Research Institute for the Semi-Arid Tropics, Patancheru, India (Ed.), ICRISAT, India. |
|
|
Jain SK, Patel PR (2016). Principal component and Cluster analysis in sorghum (Sorghum bicolor (L.) Moench). Forage Research Journal 42(2):90-95 |
|
|
Jost L (2007). Partitioning diversity into independent alpha and beta components. Ecology 88:2427-2439. |
|
|
Kadioglu A, Terzi R (2007). A dehydration avoidance mechanism: leaf rolling. The Botanical Review 73:290-302. |
|
|
Kumar AA, Reddy BVS, Thakur RP, Ramaiah B (2008). Improved sorghum hybrids with grain mould resistance. Journal of SAT Agricultural Research 6:1-4. |
|
|
Lacy SM, Cleveland DA, Soleri D (2006). Farmer choice of sorghum varieties in southern Mali. Human Ecology, 34:331-353. |
|
|
Liang G, Reddy C, Dayton A (1972). Heterosis, inbreeding depression, and heritability estimates in a systematic series of grain sorghum genotypes. Crop Science, 12:409-411. |
|
|
Mengesha MH (1975). Crop germplasm diversity resources of Ethiopia.In: Frankel, O.H. & J.G. Hawkes (Eds.), Crop Genetic Resources for Today and Tomorrow pp. 449-453.Cambridge University Press, Cambridge. |
|
|
Ministério da Administração Estatal (MAE) (2014). Perfil do Districto de Sussundenga, Província de Manica. Perfil do Districto, MAE, Maputo. |
|
|
Mujaju C, Chakauya E (2008). Morphological variation of sorghum landrace accessions on-farm in semi-arid areas of Zimbabwe. International Journal of Botany 4:376-382. |
|
|
Muraya MM (2014). Sorghum genetic diversity. Genetics, Genomics and Breeding of Sorghum 5:114-140. |
|
|
Ngugi K, Maswili R (2010).Phenotypic diversity in sorghum landraces from Kenya. African Crop Science Journal 18:165-173. |
|
|
Obilana AT, Fakorede M (1981). Heritability: A treatise. Samaru Journal of Agricultural Research 1:72-82. |
|
|
Odendo M, De Groote H, Odongo O (2001). Assessment of farmers' preferences and constraints to maize production in moist mid-altitude zone of Western Kenya, 5th International Conference of the African Crop Science Society, Lagos, Nigeria pp. 769-775. |
|
|
Payne R, Murray D, Harding S, Baird D, Soutar D (2016). GenStat for Windows. Introduction, 18th ed, VSN International: Hemel Hempstead, United Kingdom. |
|
|
Perry MC, McIntosh MS (1991). Geographic patterns of variation in the USDA soybean germplasm collection: I Morphological traits. Crop Science 31:1350-1355. |
|
|
R Team C (2014). R: A language and environment for statistical computing. Vienna, Austria: R Foundation for Statistical Computing; 2014. |
|
|
Rahim M, Mia A, Mahmud F, Zeba N, Afrin K (2010). Genetic variability, character association and genetic divergence in mungbean ('Vigna radiata'L. Wilczek). Plant Omics 3:1-6. |
|
|
Ramathani I, Biruma M, Martin T, Dixelius C, Okori P (2011). Disease severity, incidence and races of Setosphaeria turcica on sorghum in Uganda. European Journal of Plant Pathology 131:383-392. |
|
|
Reddy B, Kumar AA, Sharma HC, Rao PS, Blummel M, Reddy CR, Sharma R, Deshpande S, Saikat D, Dinakaran E (2012). Sorghum improvement (1980-2010): Status and way forward. An Open Access Journal published by ICRISAT 10:1-14. |
|
|
Roby M (2016). Biomass sorghum and maize have similar water-use-efficiency under non-drought conditions in the rain-fed, Midwest US. Iowa State University, Master thesis. |
|
|
Sadras VO (2007). Evolutionary aspects of the trade-off between seed size and number in crops. Field Crops Research 100:125-138. |
|
|
Seetharam K, Ganesamurthy K (2013). Research Note characterization of sorghum genotypes for yield and other agronomic traits through genetic variability and diversity analysis. Electronic Journal of Plant Breeding 4:1073-1079. |
|
|
Shinde MS, Mutkule BR, Gaikwad AR, Davi US, Gadakh SR (2013). Photoperiod sensitivity studies in sweet sorghum. Journal of Academia and Industrial Research 1(11):696-699. |
|
|
Statistical Analysis Software (SAS) (2011). Base SAS® 9.3 Procedures Guide [computer program], SAS Institute Inc; Cary, NC. |
|
|
Tao Y, Mace ES, Tai S, Cruickshank A, Campbell BC, Zhao X, Van Oosterom EJ, Godwin ID, Botella JR and Jordan DR (2017). Whole-Genome Analysis of Candidate genes Associated with Seed Size and Weight in Sorghum bicolor Reveals Signatures of Artificial Selection and Insights into Parallel Domestication in Cereal Crops. Frontiers in Plant Science 8:1237. |
|
|
Tesfamichael A, Githiri SM, Kasili R, Araia W, Nyende AB (2015). Genetic variation among sorghum (Sorghum bicolor L. Moench) Landrances from Eritrea under post-flowering drought stress conditions. American Journal of Plant Science 6:1410-1424 |
|
|
Thomas H, Smart CM (1993). Crops that stay green. Annals of Applied Biology 123:193-219. |
|
|
Upadhyaya H, Sharma S, Ramulu B, Bhattacharjee R, Gowda C, Reddy VG, Singh S (2010). Variation for qualitative and quantitative traits and identification of trait-specific sources in new sorghum germplasm. Crop and Pasture Science 61:609-618. |
|
|
Uttam GA, Praveen M, Rao YV, Tonapi VA, Madhusudhana R (2017). Molecular mapping and candidate gene analysis of a new epicuticular wax locus in sorghum (Sorghum bicolor L. Moench). Theoretical and Applied Genetics 130:2109-2125. |
|
|
Vom Brocke K, Trouche G, Weltzien E, Barro-Kondombo CP, Gozé E, Chantereau J (2010). Participatory variety development for sorghum in Burkina Faso: Farmers' selection and farmers' criteria. Field Crops Research 119:183-194. |
|
|
Wang Y, Upadhyaya H, Kole C (2015). Genetic, Genomica NS Breeding of Sorghum. Boca Raton: CRC Press 366 p. |
|
|
Warkad YN, Potdukhe NR, Dethe AM, Kahate PA, Kotgire RR (2008). Genetic variability, heritability and genetic advance for quantitative traits in sorghum germplasm. Agricultural Science Digest 28:165-169. |
|
|
Wheat Atlas (WA) (2018). Mozambique. Sussundenga. |
|
|
Yazici N, Bilir (2017). Aspectual fertility variation and its effect on gene diversity of seeds in Natural stands of Taurus Cedar (Cedrus libani A. Richi.). International Journal of Genomics 2960624:1-5 |
|
|
Yeung KY, Ruzzo WL (2001). Principal component analysis for clustering gene expression data. Bioinformatics 17:763-774. |
|
|
Zelalem G, Azamal H, Masresha F, Gietahum Y (2015). Growth, water status, physiological, biochemical and yield response of stay green sorghum (Sorghum bicolor L. Moench) varieties-A field trial under drought-prone area in Amhara regional stat, Ethiopia. Journal of Agronomy 14:188-202. |
|
Copyright © 2024 Author(s) retain the copyright of this article.
This article is published under the terms of the Creative Commons Attribution License 4.0


