ABSTRACT
The adjustment and evaluation of methods which allow estimation of runoff and the concentration of associated pesticides are important for the development of prognostics studies in agricultural areas, mainly in tropical regions. In this context, this study aimed to adjust a method to estimate the concentration of pesticides in run-off applied to a cotton plantation farm, located in the micro-region of Primavera do Leste – MT (Mato Grosso State) in Central-Western Brazil. The method was based on the association of the model of pesticides concentration in run-off, described by OECD (1999), with the methods of Curve Number (CN) and Water Balance on Soil Surface (BW) to estimate the run-off amount. The pesticides, diuron, alfa and beta endosulfan, metolachlor, were selected based on the frequency and applied amount in cotton crops. Among the studied pesticides, diuron was the one for whom the adjusted method performed better in the studied scenarios, in others words, the best performance of the SFIL for prediction the pesticides concentrations greater than 3 µg L-1. Thus the association of the OECD model to BW or CN performed well to predict the risk of surface waters contamination in cotton crop areas in tropical regions.
Key words: Modeling, contamination, surface waters, solute transport, tropical regions, agricultural areas.
Several authors have reported environmental models as methods to estimate pesticides concentrations in surface or groundwater (Leonard et al., 1987; Berezen et. al., 2005; Swarcewicz and Gregorczyk, 2013; Fantke et al., 2013). The evaluation of a chemical’s distribution and fate in the environment is an essential component of a risk assessment procedure (Pinho et al., 2006;
Swarcewicz and Gregorczyk, 2013).
Despite the existence of several studies of environmental models application in many countries, in Brazil they are scarce and recent (Plese et al., 2009). Many papers emphasize that in regions of Brazil where agricultural production is intensive, mainly in cotton farms areas, it is necessary to evaluate environmental dynamics of pesticides (Pinho et al., 2004; Please et al., 2009). In this context, environmental models are very useful tools, since their use allows the evaluation of pesticides dissipation in soil. This information can be used to propose measures to mitigate the environmental impacts. In addition, literature indicates that in tropical regions with cotton industry several pesticides have been detected in surface water and among the innumerous factors that affect pesticides runoff, the agricultural management system is a very important one (Carbo et al., 2008).
Moreover, many studies point out that there is high risk of the environmental contamination of some pesticides, such as, α and β-endosulfan, diuron and metolachlor (Weaver et al., 2012; Kennedy et al., 2001; Barrett and Jaward, 2012). In addition, literature indicates that in tropical regions with cotton industry several pesticides have been detected in surface water and among the innumerous factors that affect pesticides runoff, the agricultural management system is a very important one (Carbo et al., 2008; Casara et al., 2012). Hence, it is necessary to study the influence of the management systems in the dynamics of the pesticides in the environment
The present study, therefore, aimed to adjust a model by combination of the pesticide concentration model, reported by OECD (1999), with Runoff Curve Number (RCN) developed by the USDA Natural Resources Conservation Service (SCS-USDA), and the water balance in soil surface (WB) describe by Pruski et al. (1997) to estimate the concentrations of α- and β-endosulfan, diuron and metolachlor in runoff.
Investigation area
The experiment consisted of installing four monitoring units in two farms located in the micro-region of Primavera do Leste, Mato Grosso State, Central-Western Brazil, one farm situated near the riverside of Chico Nunes stream and another close to the riverside of Ilha stream, both tributaries of the Mortes River (Table 1).
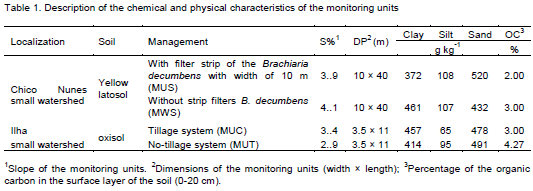
On the first farm, two units were installed to monitor runoff in cotton cultivated areas. In one of them, one filter strip planted with Bracchiaria grass was set up at the low end of the monitoring unit. On the second farm, two runoff monitoring units were installed in areas cultivated with cotton. In one, it was used the tillage system and in the other one, the no-tillage system. In the four units, a runoff collector was installed at the low end. These collectors were formed by a gutter linked to a polyvinyl chloride pipe. The structure of the collector was directed to the lower end of the experimental plot that consisted on a rectangular container (Figure 1), built from galvanized sheet, coated with a filtering system (geotextile blanket). In this container there was a “Geib” type divisor, with nine openings, and in the central opening it was linked to a water tank that stored the runoff volume that had passed by the 1/9 fraction on the Geib aluminum gutter.
Runoff samples were collected at intervals of approximately 15 to 20 days. Water and sediment samples were collected in 1 L amber bottle and plastic bags, respectively. Samples were transported in ice boxes to the laboratory where they were kept under refrigeration (4°C) until analysis.
The collection period, from December 2006 to May 2007, that coincides with the period of heaviest rains in the region and pesticides application. The precipitation rate was obtained by pulse pluviographs installed in each of the monitoring farms.
Water sampling and pesticide analysis
Analysis of pesticides residues by gas chromatography
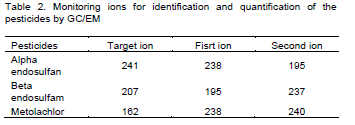
The residues of alfa and beta endosulfan and metolachlor in the water, were analysed using the method reported by Laabs et al. (2002) that used solid phase extraction with octadecilsylane (C18) cartridge (1000 mg) BakerbondTM, Mallinckrodt Baker, USA, previously conditioned with 10 ml of methanol and 10 ml of water, followed by elution with subsequent portions 10 ml of ethyl acetate, 10 ml of hexane: ethyl acetate (1:1) and 5 ml of hexane. The extract was concentrated in a rotary evaporator to near dryness and so transferred to an autosampler vial with toluene. A gas chromatograph HP-6890 with mass selective detector HP-5973 (Agilent GmbH, Germany), split/splitless injector, automatic sampler and a HP-5MS (5% phenylmethylsiloxane) column (30 m × 250 μm id × 0.25 μm phase thickness) was used for pesticide analysis. Pesticide residues were quantified by GC-MS operated in the selected ion monitoring mode at the following conditions: Injector block temperature: 250°C; carrier gas of helium (99,999% pure), gas flow of 1 ml min-1; split/splitless injector operated in splitless mode; injection volume of 1 ml; oven temperature program with initial temperature of 92°C held for 2.5 min, heating up to 175°C at 15°C min-1; 175°C held for 13 min, heating up to 280°C at 20°C min-1, 280°C held for 9 min; and transfer-line temperature at 290°C. Pesticides were identified by retention time and relative abundance of three major ions from mass spectra of each substance (Table 2). Maximum tolerance for confirmation was specified as 20% of relative ion intensity response.
Analysis of pesticides residues by liquid chromatographic
Diuron residues in water was analysed according to the method described by Carbo et al. (2008). Aliquots of 500 ml of the samples were extracted in a SDVB cartridge (Envi-Chrom P, Supelco) previously conditioned with methanol. Then, the cartridge was dried, leaving the vacuum pump on for 30 min. Diuron was eluted with 3 × 5 ml of methanol:acetonitrile 7:3 (v/v) at a flow-rate of about 1 ml min-1. The combined fractions were concentrated in a rotary evaporator (45°C) and the residue was redissolved in 1 ml of acetonitrile, followed by the addition of 50 µl of standard terbuthylazine solution (100 µg ml-1) to the vial.
The analysis was performed with a Varian HPLC system equipped with a 410 autosampler, a 240 quaternary pump and 330 UV diode-array detector linked to a personal computer running the software program Varian ProStar, version 5.5 (Varian, USA). The analytical column (250 mm × 4.6 mm I.D.) used here was an Omnisphere 5 µm C18, and the guard column (20 mm × 4.6 mm I.D.) was also an Omnisphere 5 µm C18. For the HPLC analysis, an aliquot (10 µl) was injected into the column and eluted at room temperature at a constant flow-rate of 1 ml min-1 under the following conditions.
The analyte was eluted with acetonitrile:water that in the initial composition is 18% acetonitrile, increasing to 40% at 6 min, 80% at 35 min, 90% at 40 min, and 100% acetonitrile at 45 min, when it was kept constant for 3 min and then linearly decreased to the initial analysis conditions in 10 min. The detection and quantification were performed at 230 nm. Diuron was identified by its retention time and identification was confirmed by comparison of its UV spectrum.
Balance water in the soil surface (WB)
The model of the water balance in the soil surface (Equation 1) assumes: uniform precipitation in the study area; soil moisture next to saturation and null evaporation since it is very small during rainfall.
ES = runoff, mm; PT = total precipitation, mm; Ia = initial abstractions, mm; I = cumulative infiltration, mm; ev = evaporation, mm.
The total precipitation (PT) was obtained by rain gauges installed in the experimental areas.
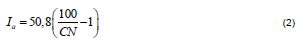
The initial abstractions (surface water until runoff start) depend on interception, depression storage and infiltration before of the runoff. The values of Ia were estimated by RCN (Equation 2), according to the Soil Conservation Service – SCS (1972):
CN = Curve Number
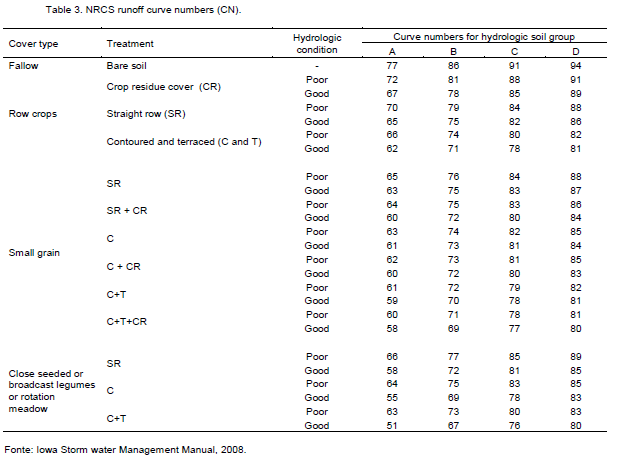
The values of CN were obtained by the method described on Soil Conservation Service (1972) (Table 3). According to Pruski et al. (1997), the hydrological conditions, in others words, the soil surface type can be considered:
1. Good condition: grass cover of 75% or more of the area;
2. Fair condition: grass cover of 50 to 75% of the area;
3. Poor condition: grass cover of 50% or less of the area.
The soil cover for the several scenarios of simulation was estimated from the post-emergence days and percentage of plant cover, according to Silva et al. (2004) (Equation 3):
Plant cover (%) = 46.07 ln(post-emergence days) -115.1; R2 = 0.962 (3)
From Equation (3), at the experimental conditions, it was determined that:
1. Until 36 post-emergence days, 50% of the plant cover, bad condition.
2. From 36 post-emergence days and on, 75% of plant covers, good condition.
The cover type and treatment of surface soil observed in Table 3 for several scenarios of the simulation are briefly described as follows:
(i) The treatment considered in experimental areas was small grain; (ii) The area with butter strip was considered straight row with contoured and terraces and (iii) other experimental areas were considered only contoured.
The soil properties (Table 1) most similar to that of the experimental area were C type: Low infiltration rate when thoroughly moist, layer impediment and with considerable percentage of clay.
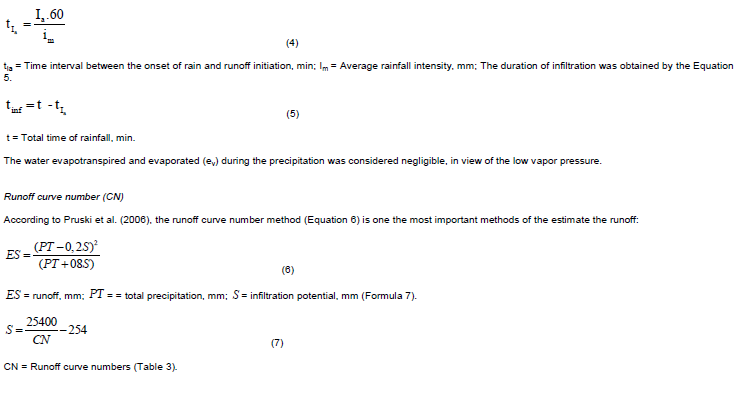
The corresponding time for occurrence of the initial abstractions was obtained by the Equation 4:
Prediction of pesticide concentrations
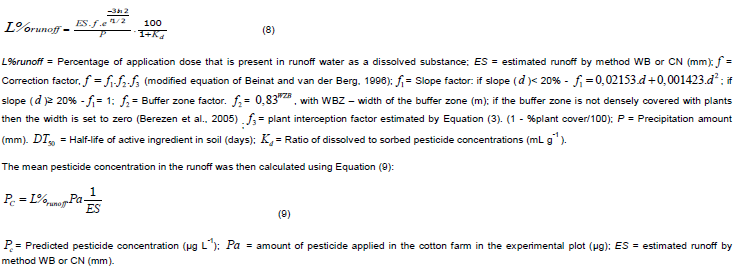
The model for the prediction of pesticide concentrations (Equations 8 and 9) was adapted based on the ones described in the Project ‘‘Pesticide Aquatic Risk Indicator” by OECD (1999), and on that reported by Berenzen et al. (2005).
The model assumes that:
1. The rainfall takes place 3 days after pesticides application (OECD, 1999; Berenzen et al., 2005)
2. Due to the fact that the model was calibrated under field conditions, we considered that there was enough time for pesticide equilibration between the solid and liquid phase of the soil.
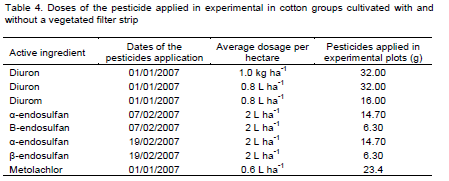
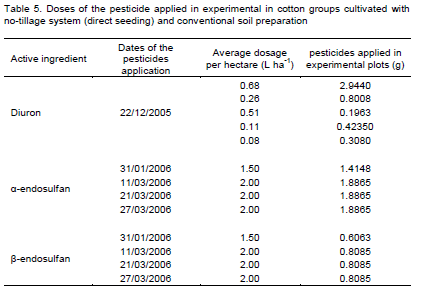
Tables 4 and 5 show the doses of the pesticide applied in the experimental plots under field conditions, in cotton areas cultivated under different management systems: with and without a vegetated filter strip (buffer filter) planted with Bracchiaria grass and no-tillage system (direct seeding) and conventional soil preparation.
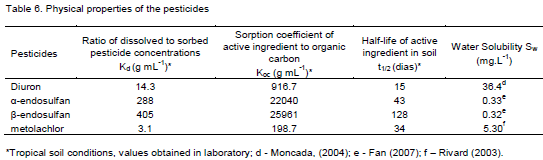
The physical properties of the pesticides that were used for the prediction in the model are shown in Table 6. They were obtained for tropical soil conditions, aiming to improve the model performance.
Estimated runoff by curve number (RCN) and water balance in the soil surface (WB)
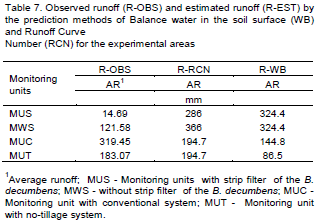
The runoff depth estimated by Curve Number (RCN) (Table 7) was higher than the observed values in all units with exception of the monitoring unit with conventional system (MUC). These overestimated values were less significant in the unit with no-tillage system (MUT). As for the Water Balance in the Soil Surface method (WB), an overestimation in runoff was observed for the units with and without filter strip of the Brachiaria decumbens. On the other words, for the MUC and MUT units, an underestimation was observed, with a higher runoff depth in the MUC in relation to the MUT unit (Table 7).
Therefore, the WB method represented better the effect of culture systems.
Comparison of the prediction with measured data
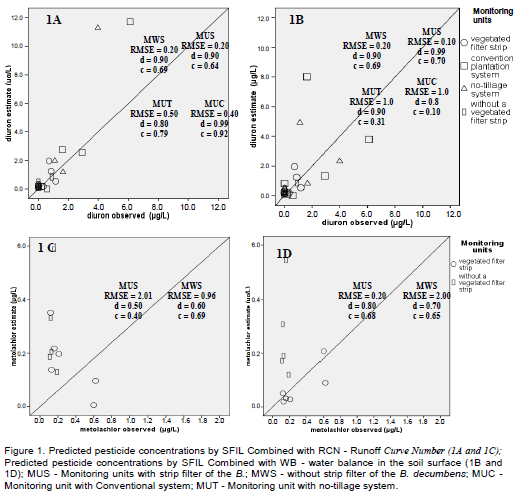
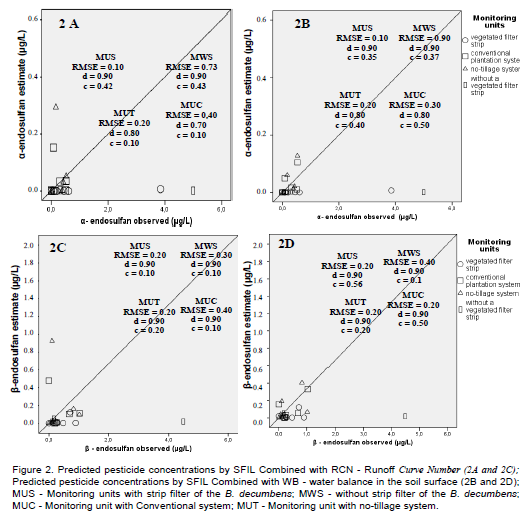
In Figure 1A, the relationship between pesticide concentration predicted by the SFIL model associated with RCN or WB and measured diuron concentrations is shown. A greater dispersion of predicted diuron concentrations was observed in the different evaluated scenarios when RCN for runoff prediction was used. In general, there was a predominance of underestimation of diuron concentrations in the monitoring unit with strip filter of the B. decumbens, regardless of the methodology used to runoff prediction. It was also observed that there were overestimated and underestimated concentrations for α-endosulfan when the SFIL was combined with RCN or WB (Figure 2). Differently, as for β-endosulfan (Figure 2) an underestimation tendency of the concentration predicted by SFIL for all evaluated scenarios was observed in both methods for runoff prediction. Among the studied pesticides, metolachlor was the pesticide that showed the most overestimation tendency for the concentrations predicted by SFIL combined with RCN or WB (Figure 1C and D).
Statistical analyses
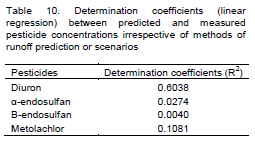
The relationship between predicted pesticides concentrations by SFIL with different methods of runoff prediction (Table 8) or scenarios (Table 9) and measured pesticide concentrations was analyzed using Student's t-test when it was possible to get normal distribution. For the variables that that were not normally distributed, the non-parametric test of Wilcoxon was used. For all statistical analyses the software SPSS 15.0 was used. Moreover, it was evaluated the determination coefficients (R2) between predicted and observed pesticides concentrations irrespective of methods of runoff prediction or scenarios (Table 10)
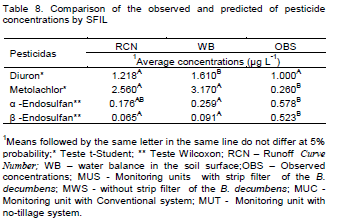
No significant differences between observed and predicted pesticide average concentrations by SFIL combined with RCN method for diuron and α-endosulfan were observed (Table 8). In addition, there were no significant differences between predicted pesticide average concentrations by SFIL combined with RCN and WB for metolachlor, α and β endosulfan, however, both of it were statistically different than experimentally observed values (Table 8).
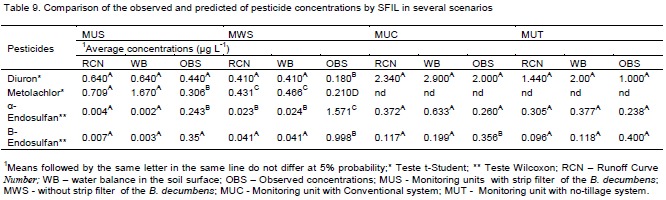
The average concentrations of diuron predicted by SFIL combined with RCN method, with exception of the monitoring unit without strip filters B. decumbens (MWS), were not statistically different than experimentally observed values (Table 9). In relation to α-endosulfan, the predicted average concentrations in the monitoring units with and without filter strip of the B. decumbens (MUS and MWS) were statistically different, when the SFIL was combined with RCN method. Regarding β-endosulfan, in the MWS and MUC the predicted average concentrations were statistically different when compared to observed concentrations (Table 9).
Prediction of runoff
The monitoring units with and without a 10-m filter strip of B. decumbens (MUS and MWS) in cotton farm showed overestimation of the runoff by RCN or WB methods, nevertheless in relation the estimated runoff by RCN it was observed lesser values of estimated runoff for MUS when compared with MWS as well as also it was verified to observed runoff (Table 7), probably due to the higher basic infiltration rate (TIB) in the MUS than in the MWS. The presence of roots in the soil provide higher infiltration rate, moreover, the high surface roughness provided by vegetation reduces the runoff velocity, increasing hydraulic load, consequently providing the higher water infiltration. The predicted runoff by RCN or WB did not consider the different infiltration in the area with filter strip of B. decumbens.
Regarding the monitoring units with conventional system (MUC) and no-tillage system (MUT) an overestimation of the runoff was observed, nevertheless, the WB method performed better to describe the effect of the cultivation system in the MUC and MUT. In other words, in the MUC the predicted runoff was greater than in the MUT. This higher runoff values, both estimated and observed of the conventional system compared to no-tillage, is probably due to increasing soil sealing and consequent TIB decreasing caused by this management system (SCHICK et al., 2000).
Measurements of pesticide concentrations
The predicted diuron concentrations observed by SFIL combined with WB method showed Willmott index (d) described by Willmott et al. (1985) ranging from 0.99 to 0.80 (Figure 1A). The Willmott index indicates the degree of accuracy between the observed and predicted values. The Root Mean Square Error ranged from 0.2 to 0.5 (RMSE) (Figure 1A). According to Chung et al. (1999) these values of RMSE (0.2 to 0.5) are ??considered satisfactory. The performance of the SFIL was evaluated by performance index (c) (Camargo et al., 1997). The values of “c” ranged from medium (0.64) to optimum (0.9) (Figure 1). In relation to predicted diuron concentrations determined by SFIL combined with RCN, the “c” values ranged from 0.1 to 0.7 (Figure1 B) respectively, bad and good performance according to Camargo et al. (1997). The RMSE values were lower than 0.5 for MUS and MWS, however, in the MUC and MUT these values were higher, considered satisfactory and unsatisfactory, according to Chung et al. (1999).
For metolachlor, RMSE ranged from 0.2 to 2.00 (Figure 1C and D) values which are considered satisfactory and unsatisfactory, respectively, according to Chung et al. (1999). Moreover, when SFIL was combined with WB, the model performance can be considered bad (MUS) and good (MWS), but when SFIL was combined with RCN the model performance changed to medium (MUS) and good (MWS).
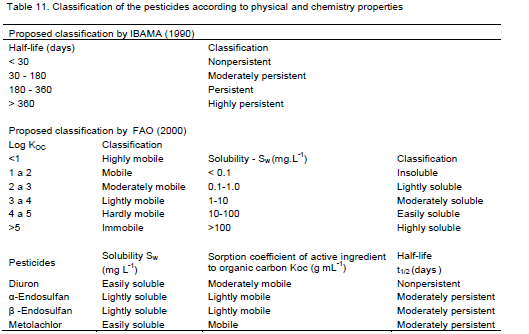
In addition, considering the mobility and solubility parameters shown in Table 10 according to FAO (2000) and persistence according to IBAMA (1990), it was observed that diuron and metolachlor (Table 11) are the most likely to suffer leaching compared to α- and β-endosulfan. In the SFIL model, leaching was not considered thus the overestimation of the predicted concentrations for these pesticides may be due to absence of leaching calculations by SFIL.
The SFIL model showed the worst performance for α- and β- endosulfan, with “c” values classified as too bad (0.1) and tolerable (0.5) (Figure 2). The RMSE ranged from 0.1 to 0.9 (Figure 2), and the Willmott index showed values close to one.
The Table 10 shows that there was an better relationships (linear regression) between predicted and measured pesticide concentrations for diuron (R2= 0.6038) than for others pesticides. From above results it can be inferred that the better performace of the SFIL is for high values pesticides concentrations as observed to diuron (Figure 1A and B), corroborates with Berezen et al. (2005) that reported the better performance of the SFIL in estimate concentration above 5 μg L-1.
In summary, the SFIL model showed a good potential of the predict the pesticide concentrations in runoff when combined with the Runoff Curve Number or water balance in the soil surface method, mainly high values of pesticides concentrations as observed to diuron. In addition the SFIL model was efficient in predict the impact of the management systems on the pesticides concentrations in several scenarios, mostly in scenarios where there were strip filters.
The authors have not declared any conflict of interest.
REFERENCES
Barrett K, Jaward FM (2012). A review of endosulfan, dichlorvos, diazinon, and diuron – pesticides used in Jamaica, Int. J. Environ.Health Res. 22:481-499.
Crossref |
|
|
Berezen N, Lentzen-Godding A, Probst M, Schulz H, Schulz R, Liess M. A (2005). Comparison of predicted and measured levels of runoff-related pesticide Concentrations in small lowland streams na as landscape level. Chemosphere 58: 683-691.
Crossref
|
|
|
|
Beinat E, Van der Berg R (1996). EUPHIDS, a decision support system for admission of pesticides. National Institute of Public Health and the Environment, Bilthoven. |
|
|
|
Camargo AP, Sentelhas PC (1997). Avaliação do desempenho de diferentes métodos de estimativas de evapotranspiração potencial no Estado de São Paulo, Brasil. Revista Brasileira de Agrometeorologia 5: 89-97. |
|
|
Carbo L, Souza V, Dores EFGC, Ribeiro ML (2008). Determination of pesticides multiresidues in shallow groundwater in a cotton-growing region of Mato Grosso, J. Braz. Chem. Soc. 19: 1111-1117.
Crossref |
|
|
|
|
|
Chung SW, Gassman PW, Kramer LA, Williams JR, Gu R (1999).Validation of EPIC for Two Watersheds in Southwest. Center for Agricultural and Rural Development Iowa State University Ames, IA, 50011-1070. |
|
|
|
Fan S (2007). Endosulfan risk characterization document. Volume III Environmental Fate -Department of Pesticide Regulation Environmental Monitoring Branch,Sacramento, Califórnia.
View
|
|
|
Fantke P, Wieland P, Wannaz C, Friedrich R, Jolliet O (2013). Dynamics of pesticide uptake into plants: From system functioning to parsimonious modeling. Environmental Modelling & Software 40: 316-324.
Crossref |
|
|
|
FAO (2000). Food and Agriculture Organization of the United Nations. Assessing soil contamination. |
|
|
|
IBAMA - Brazilian Institute of the Environment (1990). Pesticides manual for evaluation of the ecotoxicity of chemical agents 2:80-90. |
|
|
|
Iowa Storm water Management Manual (2008).
View
|
|
|
Laabs V, Amelung W, Pinto A, Wantzen M, Silva CJ, Zech W (2002). Pesticides in surface water, sediment, and rainfall of the Northeastern Pantanal Basin, Brazil. J. Environ. Q. 31:1636–1648.
Crossref |
|
|
Kennedy IR, Sanchez-Bayo F, Kimber SW, Hugo L, Ahmad N (2001). Off-Site movement of Endosulfan from irrigated cotton in New South Wales. J. Environ. Q. 30:683–696.
Crossref |
|
|
Leonard RA, Knisel WG, Still DA (1987). GLEAMS:Groundwater Loading Effects of Agricultural Management Systems. Transactions of the ASAE. 30:1403-1418.
Crossref |
|
|
|
Moncada A (2004). Environmental fate of diuron. Environmental Monitoring Branch Department of Pesticide Regulation 1001 I Street Sacramento, CA 95812-4015.
View
|
|
|
|
OECD (Organisation for Economic Co-operation and Development) (1999). Annex II. Report of the OECD Project Pesticide Aquatic Risk Indicators pp. 28–32.
View
|
|
|
|
Pinho AP, Matos AT, Costa LM, Morris LA, Martinez MA (2006). Modeling of herbicide retention in riparian zones. Rev. Bras. Engenharia Agríc. Ambiental. 10:896-902. |
|
|
|
Plese LPM, Silva CL, Foloni LL (2009). Distribution of environmental compartments of herbicides used in the cotton, coffee and citrus culture. Planta Daninha, Viçosa, MG 27:123-132. |
|
|
Pruski FF, Ferreira PA, Ramos MM, Cecon PR (1997). Model to design level terraces. J. Irrig. Drain. Engineer. 123:8-12.
Crossref |
|
|
|
Pruski FF, Brandão VS, Silva DD da (2006). Escoamento superficial. Viçosa, MG: Editora UFV, 2° ed. |
|
|
|
Rivard L (2003). Environmental Monitoring Branch / Department of Pesticide Regulation. Environmental Fate of Metolachlor. California. |
|
|
|
Silva AV, Monteiro JEB, Chiavegato EJ, Bernardes MS (2004). Incidence of the solar radiation in plants of cotton in three different rows. |
|
|
Schick J, Bertol I, Batistela O, Balminot Jr AA (2000). Soil erosion of a clayey inceptisol under different crop and tillage systems: ii. nutrient and organic carbon losses. Rev. Bras. Ciênc. Solo 24:427-436.
Crossref |
|
|
|
|
Weaver TB, Ghadiri H, Hulugalle NR, Harden S (2012). Organochlorine pesticides in soil under irrigated cotton farming systems in Vertisols of the Namoi Valley, north-western New South Wales, Australia. Chemosphere 88:336-343.
Crossref |
|
|
Willmott CJ, Ackleson SG, Davis RE, Feddema JJ, Klink KM, Legates DR, Odonnell J, Rowe CM (1985). Statistics for the evaluation and comparison of models. J. Geophys. Res. Oceans Ottawa 90:8995-9005.
Crossref |
|
|
Swarcewicz MK, Gregorczyk A (2013). Atrazine degradation in soil: effects of adjuvants and a comparison of three mathematical models. Pest Manage. Sci. 69(12):1346-1350.
Crossref |