ABSTRACT
Field experiment was conducted in 2012 and 2013 in three districts of Arsi zone, Oromia region, Ethiopia to evaluate the response of bread wheat cultivar “Damphe” under highland vertisols to treatments consisting of 20 factorial combinations of five N rates from urea and four P205 rates from triple super phosphate (TSP). The treatments were laid out in RCBD, replicated three times. All data were subjected to analysis of variance using SAS 9.0 Statistical Analysis Software. Treatment effects on the average grain yield (AGY) and average biological yield (ABY) were very highly significant. Number of spikes m-2, number of seeds/spike, and plant height were also significantly or very significantly affected. The main effects of fertilizer N on AGY, ABY, protein and wet gluten contents, and zeleny values of grains were also very highly significant. Leaf absorption of N increased with increased rates up to 92 kg/ha N. The N recovery efficiency (NRE) at 46 and 92 kg N/ha was 20.9% and 29.4% and the agronomic efficiency (AE) was 10.8 and 13.3 kg grain/ kg N applied, respectively. Above the 92 kg/ha N the increase in both NRE and AE declined or fell reaching 31.4 % and 12.6 kg grains/ kg N. Based on farmers capacity to invest and their inherent tendency to gradually adopt higher rates, a base recommendation of 92-46 (N- P2O5) kg/ha, which is equivalent to 160 kg/ha Urea + 100 kg/ha DAP is given. This rate was the treatment with highest marginal rate of return (MRR). Additional recommendation consisting of 138-69, and 115-46 (N- P2O5) kg/ha, equivalent to 240 kg/ha Urea + 150 kg/ha DAP and 210 kg/ha Urea + 100 kg/ha DAP is given, based on agronomic data, economic analysis, complexity in management history of different farms, and environmental considerations.
Key words: Average grain yield, agronomic data, N recovery efficiency (NRE), agronomic efficiency (AE), grain quality, marginal rate of return.
The relatively slow growth in mean national yield for bread wheat (Triticum aestivum L.) from 1.46 t ha?1 in 2004/2005 (CSA, 2005) to 2.01 t ha?1 (CSA, 2011/2012) is due to several constraining factors, such as poor crop management that include the prevalence of poor weed control, exacerbated by the limited availability of herbicides in the market and its improper use when available, depleted soil fertility and a low level of fertilizer usage, particularly of N fertilizer are among the most important. Nitrogen and phosphorus deficiency is often encountered in wheat growing areas of Ethiopia, in which the severity of the problems predominate the frequently water-logged soils- highland Vertisols (Tekalign et al., 1988; Syers et al., 2001). But, the K levels, as measured by our research center for different locations of our sub centers, was found to be very high for all study areas. Since the introduction of Vertisols technologies in the 1990s, like BBM and ridge and furrow seed bed preparation methods, the very high potential of such soil for wheat productions have been well recognized by highland Vertisols areas farmers. Nonetheless, it has been underutilized due, mainly, to the very low input use of fertilizers and poor pest management strategies. Parallel to this fact researches in the development of site and crop specific fertilizer recommendations have shown modest progress until now due, possibly, to the limited resources of the country. As a consequence of this, the old bulk recommendations continued to be practiced in many areas. Despite its continued use, the importance of zone or site specific fertilizer recommendations in the country have gained the attention of many researchers and scientists since as early as the 1990s; and the progress of the works done so far indicated that increased rates of applications of N and P increased grain yields with a very strong and significant linear response (Asefa et al., 1997; Shambel et al., 1999; Minale et al., 2004; Taye et al., 2002). Notwithstanding the contributions of these authors, the scale of work done so far is very little considering the variability of soils, climate, and cropping systems. Consequently, the demand for site specific or agroecology based fertilizer recommendations have been increasing from time to time. Coupled with the demand increased implementation of improved recommendations is one of the primary means of increasing wheat yields in Ethiopia. Therefore, a fertilizer trial was conducted in 2012 and 2013 with the main objective of developing economic optimum fertilizer recommendation for bread wheat productions in three highland Vertisols dominated districts of Arsi zone. The specific objectives of the trial were to determine the effects of different rates of N and P on the yield and yield components, grain quality, fertilizer N recovery, and agronomic efficiency of bread wheat.
Location description and soils
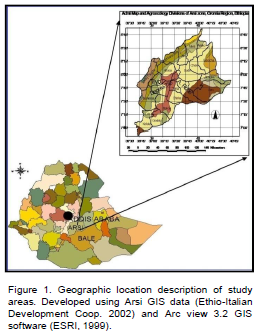
The experiment was conducted during the 2012 and 2013 main cropping seasons on farmers' fields in the south eastern highlands of Ethiopia, in the districts of Digelu-Tijo, Arsi Robe, and Tiyo. Arsi Robe is located from 8.4 to 8.6N and 40.1 to 40.4E, while Digelu-Tijo and Tiyo are located from 8.01 to 8.15N and 039.15 to 039.3E and from 7.77 to 8.03N and 38.94 to 39.31E, respectively, all in degree decimal. The altitudes of the locations vary from 2200 masl at Kulumsa to about 2500 masl at A. Robe and Digelu-Tijo. These three locations are located in the major Vertisols belts of the zone. The Long term average annual rainfall for Arsi Robe is 1040 mm and for Kulumsa (Tiyo district) above 840 mm. For Digelu-Tijo there are no weather station data to describe, but the amount and distributions are similar to the neighbouring districts. Therefore, its estimated average annual rainfall lie between 800 and 1000mm. Tepid to cool moist mid-highlands and Tepid to cool humid mid-highlands are the agroecological classification for the study areas (Ethio-Italian Development Cooperation, 2002). Even though the long term average annual rainfall for Arsi Robe is higher than the other location, its distributions are uneven. The soils vary from Haplic and Vertic Luvisols to Eutric Vertisols in Tiyo district to Eutric Vertisols in Digelu-Tijo and Arsi Robe (Ethio-Italian Development Coop. 2002). The average organic matter content for all locations is less than 2% and the texture vary from clayey to heavy clayey at Kulumsa (Tiyo) to generally heavy clayey at A. Robe and Digelu- Tijo. The K contents of the soils vary from above 680 kg/ha at the latter two locations to 2160 kg/ha at Kulumsa. These K values are higher than the standard, 340 kg/ha for high level of available K2O (Sarkar and Haldar. 2005). Generally, the study areas are part of the high potential areas for wheat production in the country; and improving the fertilizer use in these areas can bring a considerable impact for increasing productions in the zone and improving the national average wheat grain yields. Selection of trial sites on farmers’ fields was done in conjunction with local extension agents (Figure 1).
Treatments and experimental designs
This experiment was conducted to evaluate the response of recently released bread wheat variety Danda’e (KIRITATI/2*PBW65/2*SERI.IB) to treatments consisting of 20 factorial combinations of five N rates (that is, 0, 46, 92, 138, 184 kg/ ha) from urea and four P205 rates (that is, 0, 46, 92,138 kg/ha) from triple super phosphate. The treatments were laid out in a complete factorial arrangement using RCBD replicated three times. The gross plot size of the trial was 4 × 5 m (= 20 m2) and net plot size of 3 × 3 m (9 m2). The fields were prepared according to the recommended practices using the traditional oxen-plow system of the ridge and furrow with a 0.7 m wide inter-furrow spacing. Seeds were sawn according to the customary Vertisols management practices of first broadcasting on the plots and then the ridge and furrows were prepared with well experienced farmers to keep the inter-furrow spacing of 0.7 m using a small ridge and furrow maker commonly called BBM. All P fertilizer and half of the N fertilizer treatments were applied at planting and the remaining N was top-dressed at booting stage. Existing recommendation of seed rate (150 kg/ha) and a herbicide called pyroxyslam, one time per season for weed control, were used.
Data collection and analysis
Data was recorded on grain yield and yield components such as: Seedling density, number of tillers per plant, spike length, kernels per spike, thousand kernel weight (TKW), plant height, grain and biomass yield. Information on disease and pest incidences was also collected. Plant samples and grain samples were collected during the second cropping season from each treatment plot of two experimental sites at Digelu-Tijo district at the start of heading and after harvest, respectively.
Plant height and number of productive spikes/m2 were determined for each treatment before harvest. Harvesting was done by hand using sickles. Hundred culm weight (100 cw) were collected from four to five points within a plot and slashed from close to the ground surface and the dry matter yield of above-ground biomass determined. Grain yield was determined from 9 m2 net plot by hand threshing and the harvested samples weighed by using sensitive balance (capacity of 10 kg and 0.01 g sensitivity). Yield adjustments were made based on 12.5% moisture content. Above ground biomass yields were determined based on data of hundred culm weight and the harvest index (HI) calculated as the ratio of grain yield to above ground biomass yield expressed as a percentage. Thousand kernel weight (TKW) was determined by weighing 1000 grains under moisture contents adjusted to 11%.
The number of grains/spike was determined by hand counting of the number of grains of 5 spike samples and averaging them. Straw N contents were determined by micro-Kjeldahl analysis of straw sub samples (Bremner and Mulvaney, 1982) at KARC soil laboratory from the oven-dried bulk samples.
120 grain samples collected from two sites of Digelu-Tijo district for grain quality analysis. Grain Protein, starch, wet gluten, and zeleny values were determined using Near Infrared Reflectance (NIR) at Amhara Region Agricultural Research Institute (ARARI), Bahirdar, Ethiopia.
Grain N values were calculated by multiplying grain yields by the respective N content. Apparent N recovery (AR) of the grain for each treatment N was calculated as: (GNU of treatment - GNU from the control treatment) / fertilizer N applied. The GNU values were calculated from N treatments averaged over the ranges of P2O5 levels and replications making the degree of freedom 30. Agronomic efficiency (AE) of fertilizer N was calculated as: (grain yield of treatment -grain yield of control) / fertilizer N applied. Again the main effects of N were considered. Efficiency values calculated based on known procedures (Cassman et al., 2002; Fageria and Baligar, 2003; Doyle and Holford, 1993).
The method of partial budget analysis recommended by CIMMYT (1988) was used to evaluate the economic profitability of the various treatment options and determine the economic optimum rate. For continuous economic analysis predicted yield data was generated using the regression model developed for prediction of yield response under alternative fertilizer treatments. Data necessary for economic analysis was collected from the districts bureau of agriculture. All variable costs including land preparation, planting, weed control, and harvesting costs are estimated based on the actual field prices at the time of planting and immediately after harvest; and averaged over locations. The yield data used for economic analysis is the 2013 data, due to the better management conditions.
The costs of P2O5 and N fertilizer were estimated based on the cost of DAP and Urea, respectively. The Urea rates were adjusted based on the contribution of N from each treatment level of DAP to N source levels. Dominance analysis, as recommended by CIMMYT (1998), was applied to screen treatments with higher variable costs, but lower net benefits; and dominated treatments eliminated from further considerations in Marginal analysis. The minimum acceptable rate of return was taken as 100%; and treatments with lower minimum rates of return were also removed from further analysis. Finally sensitivity analysis was conducted on the selected best treatments to evaluate the effect of variability in input prices over time and space on the strength of acceptability of recommended practices under all recommendation domains.
All crop parameters data were subjected to analysis of variance using SAS 9.0 statistical software (SAS, 2002). Data were analyzed for trials combined across site and seasons. The DMRT test (P<0.05) was used to assess differences among treatment means. SPSS 20.0 statistical software was used to analyze the correlations between yield and yield components and the treatments, and for developing prediction models for grain and biomass yields. For graphical analysis of yield and yield components Origion 8 GUI and SPSS 20.0 softwares (Origin Lab Coop., 1991-2007; IBM, 1989-2011) were used.
Grain and biomass yield responses to N and P2O5 rates
Grain yields and yield components of bread wheat (Danda’e/ Damphe variety) under different fertilizer rates are presented in Tables 1 to 3. Only the main effects of each fertilizer rates on the yield and yield component responses across locations and years are summarized. The main effects of N and P2O5 on AGY and ABY are also illustrated in Figures 2 and 3; and Figures 4 to 6 exemplify the responses of the test variety in grain quality parameters.
The average grain and biological yields (AGY and ABY) at Arsi Robe and Digelu-Tijo districts in the 2012 trial results show that the main effects of N and P are very highly significantly different, with mean grain and biological yields of 2861 and 6940, as compared to the control 1606 and 3910 kg/ha, respectively. The highest AGY and ABY at Robe were 4229 and 11145 kg/ha and mean of Sagure and Tiyo 4658 and 9745 kg/ha, respectively.
The summary of 2013 results for same parameters at Digelu-Tijo and Tiyo districts of Arsi zone showed that the main effects of N and P2O5 were very highly significantly different, with mean grain and biological yields of 4134 and 9831 kg/ha. In contrast to the control treatment results of 2589 and 6554 kg/ha, the highest yields obtained were 5431 and 13299 kg/ha of AGY and ABY, respectively. The results of 2012 and 2013 at Arsi Robe (Table 3), although lower in the responses of economic yields, showed similar response patterns. Generally, the combined analysis of variance of data of 2012 and 2013 combined over locations also showed that the main effects of N were very highly significant on average grain yield (AGY), and average biological yield (ABY). Number of seeds per spike (NSPS) and number of spikes per meter square (SPM) were also very highly significantly affected by N than P. Treatment effects were also very highly significant for most of the parameters (Table 4).
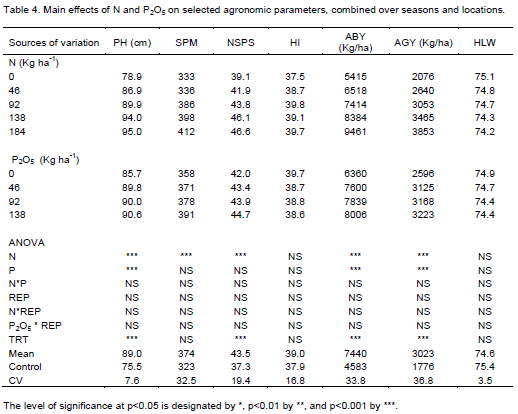
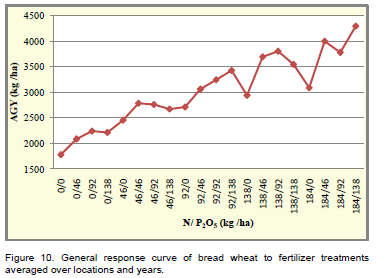
ANOVA results did not show any significant interaction effects of N and P2O5 for most parameters at all locations. But tests on mean separation showed differences due to the combined effects of the two, and their interactions were also very important to influence the response levels (Figure 10). The yield component parameters that control the AGY such as: SPM and NSPS were significantly controlled by N than P. But P was crucial to increase the yield responses within the ranges of 46 to 92 kg/ha P2O5 (Figures 2 and 3). Generally, the yield increments in the 2012, 2013, and mean of 2012/2013 vary from 111 to 146% and 103 to 142% for the highest treatments results of AGY and ABY, respectively, as contrasted to the control treatment results.
The relationship between AGY and different rates of N and P can be expressed using the following second degree polynomial equation, with R2=0.97 for AGY. The predicted average grain yield is expressed by:
Where: PAGY is predicted average grain yield, c is a constant with a value of 2667 kg/ha, a, b, d, e, and f are coefficients with values of 12.84, 12.7, 0.015, 0.07, and 0.019, respectively. The parameters PAGY, N, P2O5 are all in kg/ha. Grain yield responses of the test variety to N and P2O5 combinations, not included in the treatments, were predicted using the equations developed for AGY and the values applied during economic analysis. The model can provide very good input and yield predictions for field conditions that can be well managed. The results obtained so far are also in agreement with the works done on bread and durum wheat (Asefa et al., 1997; Shambel et al., 1999; Minale et al., 2004; Taye et al., 2002).
Effect of N and P2O5 on Grain quality
Increased rates of N had significant effect on grain protein and wet gluten contents, and zeleny values. The average protein contents obtained from highest to lowest were 13.39, 12.50, 12.0, 11.02, 10.76% from applications of 184, 138, 92, 46, 0 kg/ha N, respectively. The wet gluten contents from highest to lowest: 30.71, 29.64, 27.52, 23.73, and 23.59% were obtained from applications of 184, 138, 92, 46, and 0 kg/ha, respectively. Similarly, Nitrogen had had very high significant effect on the Zeleny values, but no significant effect on starch content. Generally, the main effects of N, when contrasted with the control treatment, increased the grain protein, wet gluten and zeleny values by 25, 34 and 44%, respectively, at the highest rate of N. The result is clearly indicative of the fact that Nitrogen is the main determining factor to improve the grain quality of bread wheat (Figure 4).
The effect of P nutrition on grain quality was insignificant (Figure 5). Protein and starch contents were not significantly affected by increasing rates of P, but Zeleny values negatively affected. The wet gluten content slightly raised at the 92 kg/ ha P2O5 rates.
Leaf analysis
Leaf samples were collected from two trial sites on farmers’ fields for analysis of N absorption by the plant. The results of the analysis indicated that absorption of N was highly significantly affected by increasing rates at (p>0.0016). The mean absorption was 2.6%. The highest rates of absorption was 2.9% from plots that received 138 kg/ha N, the second highest was 2.82% from plots that received 92 kg/ha N. The third highest was 2.58% from plots that received the highest N rates (184 kg/ha). The lowest absorption recorded was from plot that received no N.
Contrary to the effect of the highest rates of N on the grain protein or N contents, leaf absorption was intermediate to the highest rates. This may be due to, possibly, higher associated losses. The effect of different rates of P on the leaf absorption was insignificant; and no interaction effect of N and P was observed.
Fertilizer N recovery and agronomic efficiency
Fertilizer N uptake and agronomic efficiency was calculated based on data from quality analysis. The NRE steadily increased with N rates up to 92 kg/ ha, remained constant between 92 and 138 kg/ha N, and slowly rises after that. Similarly, the agronomic efficiency of N increases up to 92 kg/ha N, and declines after that. At 46 and 92 kg N/ha the NRE was 20.9 and 29.4% and the AE was 10.8 and 13.3 kg grain/ kg N applied, respectively. The highest NRE was 31.4% at the highest N. On the other hand the AE at the rates of 138 to 184 was 12.6 kg grain/ kg of N applied.
Generally, the highest response values were obtained at 92 kg N/ha (Figure 7). The results obtained so far are in agreement with the works done on bread and durum wheat (Tilahun et al., 1996).
Economic analysis
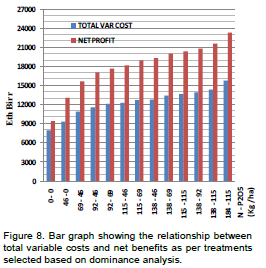
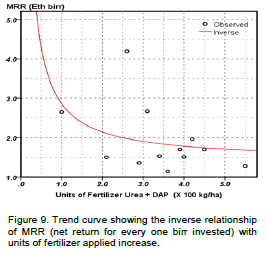
Every shift in investment from the lower selected treatments to higher resulted to more than 100% return (Figure 8). The marginal rate of return (MRR) generally varied from 1.14 to 4.19. The highest MRR was obtained from applications of 92-46 kg/ha N- P2O5. Further increases in fertilizer use, particularly of nutrient N, still held positive yield rewards. The values in the vertical axis (Figure 9) show the return in birr for every 1 birr invested on fertilizers. The highest MRR (4.19) was obtained from application of 2.61 units of fertilizer, which is equal to 160 kg/ha Urea + 100 kg/ha DAP. The MRR generally declines with increased applications of Fertilizer N (Figure 9).
Sensitivity analysis was made based on data used in the MRR analysis and with treatment results above 100% minimum rate of return, except for the control. The if-analysis was done with the assumption of an average of 30% rises in all variable costs within 3 years time, keeping the prices of the produce constant. This is one scenario in the analysis. The second scenario can consider varying both the TVC and price of produce. But, the analysis using the first scenario resulted in more than 100% minimum rate of return for the 13 selected treatments. So there was no need to go to the second scenario, as it is obvious that the second scenario can result in minimum rate of return of values greater than the first.
The additional benefits that could be obtained from the production process were straw yields, soil quality, and grain quality improvements. The additional economic advantages that could be obtained from such additional benefits were not considered in the economic analysis due to the difficulties posed in the estimation of the market values of straw, the lack of grain quality standards to set premium prices, the complexity in using the methodology for measuring the economic values associated with changes in soil qualities.
CONCLUSIONS AND RECOMMENDATIONS
The response of bread wheat to increased rates of both fertilizer N and P2O5 is very high. It is more responsive to N than P. The two year results clearly showed that the ranges of P2O5 necessarily be used to increase yield should lie between 46 and 92. The response to N levels increased up to the maximum applied rate, 184 kg/ha. But the increase in NRE with increases in applied N declined after the 92 kg/ha N. This result is a very good indication of the fact that N losses increase with increased applications of N.
From analysis of agronomic data the highest yields were obtained through applying the highest treatment of N and P. On the other hand, the results of economic analysis showed that the highest MRR was obtained from application of 92- 46 kg/ha N- P2O5.
Increased fertilizer N greatly affected the grain qualities of bread wheat, especially of grain protein and wet gluten contents and zeleny values. However, the effect of fertilizer P nutrition on grain protein, wet gluten, and zeleny values is insignificant. The result is clearly indicative of the fact that Nitrogen is the main determining factor for improving the grain quality of bread wheat.
Poor fertilizer use is one of the major bottlenecks for improving wheat yields in almost all highland Vertisols areas of Ethiopia. Farmers generally use below the optimal rates of fertilizers necessary to improve yields. Even those farmers considered to be good users took for granted DAP fertilizer as the most important input to sustain or improve productions. However, the results of this experiment and many previously done works proved otherwise. The use of chemical fertilizer has to be increased above the currently practiced rates, especially of nutrient N.
Based on farmers capacity to invest, their tendency to gradually adopt higher rates, and the MRR values, the 92-46 (N- P2O5) kg/ha, equivalent to 160 kg/ha Urea + 100 kg/ha DAP is recommended. It would be better to advice poor farmers to start with this lowest level recommendation. With the increasing benefits they experience they can progressively develop to higher levels. Based on the need to attain the long term high yield goals set by planners, the 138-69 (N-P2O5) kg/ha, equivalent to 240 kg/ha Urea + 150 kg/ha DAP is recommended. For some lead farmers and for progressive use by resource poor farmers providing an intermediate recommendation of 115-46 (N- P2O5) kg/ha, equivalent to 210 kg/ha Urea + 100 kg/ha DAP is necessarily given. However, care need be taken when using the highest recommendation. It should specifically applied to farms with a very poor management history (very low or no fertilizer use, no crop rotations and residue management).
Sensitivity analysis showed that the improved recommendation would remain highly profitable for years to come; and that the validity of the recommendations made could continue over the course of time across the recommendation domains. The results of the trial can be extrapolated to other Vertisols areas of similar agroecology,
Increased N fertilizer use, particularly above the 92 kg/ha rate, should consider increased application frequency to minimize losses. The current practice or teaching is to split in to two; and this practice does not consider the changes in crops response and N recovery efficiency at very low and very high rates.
The issue of fertilizer use efficiency (FUE) that include timing and frequency at very low and very high rates, under major agroecological conditions, therefore, need be considered as one research agenda for further work.
This research was financed by Eastern Africa Agricultural Productivity Improvement Project-Wheat Regional Center of Excellence (EAAPP-WRCoE). Vehicles and management supports were provided by Kulumsa Agricultural Research Center/ EIAR. Therefore, due acknowledgement is given to both. The authors would also like to acknowledge Dr Tadesse Desalegn, technical coordinator for EAAPP-WRCoE and Dr Alemayehu Assefa, coordinator of EAAPP project, for their sincere follow up of all project activities and preparation of manuscripts for the project. The authors would like to extend acknowledgements to Tesfaye Solomon for the support he gave on the use of SPSS 20 statistical analysis tool and Abebe Kirub for editing the first draft of the manuscript.
The authors have not declared any conflict of interest.
REFERENCES
|
Asefa T, Tanner DG, Kefyalew G, Amanuel G (1997). Grain yield of wheat as affected by cropping sequence and fertilizer application in southeastern Ethiopia. Afr. Crop Sci. J. 5:147-159. |
|
|
|
Bremner JM, Mulvaney CS (1982). Total nitrogen, in A.L. Page, R.H. Miller, and D.R. Kenney, Eds. Method of Soil Analysis, Part 2, Agronomy Monograph No. 9, Am. Soc. Agron. Madison, WI, pp. 595-624. |
|
|
Cassman KG, Doberman A, Walters DT (2002). Agroecosystems, nitrogen use efficiency, and nitrogen management. Ambio 31:132-140.
Crossref |
|
|
|
CIMMYT (1988). From agronomic data to farmer recommendations: An Economics Training Manual. Completely revised edition. Mexico, D.F. |
|
|
|
CSA (2005). Report on Area and Production of Major Crops (Private Peasant Holdings, Meher Season). Statistical Bulletin. Volume I. May. 2005. Addis Ababa. |
|
|
|
CSA (2011). Report on area and production of major crops (private peasant holdings, Meher season). Statistical Bulletin. Volume I. April 2011, Addis Ababa. |
|
|
|
Doyle AD, Holford ICR (1993). The uptake of nitrogen by wheat, its agronomic efficiency and their relationship to soil and fertilizer nitrogen. Aust. J. Agric. Res. 44:1245-1258. |
|
Crossref |
|
|
|
|
ESRI (Environmental Systems Research Institute) (1999). ESRI (Environmental Systems Research Institute) (1991-1999). Arc View GIS 3.2. Software Program. USA. |
|
|
|
Ethio-Italian Developemtn Cooperation (2002). Atlas of Arsi zone. Arsi-Bale Rural Development Project. Arsi zone Planning and Economic Developemnt Office. Regional State of Oromia. GIS sub unit. |
|
|
Fageria NK, Baligar VC (2003). Methodology for evaluation of lowland rice genotypes for nitrogen use efficiency. J. Plant Nutr. 26:1315-1333.
Crossref |
|
|
|
IBM Corporation (2011). IBM Corporation (1989-2011). SPSS Statistical Software. Version P. 20. |
|
|
|
Minale L, Alemayehu A, Tilahun T, Abreham M (2004). Response of Bread Wheat to Nitrogen and Phosphorous Fertilizers at Different Agroecologies of Northwestern Ethiopia. In Proceedings of the 12th Regional Wheat Workshop for Eastern, Central and Southern Africa. Nakuru, Kenya. PMid:15144491 |
|
|
|
Origin Lab Coorporation (2007). Origin Lab Coorporation (1991-2007). Origin 8 Graphical User Interface (GIU). Northampton. MA 01060 USA. |
|
|
|
Sarkar D, Haldar A (2005). Physical and Chemical Methods in Soils Analysis. Fundamental Concepts of Analytical Chemistry and Instrumental Techniques. ISBN. New Age International Limited. New Delhi. |
|
|
|
SAS Institute (2002). The Statistical Analysis Software System for Windows. Version 9.00. TS Level 00M0. SAS Institute Inc., Cary NC. USA. |
|
|
|
Shambel M, kefyalew G, Workiye T, Amanuel G, Mekonnen K (1999). On-farm N & P fertilizer trial in Bread wheat on vertisols in South eastern Ethiopia. Agronomy and Crop Physiology progress report. Kulumsa Agricultural Research Center. EIAR. Ethiopia. |
|
|
|
Tekalign M, Haque I, Kamara GS (1988). Phosphorus status of some Ethiopian Highland Vertisols. In Proceeding of Management of Vertisols in the Sub-Saharan Africa. International Livestock Center for Africa. Addis Ababa. Ethiopia. |
|
|
|
Syers JK, Craswell ET, Nyamudeza P (2001). Research Needs and Opportunities for Farming Vertisols Sustainably. In ed. Syers JK, Penning FW, Nyamudeza P (2001). The Sustainable Management of Vertisols. CABI Publishing. New York. USA. |
|
|
|
Taye B, Yesuf A, Sahlemedhin S, Amanuel G, Mohammed H, Tanner DG, Tesfaye T (2002). Optimizing Fertilizer Use in Ethiopia. Correlation of Soil Analysis with Fertilizer Response in Hetosa Wereda, Arsi Zone. EARO/SG-2000 Collaborative Research. |
|
|
|
Tilahun G, Tanner DG, Tekalign M, Getinet G (1996). Response of rainfed bread and durum wheat to source, level and timing of nitrogen fertilizer on two Ethiopian Vertisols: II. N uptake, recovery and efficiency. Kluwer Academic Publishers. Printed in the Netherlands. |
|
|